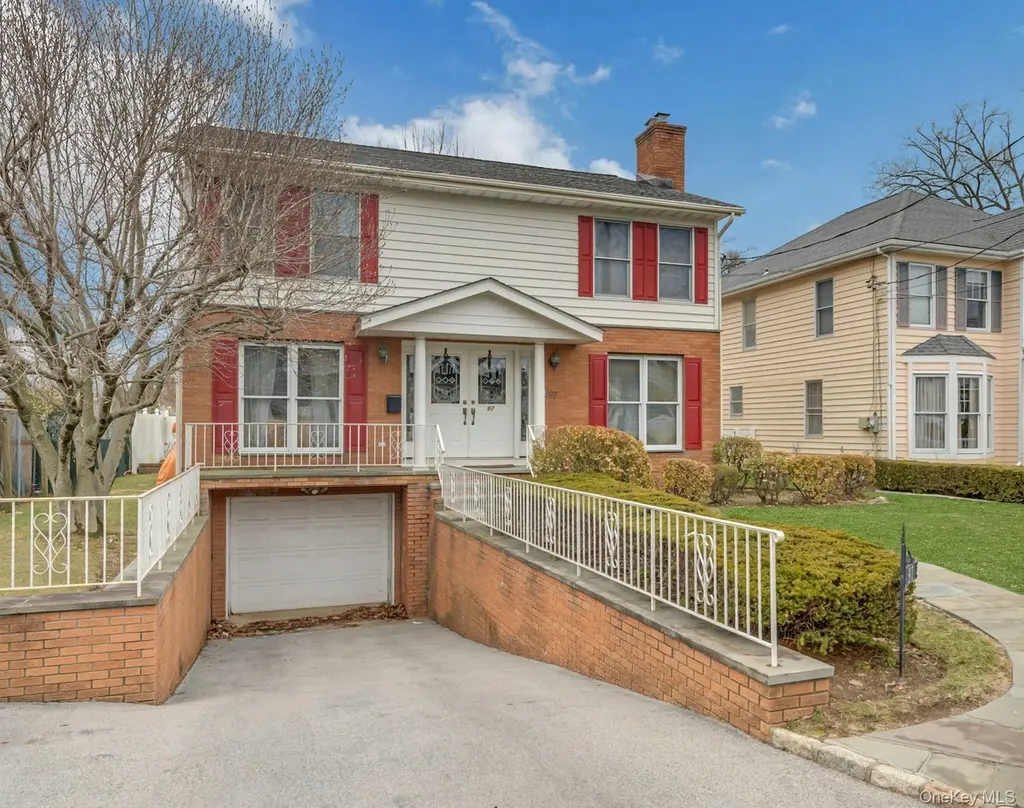
97 Bradley Rd · Eastchester, NY
Flood risk 1/10 · Minimal
- FEMA flood zone
- X (unshaded)
- Chance of flooding over 30 yrs
- 0.0%
- Est. flood insurance / yr
- $507 – $1,088
Fire risk 1/10 · Minimal
- Est. fire insurance / yr
- $691 – $1,283
Heat risk 6/10 · Moderate
- Hot days now (above 98°F)
- 7 days/yr
- Hot days in 30 yrs
- 15 days/yr
Wind risk 6/10 · Moderate
- Chance of severe wind over 30 yrs
- 27.0%
Air-quality risk 4/10 · Minor
- Unhealthy air days now
- 3 days/yr
- Unhealthy air days in 30 yrs
- 5 days/yr
Risk factors via First Street. Map © Google.
Why this score? — see what drove the D+ grade
The composite is a weighted blend of 9 inputs, each scored 0–100. Each bar is that input's sub-score; the figure is the points it added to the 100-point composite (weight × sub-score).
- ARV discount +15.0/15.0
- Cash flow +10.7/30.0
- Schools +7.2/10.0
- 1% rule +3.9/10.0
- Livability +3.9/5.0
- DSCR +3.1/10.0
- Rent growth +2.5/5.0
- Condition / age +2.5/5.0
- Appreciation +0.0/10.0
$1,200,000
🖨 Deal sheet (PDF) 📄 Offer letter ✓ Due diligence
Listing remarks
Welcome to this Beautiful, Young 4-Bedroom Colonial Home (1990) Offering the Perfect Blend of Style, Comfort, and Functionality. Step Inside to Find Bright, Generously sized Rooms thoughtfully designed for both Everyday Living and Entertaining. Situated in the Scarsdale PO Section of Eastchester, this Home Boasts a Spacious Kitchen with an abundance of Countertop Space & Cabinetry Complete with a Peninsula. The adjoining Dining area Flows Seamlessly into the Inviting Family Room with/Fireplace, alongside a Formal Living Room with an additional Fireplace, an Elegant Dining Room and a Convenient Home Office Alcove. Large windows Throughout fill the Interior with Natural Light, while bot
Key facts
- 5,000 sq ft lot
- Garage
- Built 1990
Property features AI
Exterior
- Parking: Driveway; Garage; Total parking for 4 vehicles; 1 garage space
- Utilities: Con-Edison electric service; Public sewer; Cable connected; Electricity connected; Natural gas connected; Sewer connected; Public trash collection; Water connected; Additional parcels: none; Basement: unfinished with storage space; Attic access via scuttle
- Home design: Single family residence; Measured living area
- Construction: Frame construction
- Exterior features: Partial fencing; Front yard; Back yard; Not waterfront
Interior
- Kitchen: Dishwasher; Gas range; Refrigerator
- Bedrooms: Two levels (total rooms: 9); Walk-in closet(s)
- Flooring: Carpet; Wood
- Bathrooms: 2 full bathrooms; 2 half bathrooms
- Heating & cooling: Central air; Baseboard heating; Hot water heating; Oil heating
- Interior features: Eat-in kitchen; Entrance foyer; Formal dining room; Open kitchen; Primary bathroom; Recessed lighting; Storage; Walk-in closets; Washer/dryer hookup; Oversized windows; Patio and porch
- Laundry & utility: Washer; Dryer; Laundry located in bathroom, in hall, and inside
Neighborhood map
What this means for you Summary
Snapshot
- This is a 4-bed/3.0-bath single-family listed at $1.20M.
Deal economics
- At list price, monthly cash flow is $-560 ($-7k/yr) — negative.
- To cash-flow at today's rent, offer at most $1.10M (8.2% below list).
- To meet the 1% rule (rent ≥ 1% of price), the offer needs to be $1.07M (11.1% below list).
- Recommended offer: $1.07M (11.1% below list) — sets the bar for 1% rule.
- Cap rate 5.7% vs local median 4.2% in Eastchester — top-decile yield for the area; either an underpriced asset or a hidden risk that comps aren't pricing in. Stress-test before assuming the spread holds.
Location & tenants
- Location reads 78/100 on livability (#159 in NY, #2,451 nationally) — a middle-class / working-renter tenant base. Strengths: crime A+, commute A+, employment A+; Watch: amenities D-, cost of living F, health & safety D-.
- Eastchester Union Free School District (suburban): math 79% / reading 80% proficiency, ranked #42 of 590 in NY (top 7%) — strong family-tenant draw, lease renewals of 3-5y typical; only 2% free/reduced lunch — higher-income household profile.
- Zoned schools: Greenvale School (math 88% / reading 88%, grade A+, #64 of 2,108 statewide, top 3%, 508 students, 0% FRL); Eastchester Middle School (math 56% / reading 76%, grade A-, #118 of 729 statewide, top 16%, 694 students, 0% FRL); Eastchester Senior High School (math 100% / reading 84%, grade A+, #171 of 1,100 statewide, top 18%, 976 students, 0% FRL) — zoned schools at 0% FRL track the district average.
- Market conditions: 293 active listings in the ZIP; 5 comparable units currently listed for rent nearby; rentals leasing fast (median 0d on market — plan ~1-2 weeks tenant-placement turnaround); high-income renter base; 954 units permitted in Westchester County in 2024 (649 in 5+ unit buildings).
- At $10,671/mo this rent would consume 51% of the median local household income ($250k/yr) (locally 560% of renters already pay >50% of income on rent) — very limited rent-growth headroom before tenants either downsize or default.
Forward outlook
- Local home prices are declining (-3.0%/yr); year-one equity from $8k of loan paydown is wiped out by about $36k of value loss. Plan a longer hold.
- Westchester County population projected at +10% by 2050 — modest demand growth; plan on rents tracking national, not racing it.
Negotiation context
- It's been on market 26 days — a 2% lower offer ($1.18M) is reasonable based on typical stale-listing flexibility.
Risks & watch-outs
- Climate carrying-cost: major wind risk, 27% chance of damaging wind over 30y; extreme-heat days projected 7→15/yr by 2055 (HVAC capex compounding) — expect insurance premiums to compound above CPI over the hold.
Questions for the listing agent
- What do current leases actually rent for vs. the listed asking? Can we see a recent rent roll and the last 12 months of T-12 income?
- Is there a deadline driving the sale (1031 exchange, divorce, estate, relocation)? That informs how much negotiation room exists.
- Schools are A-rated — typically a magnet for longer-tenancy family renters. What's the average tenant stay here, and is there a school-zone premium baked into asking?
- The area grade is low — what's the realistic commute time and amenity access for the typical tenant pool here? Any planned neighborhood developments (good or bad) we should know about?
- What's the average days-on-market for RENTAL listings here right now (not sales)? A rising rental-DOM trend means longer vacancies and softer asking-rent achievability than the comps imply.
- What's the recent tenant-quality profile in this submarket — average credit score on applications, eviction rate, late-payment / NSF rate, and stable-employment percentage? A property-management company in the area should have these aggregated.
- How much new for-sale + rental construction is in the pipeline within 1–3 miles? Heavy new supply typically softens prices + rents 12–24 months out; constrained supply supports both.
Investment metrics
- 1% rule
- 0.89% ✗
- Cap rate
- 5.73%
- Cash-on-cash
- -2.00%
- DSCR
- 0.91
- GRM
- 9.4
CMA / ARV
- ARV (on-the-fly)
- $1,734,474
- Comps found
- 12
Show comp detail 12 sales within ~0.75 mi
| Address | Dist | Beds/Ba | Sqft | Sold | Price | $/sf | Match |
|---|---|---|---|---|---|---|---|
| 130 Locust Ave | 0.10mi | 3/2.5 (-1) | 2,400 (-6%) | 1mo | $1,619,000 | $675 | 77 |
| 155 Hilburn Rd | 0.39mi | 4/3.0 | 2,429 (-5%) | 3mo | $1,670,000 | $688 | 71 |
| 32 Lambert Ln | 0.52mi | 4/3.0 | 2,464 (-4%) | 1mo | $890,000 | $361 | 68 |
| 18 Tunstall Rd | 0.45mi | 5/3.5 (+1) | 2,650 (+3%) | 1mo | $1,950,000 | $736 | 65 |
| 144 Gaylor Rd | 0.24mi | 4/3.5 | 2,225 (-13%) | 2mo | $1,425,000 | $640 | 63 |
| 85 Vernon Dr | 0.51mi | 4/2.5 | 2,450 (-4%) | 6mo | $1,150,000 | $469 | 62 |
| 88 Lakeview Ave | 0.57mi | 4/2.5 | 2,459 (-4%) | 7mo | $1,501,000 | $610 | 59 |
| 234 Boulevard | 0.30mi | 3/3.5 (-1) | 2,254 (-12%) | 0mo | $1,887,000 | $837 | 58 |
| 14 Shady Ln | 0.60mi | 4/4.5 | 2,397 (-6%) | 6mo | $1,975,000 | $824 | 50 |
| 151 Hilburn Rd | 0.38mi | 3/2.0 (-1) | 2,215 (-14%) | 2mo | $1,500,000 | $677 | 49 |
| 73 Ewart St | 0.60mi | 3/2.5 (-1) | 2,250 (-12%) | 4mo | $1,165,000 | $518 | 41 |
| 1 Windsor Ln | 0.58mi | 3/2.5 (-1) | 2,252 (-12%) | 5mo | $1,950,000 | $866 | 41 |
Match score weights: distance 35% · size 25% · config 20% · recency 20%. Top-matched comps best support the ARV.
Projected returns pro-forma
-3.0% appreciation · 3.0% rent growth · sell at horizon
- IRR
- -19.5%
- Equity multiple
- 0.32×
- Total profit
- $-229,536
- Equity at exit
- $178,924
- IRR
- -12.2%
- Equity multiple
- 0.28×
- Total profit
- $-243,417
- Equity at exit
- $103,754
Cash invested: $336,000 (down + closing). Projections, not guarantees.
Landlord ↔ Tenant lean methodology
- Overall (STATE)
- 15 Strongly Tenant-Friendly
- State New York
- 15 Strongly Tenant-Friendly · D+10
- County
- — inherits STATE
- City
- — inherits STATE
ZIP-level market 10583
- Active inventory
- 293
- Price-to-rent
- 9.4×
Monthly cashflow live
- Estimated rent
- $10,671 high interval (Pro) →
- Mortgage (P&I)
- −$6,293
- Tax from tax record
- −$2,198 /mo · $26,370/yr
- Insurance
- −$500
- HOA
- −$0
- Vacancy / Maint / Mgmt
- −$2,241
- Net cashflow
- $-560
Break-even live
Sensitivity live
| Price | -10% $119 | -5% $-220 | +0% $-560 | +5% $-900 | +10% $-1,239 |
|---|---|---|---|---|---|
| Rent | -10% $-1,403 | -5% $-982 | +0% $-560 | +5% $-139 | +10% $283 |
| Rate | -1.0pp $44 | -0.5pp $-255 | base $-560 | +0.5pp $-871 | +1.0pp $-1,187 |
UW: 25.0% down · 7.5% · 30yr · 1.5% tax · 5.0% vac · 8.0% maint · 8.0% mgmt
Financing live
Cash to close
- Down payment
- $300,000
- Closing costs
- $36,000
- Reserves months
- —
- Total cash needed
- —
Loan-product check · same deal, 3 products live
Conventional
25% down · 7.5% · 30yr
- Down + closing
- —
- Monthly P&I
- —
- Monthly cashflow
- —
- DSCR
- —
- Eligible?
- —
Personal DTI + credit; lowest rate.
DSCR
20% down · 8.5% · 30yr
- Down + closing
- —
- Monthly P&I
- —
- Monthly cashflow
- —
- DSCR
- —
- Eligible?
- —
No personal income docs; deal must DSCR.
Hard money
10% down · 12.0% · 12mo
- Down + closing
- —
- Monthly P&I
- —
- Monthly cashflow
- —
- DSCR
- —
- Eligible?
- —
Short-term bridge; refi at stabilization.
Rent comps 5 comps
| Address | Beds | Baths | Sqft | Rent | $/sqft | DOM | Units | Dist |
|---|---|---|---|---|---|---|---|---|
| 109 Lee Rd Scarsdale, NY | 5.0 | 3.5 | 3109 | $15,000 | $4.82 | 12d | 1 | 0.60mi |
| 58 Marion Dr New Rochelle, NY | 4.0 | 3.0 | 3246 | $11,000 | $3.39 | 0d | 1 | 0.94mi |
| 4 Greentree Dr Scarsdale, NY | 4.0 | 2.5 | 2086 | $6,850 | $3.28 | 0d | 1 | 1.09mi |
| 372 Heathcote Rd Scarsdale, NY | 4.0 | 3.0 | 2826 | $12,000 | $4.25 | 0d | 1 | 1.27mi |
| 75 Lord Kitchener Rd New Rochelle, NY | 4.0 | 4.5 | 3032 | $10,000 | $3.30 | 6d | 1 | 1.37mi |
Listing history 3 events
-
2026-05-01status Pending
-
2026-04-06$1,200,000 Active
-
2026-04-03historical $1,200,000
ⓘ Source: listings_history table (triggers on properties + properties_extension) + one-shot
backfill from property_details.listing_events for pre-trigger history.
Tax reassessment forecast NY · Partial reset (capped growth)
- Current annual tax
- $26,370 · $2,198/mo
- Projected year-2 tax
- $26,370 · $2,198/mo
- Expected delta
- $0/yr ($0/mo · 0.0%)
ⓘ Screening estimate from a state-policy table — verify with the county assessor before closing.
Climate risk First Street
- Flood 1/10 Low FEMA zone X (unshaded) · 0% chance over 30 yrs
- Wildfire 1/10 Low
- Heat 6/10 Major 7 d/yr ≥98°F today · 15 d/yr by 30 yrs out
- Wind 6/10 Major 27% chance of damaging wind over 30 yrs
- Air quality 4/10 Moderate 3 unhealthy d/yr today · 5 by 30 yrs out
Nearby sold comps map
Loading sold comps map…
Walkable amenities ~0.75 mi
Loading nearby amenities…
Taxation est. · year 1
- Rental income
- $128,056
- − Mortgage interest
- −$67,219
- − Property taxes
- −$26,370
- − Insurance
- −$6,000
- − Repairs & maintenance
- −$10,244
- − Management
- −$10,244
- − Depreciation
- −$34,909
- Taxable loss
- −$26,931
- Est. tax savings @ 24.0%
- +$6,463
- After-tax cash flow
- $-258/yr
For passive investors: Depreciation is non-cash, so a rental often shows a tax loss while cash-flowing — sheltering income. Rental losses are passive: they offset passive income freely, and up to $25,000/yr can offset ordinary (W-2) income if you actively participate and your MAGI is under $100k (phasing out to $0 by $150k); unused losses carry forward. On sale, claimed depreciation is recaptured at up to 25%, and gains may owe capital-gains tax (a 1031 exchange can defer both). Figures are a year-1 estimate at your 24.0% rate — not tax advice; consult a CPA.
Schools (NCES district)
- District
- Eastchester Union Free School District
- NCES district ID
- 3610080
- Math proficiency
- 79% ▲ 1.00%
- Reading proficiency
- 80% ▲ 9.00%
- Median HH income
- $96,944
- Composite
- 71.74/100
- National rank
- #216
- State rank
- #42 of 590 in NY
Livability — Eastchester
- Score
- 78/100
- State rank
- #159
- US rank
- #2451
Category grades
Schools grade is shown separately in the Schools card above.
Census & demographics
- Census place
- Eastchester, NY
- County
- Westchester County · 709,332 people
- City population
- 10,274
- Metro
- New York-Newark-Jersey City, NY-NJ-PA
- Population (ZIP)
- 40,207
- Household income
- $250,001
- Rent vs Own
- Severe rent burden
- 560.0
Population outlook (Westchester County) Hauer SSP2
- Today (2025)
- 1,028,035 people
- By 2030
- 1,051,636 · +2.3%
- By 2040
- 1,098,520 · +6.9%
- By 2050
- 1,136,044 · +10.5%
- By 2075
- 1,196,925 · +16.4%
- By 2100
- 1,175,147 · +14.3%
Race, ethnicity, and origin ACS 2023
- Neighborhood character
- Diverse neighborhood (Simpson 0.55)
- Race & ethnicity
- White 63% Asian 20% Hispanic / Latino 8% Two or more races 7% Black 3%
- Hispanic origin (detail)
- Puerto Rican 2% Dominican 2%
- Common ancestry
- Scotch-Irish 6% Romanian 5% Italian 3%
- Foreign-born
- 25% · Canada, China, South Korea
- Languages at home
- 72% English-only · Other Indo-European 8% Chinese 6% Spanish 5%
Political lean MEDSL · Westchester
- 2024 margin
- Strong D (+26.3) · D 63.1% · R 36.9%
- 2008→2024 swing
- -1.3pp toward R · 2008: 27.6pp · 2024: 26.3pp
- All cycles
- 2024: D+26.3 2020: D+36.3 2016: D+32.8 2012: D+22.2 2008: D+27.6
Not yet ingested
- Civics
- —
Market trends
- HPI YoY
- ▼ -851.83%
- Current HPI
- 283.4725
- Rent YoY
- —
- Metro
- New York-Newark-Jersey City, NY-NJ-PA
- State GDP YoY
- ▲ 2.60%
- F500 in state
- 92
Industry mix (Fortune 500 HQ in NY)
| Industry | F500 HQs | Revenue |
|---|---|---|
| Financial Services | 10 | $950B |
|
||
| Consumer Goods | 9 | $162B |
|
||
| Insurance | 4 | $225B |
|
||
| Telecommunications | 2 | $144B |
|
||
| Pharmaceuticals | 2 | $112B |
|
||
| Media / Entertainment | 2 | $69B |
|
||
Price history
+0.0% since first listed3 events — show timeline
- 2026-05-01 Pending — OneKey® MLS as Distributed by MLS Grid
- 2026-04-06 Listed $1,200,000 OneKey® MLS as Distributed by MLS Grid
- 2026-04-03 Coming Soon $1,200,000 OneKey® MLS as Distributed by MLS Grid
Property tax history
+2.9%/yrLatest (2025): $26,370 · +3.0% YoY. Source: county tax records.
Cash-flow waterfall
monthlySold comps — $/sqft
last 12 mo · ≤1 miLoading sold comps…