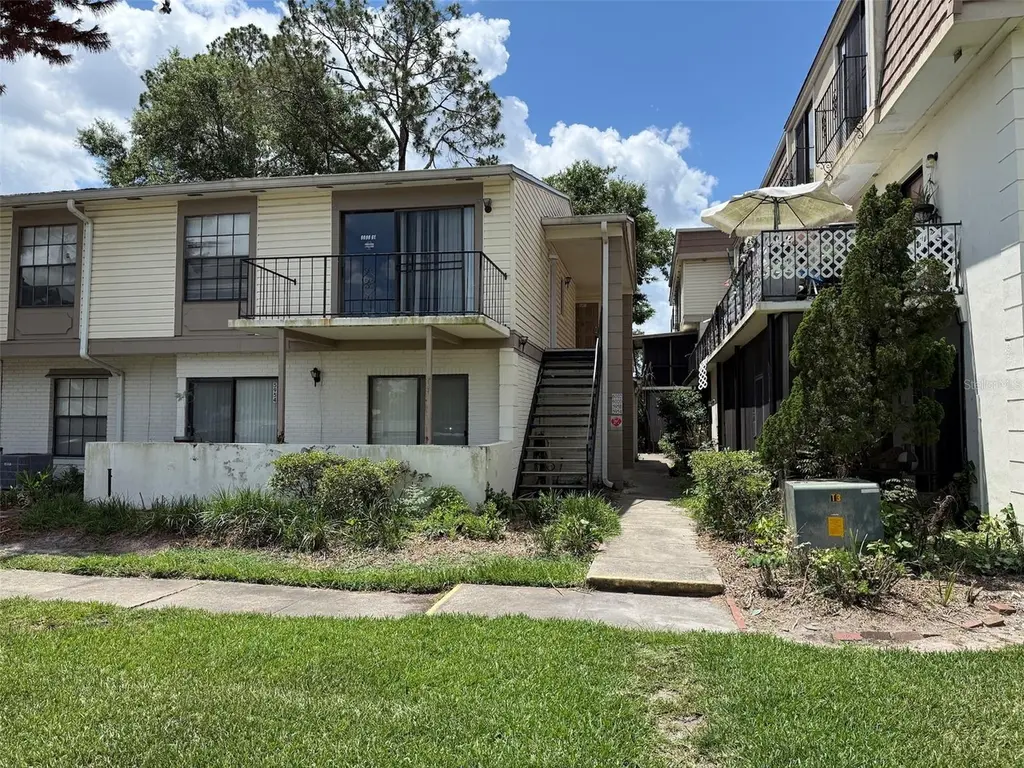
6000 Village Cir #6000 · Orlando, FL
Flood risk 1/10 · Minimal
- FEMA flood zone
- X (unshaded)
- Chance of flooding over 30 yrs
- 0.0%
- Est. flood insurance / yr
- $507 – $1,088
Fire risk 1/10 · Minimal
- Est. fire insurance / yr
- $947 – $1,759
Heat risk 9/10 · Severe
- Hot days now (above 108°F)
- 7 days/yr
- Hot days in 30 yrs
- 22 days/yr
Wind risk 9/10 · Severe
- Chance of severe wind over 30 yrs
- 99.0%
Air-quality risk 2/10 · Minimal
- Unhealthy air days now
- 1 days/yr
- Unhealthy air days in 30 yrs
- 1 days/yr
Risk factors via First Street. Map © Google.
Why this score? — see what drove the B- grade
The composite is a weighted blend of 9 inputs, each scored 0–100. Each bar is that input's sub-score; the figure is the points it added to the 100-point composite (weight × sub-score).
- Cash flow +26.1/30.0
- 1% rule +10.0/10.0
- DSCR +8.8/10.0
- ARV discount +7.5/15.0
- Livability +4.3/5.0
- Schools +4.1/10.0
- Condition / age +2.5/5.0
- Rent growth +2.3/5.0
- Appreciation +0.0/10.0
$75,000
🖨 Deal sheet 📄 Offer letter ✓ Due diligence
Listing remarks MLS
This 2/1.5 condo features new vinyl and ceramic tile. Updated kitchen. Located near shopping and airport
Key facts
- Close to schools
- Close to restaurants
- End unit
Tags
Property features AI
Finance
- Other: No lease restrictions; Unfurnished
- Financial info: Total monthly condo/association fees: $379; Total annual fees: $4,548
- HOA & community: Monthly condo fee of $379 (includes pool, maintenance of structure and grounds, recreational facilities); Association: Carol Rumely; HOA required, monthly; Community features include deed restrictions, pool, and tennis courts; Pets allowed: cats and dogs (max ~35 lbs)
Exterior
- Parking: No parking details provided
- Security: No security details provided
- Utilities: Public water; Public sewer; Broadband/high-speed internet available; Cable available; Electricity available and connected; Sewer connected
- Home design: Residential condominium; Fixer condition; Second-floor unit; North-facing
- Construction: Vinyl siding and frame construction; Shingle roof; Slab foundation; Built as part of Building F
- Exterior features: Balcony; Sliding doors; Asphalt road access
Interior
- Kitchen: Dishwasher; Range; Refrigerator
- Bedrooms: 2 bedrooms
- Flooring: Ceramic tile; Elevator not present
- Bathrooms: 1 full bath; 1 half bath
- Heating & cooling: Central heating; Central air conditioning
- Interior features: Ceiling fans
- Laundry & utility: Washer; Dryer; Laundry inside; Inside utility room
Neighborhood map
What this means for you Summary
Snapshot
- This is a 1-bed/2.0-bath condo listed at $75k.
Deal economics
- At list price, monthly cash flow is $189 ($2k/yr) — positive.
- The deal already cash-flows at list — no discount required.
- Meets the 1% rule at list price ($2k rent vs $75k).
- Recommended offer: $74k (1.5% below list) — sets the bar for market timing.
- Cap rate 9.3% vs local median 3.0% in Orlando — top-decile yield for the area; either an underpriced asset or a hidden risk that comps aren't pricing in. Stress-test before assuming the spread holds.
Location & tenants
- Location reads 86/100 on livability (#12 in FL, #360 nationally) — a professional / high-income tenant draw. Strengths: amenities A+, commute A+, housing A+.
- Orange (suburban): math 46% / reading 51% proficiency, ranked #43 of 73 in FL (top 59%) — families likely to look elsewhere, expect single-tenant / working-renter base with shorter leases.
- Zoned schools: Ventura Elementary (math 26% / reading 34%, grade F, #1,882 of 2,144 statewide, top 88%, 596 students, 66% FRL); Colonial High (math 16% / reading 33%, grade F, #505 of 667 statewide, top 79%, 3,442 students, 62% FRL).
- Zoned-school proficiency averages 27% at this address vs 48% district-wide (-21 pts) — the specific schools serving this property underperform the Orange average; the district grade overstates school quality for this exact location.
- Market conditions: Rents soft (-0.7%/yr); 372 active listings in the ZIP; 40 comparable units currently listed for rent nearby; rentals at typical pace (median 18d on market — plan ~3-4 weeks tenant-placement turnaround); 8,053 units permitted in Orange County in 2024 (3,133 in 5+ unit buildings).
- This rent runs 32% of the median local income ($57k/yr) — at the standard rent-burdened threshold; future hikes will face affordability resistance.
Forward outlook
- Local home prices are declining (-3.0%/yr); year-one equity from $519 of loan paydown is wiped out by about $2k of value loss. Plan a longer hold.
- Orange County population projected at +52% by 2050 — long-run rental-demand tailwind backs the buy-and-hold thesis.
Negotiation context
- It's been on market 15 days — a 2% lower offer ($74k) is reasonable based on typical stale-listing flexibility.
- 3 sale attempts since 6y ago with the ask held roughly flat each time — persistent listings suggest the price (not the market) is what's stuck; bring a comps-based counter.
Risks & watch-outs
- Watch-outs: property tax is 3.1% of price; HOA is 25% of rent.
- Climate carrying-cost: severe wind risk, 99% chance of damaging wind over 30y; extreme-heat days projected 7→22/yr by 2055 (HVAC capex compounding) — expect insurance premiums to compound above CPI over the hold.
Questions for the listing agent
- Built in 1977 — when were the roof, HVAC, electrical panel, plumbing, and water heater last replaced?
- Property tax is high relative to price — has the assessment been appealed recently, and will the sale trigger a re-assessment?
- What does the HOA fee cover, when was the last increase, and are there any pending special assessments or reserve-fund shortfalls?
- Any open or pending special assessments — roof, HVAC, plumbing, elevator, façade? What's the per-unit balance and payoff schedule, and is the seller paying it off at close or rolling it to the buyer?
- Is there a deadline driving the sale (1031 exchange, divorce, estate, relocation)? That informs how much negotiation room exists.
- Schools are B-rated — typically a magnet for longer-tenancy family renters. What's the average tenant stay here, and is there a school-zone premium baked into asking?
- What's the average days-on-market for RENTAL listings here right now (not sales)? A rising rental-DOM trend means longer vacancies and softer asking-rent achievability than the comps imply.
- What's the recent tenant-quality profile in this submarket — average credit score on applications, eviction rate, late-payment / NSF rate, and stable-employment percentage? A property-management company in the area should have these aggregated.
- How much new apartment / multifamily construction is in the pipeline within 1–3 miles? Heavy new supply (>2% of stock underway) typically softens rents 12–24 months out; light construction supports rent growth.
Investment metrics
- 1% rule
- 2.01% ✓
- Cap rate
- 9.31%
- Cash-on-cash
- 10.79%
- DSCR
- 1.48
- GRM
- 4.2
CMA / ARV
No comps found within radius.
Projected returns pro-forma
-3.0% appreciation · 0.0% rent growth · sell at horizon
- IRR
- -5.7%
- Equity multiple
- 0.80×
- Total profit
- $-4,220
- Equity at exit
- $11,183
- IRR
- -3.7%
- Equity multiple
- 0.81×
- Total profit
- $-3,942
- Equity at exit
- $6,485
Cash invested: $21,000 (down + closing). Projections, not guarantees.
Landlord ↔ Tenant lean methodology
- Overall (STATE)
- 87 Strongly Landlord-Friendly
- State Florida
- 87 Strongly Landlord-Friendly · R+3
- County
- — inherits STATE
- City
- — inherits STATE
ZIP-level market 32822
- Home prices YoY
- -21.1%
- Rents YoY
- -0.7%
- Active inventory
- 372
- Price-to-rent
- 4.2×
Monthly cashflow live
- Estimated rent
- $1,505 high interval (Pro) →
- Mortgage (P&I)
- −$393
- Tax from tax record
- −$197 /mo · $2,361/yr
- Insurance
- −$31
- HOA
- −$379
- Vacancy / Maint / Mgmt
- −$316
- Net cashflow
- $189
Break-even live
UW: 25.0% down · 7.5% · 30yr · 1.5% tax · 5.0% vac · 8.0% maint · 8.0% mgmt
Financing live
Cash to close
- Down payment
- $18,750
- Closing costs
- $2,250
- Reserves months
- —
- Total cash needed
- —
Loan-product check · same deal, 3 products live
Conventional
25% down · 7.5% · 30yr
- Down + closing
- —
- Monthly P&I
- —
- Monthly cashflow
- —
- DSCR
- —
- Eligible?
- —
Personal DTI + credit; lowest rate.
DSCR
20% down · 8.5% · 30yr
- Down + closing
- —
- Monthly P&I
- —
- Monthly cashflow
- —
- DSCR
- —
- Eligible?
- —
No personal income docs; deal must DSCR.
Hard money
10% down · 12.0% · 12mo
- Down + closing
- —
- Monthly P&I
- —
- Monthly cashflow
- —
- DSCR
- —
- Eligible?
- —
Short-term bridge; refi at stabilization.
Rent comps 40 comps
| Address | Beds | Baths | Sqft | Rent | $/sqft | DOM | Units | Dist |
|---|---|---|---|---|---|---|---|---|
| 6020 Village Cir N Orlando, FL | 2.0 | 1.5 | 825 | $1,390 | $1.68 | 23d | 1 | 0.04mi |
| 6032 Village Cir N #6032 Orlando, FL | 2.0 | 2.0 | 1022 | $1,800 | $1.76 | 23d | 1 | 0.06mi |
| 6043 Village Cir #6043 Orlando, FL | 2.0 | 1.5 | 860 | $1,550 | $1.80 | 17d | 1 | 0.07mi |
| 2439 Oak Park Way #217 Orlando, FL | 2.0 | 2.0 | 953 | $1,650 | $1.73 | 2d | 1 | 0.08mi |
| 2365 Oak Park Way #109 Orlando, FL | 2.0 | 2.0 | 953 | $1,350 | $1.42 | 10d | 1 | 0.08mi |
| 6065 Village Cir #6065 Orlando, FL | 2.0 | 1.5 | 860 | $1,425 | $1.66 | 7d | 1 | 0.08mi |
| 6077 Village Cir #6077 Orlando, FL | 2.0 | 2.0 | 1022 | $1,800 | $1.76 | 23d | 1 | 0.08mi |
| 2451 Oak Park Way #120 Orlando, FL | 2.0 | 2.0 | 953 | $1,700 | $1.78 | 4d | 1 | 0.09mi |
| 2683 Oak Park Way #214 Orlando, FL | 2.0 | 2.0 | 950 | $1,700 | $1.79 | 23d | 1 | 0.13mi |
| 6031 Scotchwood Gln Orlando, FL | 2.0 | 2.0 | 846 | $1,625 | $1.92 | 23d | 2 | 0.17mi |
| 2143 Raper Dairy Rd Orlando, FL | 1.0 | 1.0 | 432 | $1,319 | $3.05 | 2d | 8 | 0.17mi |
| 6122 Curry Ford Rd #241 Orlando, FL | 1.0 | 1.0 | 742 | $1,325 | $1.79 | 23d | 1 | 0.22mi |
| 5914 Mausser Dr Orlando, FL | 1.0–4.0 | 1.0–2.5 | 1052 | $1,534 | $1.46 | 1d | 13 | 0.23mi |
| 6118 Curry Ford Rd Orlando, FL | 1.0 | 1.0 | 742 | $1,175 | $1.58 | 23d | 1 | 0.23mi |
| 6110 Curry Ford Rd #117 Orlando, FL | 1.0 | 1.0 | 742 | $1,175 | $1.58 | 23d | 1 | 0.24mi |
| 5762 Folkstone Ln Orlando, FL | 1.0–3.0 | 1.0–2.0 | 1081 | $1,640 | $1.52 | 1d | 17 | 0.24mi |
| 5870 Sundown Cir Orlando, FL | 1.0–2.0 | 1.0–2.0 | 840 | $1,307 | $1.56 | 1d | 25 | 0.24mi |
| 6104 Curry Ford Rd #108 Orlando, FL | 2.0 | 2.0 | 1051 | $1,500 | $1.43 | 7d | 1 | 0.25mi |
| 6104 Curry Ford Rd #207 Orlando, FL | 2.0 | 2.0 | 1051 | $1,600 | $1.52 | 23d | 1 | 0.25mi |
| 2536 Woodgate Blvd #107 Orlando, FL | 2.0 | 2.0 | 930 | $1,650 | $1.77 | 21d | 1 | 0.28mi |
| 2556 Woodgate Blvd #203 Orlando, FL | 1.0 | 1.0 | 680 | $1,350 | $1.99 | 14d | 1 | 0.31mi |
| 2516 Woodgate Blvd #203 Orlando, FL | 1.0 | 1.0 | 680 | $1,245 | $1.83 | 7d | 1 | 0.32mi |
| 2508 Woodgate Blvd #207 Orlando, FL | 2.0 | 2.0 | 930 | $1,600 | $1.72 | 21d | 1 | 0.32mi |
| 1854 Caralee Blvd #3 Orlando, FL | 2.0 | 1.0 | 850 | $1,700 | $2.00 | 23d | 1 | 0.37mi |
| 2568 Woodgate Blvd Orlando, FL | 1.0–2.0 | 1.0–2.0 | 790 | $1,300 | $1.65 | 4d | 1 | 0.37mi |
| 6203 Curry Ford Rd Orlando, FL | 1.0–3.0 | 1.0–2.0 | 1011 | $1,320 | $1.30 | 13d | 1 | 0.38mi |
| 2500 Woodgate Blvd #203 Orlando, FL | 1.0 | 1.0 | 680 | $1,299 | $1.91 | 4d | 1 | 0.40mi |
| 1847 Caralee Blvd #4 Orlando, FL | 2.0 | 1.0 | 850 | $1,650 | $1.94 | 3d | 1 | 0.41mi |
| 3217 Westridge Blvd Orlando, FL | 2.0 | 2.0 | 914 | $1,800 | $1.97 | 14d | 1 | 0.43mi |
| 6254 S Bend Sq #173 Orlando, FL | 2.0 | 2.5 | 1104 | $1,699 | $1.54 | 23d | 1 | 0.43mi |
| 1724 Townhall Ln Orlando, FL | 2.0 | 1.5 | 1018 | $1,595 | $1.57 | 21d | 1 | 0.44mi |
| 3233 Candle Ridge Dr #101 Orlando, FL | 2.0 | 2.0 | 914 | $1,600 | $1.75 | 7d | 1 | 0.45mi |
| 3211 S Semoran Blvd Orlando, FL | 1.0–3.0 | 1.0–2.0 | 880 | $1,099 | $1.25 | 1d | 12 | 0.45mi |
| 3239 Candle Ridge Dr Orlando, FL | 2.0 | 2.0 | 914 | $2,100 | $2.30 | 23d | 1 | 0.46mi |
| 1732 Hidden Creek Blvd #108 Orlando, FL | 2.0 | 2.5 | 1104 | $1,550 | $1.40 | 17d | 1 | 0.53mi |
| 6299 Arlington Ct #212 Orlando, FL | 2.0 | 1.5 | 1032 | $1,680 | $1.63 | 23d | 1 | 0.53mi |
| 1718 Silver Creek Ct #102 Orlando, FL | 2.0 | 1.5 | 1032 | $1,850 | $1.79 | 21d | 1 | 0.54mi |
| 3100 S Semoran Blvd Unit 11 Orlando, FL | 2.0 | 2.0 | 966 | $1,700 | $1.76 | 23d | 1 | 0.56mi |
| 5550 E Michigan St Orlando, FL | 1.0–2.0 | 1.0–2.0 | 913 | $1,295 | $1.42 | 19d | 3 | 0.58mi |
| 5550 E Michigan St Orlando, FL | 1.0–2.0 | 1.0–2.0 | 950 | $1,450 | $1.53 | 7d | 3 | 0.58mi |
HOA detail condo
- Monthly dues
- $379 · $4,548/yr
- Assessments
- None detected in remarks — confirm with the listing agent.
Listing history 13 events
-
2026-06-18status $75,000 Pending 15 DOM
-
2026-06-17days on market $75,000 Active 15 DOM
-
2026-06-16days on market $75,000 Active 14 DOM
-
2026-06-15days on market $75,000 Active 13 DOM
-
2026-06-13days on market $75,000 Active 11 DOM
-
2026-06-13days on market $75,000 Active 10 DOM
-
2026-06-10remarks 375-char remark
-
2026-06-09days on market $75,000 Active 7 DOM
-
2026-06-08days on market $75,000 Active 6 DOM
-
2026-06-07days on market $75,000 Active 5 DOM
-
2026-06-04days on market $75,000 Active 2 DOM
-
2026-06-03remarks 308-char remark
-
2026-06-03$75,000 Active 1 DOM
ⓘ Source: listings_history table (triggers on properties + properties_extension) + one-shot
backfill from property_details.listing_events for pre-trigger history.
Tax reassessment forecast FL · Resets to sale price
- Current annual tax
- $2,361 · $197/mo
- Projected year-2 tax
- $2,361 · $197/mo
- Expected delta
- $0/yr ($0/mo · 0.0%)
ⓘ Screening estimate from a state-policy table — verify with the county assessor before closing.
Climate risk First Street
- Flood 1/10 Low FEMA zone X (unshaded) · 0% chance over 30 yrs
- Wildfire 1/10 Low
- Heat 9/10 Extreme 7 d/yr ≥108°F today · 22 d/yr by 30 yrs out
- Wind 9/10 Extreme 99% chance of damaging wind over 30 yrs
- Air quality 2/10 Low 1 unhealthy d/yr today · 1 by 30 yrs out
Nearby sold comps map
Loading sold comps map…
Walkable amenities ~0.75 mi
Loading nearby amenities…
Taxation est. · year 1
- Rental income
- $18,062
- − Mortgage interest
- −$4,201
- − Property taxes
- −$2,361
- − Insurance
- −$375
- − Repairs & maintenance
- −$1,445
- − Management
- −$1,445
- − HOA
- −$4,548
- − Depreciation
- −$2,182
- Taxable income
- $1,506
- Est. tax owed @ 24.0%
- −$361
- After-tax cash flow
- $1,904/yr
For passive investors: Depreciation is non-cash, so a rental often shows a tax loss while cash-flowing — sheltering income. Rental losses are passive: they offset passive income freely, and up to $25,000/yr can offset ordinary (W-2) income if you actively participate and your MAGI is under $100k (phasing out to $0 by $150k); unused losses carry forward. On sale, claimed depreciation is recaptured at up to 25%, and gains may owe capital-gains tax (a 1031 exchange can defer both). Figures are a year-1 estimate at your 24.0% rate — not tax advice; consult a CPA.
Schools (NCES district)
- District
- Orange
- NCES district ID
- 1201440
- Math proficiency
- 46% ▼ -9.00%
- Reading proficiency
- 51% ▼ -2.00%
- Median HH income
- $49,350
- Composite
- 41.47/100
- National rank
- #3461
- State rank
- #43 of 73 in FL
Livability — Orlando
- Score
- 86/100
- State rank
- #12
- US rank
- #360
Category grades
Schools grade is shown separately in the Schools card above.
Census & demographics
- Census place
- Orlando, FL
- County
- Orange County · 1,471,359 people
- City population
- 964,969
- Metro
- Orlando-Kissimmee-Sanford, FL
- Population (ZIP)
- 67,081
- Household income
- $56,540
- Rent vs Own
- Severe rent burden
- 4246.0
Population outlook (Orange County) Hauer SSP2
- Today (2025)
- 1,618,226 people
- By 2030
- 1,787,404 · +10.5%
- By 2040
- 2,125,621 · +31.4%
- By 2050
- 2,454,016 · +51.6%
- By 2075
- 3,173,711 · +96.1%
- By 2100
- 3,607,781 · +122.9%
Race, ethnicity, and origin ACS 2023
- Neighborhood character
- Predominantly Hispanic (68%)
- Race & ethnicity
- Hispanic / Latino 68% Two or more races 36% White 17% Black 10% Asian 2%
- Hispanic origin (detail)
- Mexican 2% Puerto Rican 38% Cuban 5% Dominican 5%
- Common ancestry
- Lithuanian 1% Romanian 1% Slovak 1%
- Foreign-born
- 27% · Canada, Jamaica, China
- Languages at home
- 36% English-only · Spanish 60% French/Haitian/Cajun 1% Arabic 1%
Political lean MEDSL · Orange
- 2024 margin
- D (+13.6) · D 56.1% · R 42.5% · Other 1.3%
- 2008→2024 swing
- -5.0pp toward R · 2008: 18.6pp · 2024: 13.6pp
- All cycles
- 2024: D+13.6 2020: D+23.1 2016: D+24.6 2012: D+18.2 2008: D+18.6
Not yet ingested
- Civics
- —
Market trends
- HPI YoY
- ▼ -95.17%
- Current HPI
- 355.5775
- Rent YoY
- ▼ -0.68%
- Metro
- Orlando-Kissimmee-Sanford, FL
- State GDP YoY
- ▲ 3.28%
- F500 in state
- 36
Industry mix (Fortune 500 HQ in FL)
| Industry | F500 HQs | Revenue |
|---|---|---|
| Industrial Technology | 2 | $29B |
|
||
| Insurance | 2 | $17B |
|
||
| Retail | 1 | $60B |
|
||
| Technology Distribution | 1 | $58B |
|
||
| Homebuilding | 1 | $35B |
|
||
| Technology Manufacturing | 1 | $35B |
|
||
Price history
+149.2% since first listed12 events — show timeline
- 2026-06-02 Listed $75,000 Stellar MLS as Distributed by MLS Grid
- 2024-02-27 Sold (Public Records) $170,000 Public Records
- 2024-02-22 Sold (MLS) $170,000 Stellar MLS as Distributed by MLS Grid
- 2024-01-08 Pending — Stellar MLS as Distributed by MLS Grid
- 2023-12-22 Listed $170,000 Stellar MLS as Distributed by MLS Grid
- 2021-03-04 Sold (Public Records) $125,000 Public Records
- 2020-12-02 Listing Removed — Stellar MLS as Distributed by MLS Grid
- 2020-11-25 Listed $120,000 Stellar MLS as Distributed by MLS Grid
- 2015-06-29 Sold (Public Records) $52,500 Public Records
- 1999-03-16 Sold (Public Records) $36,000 Public Records
- 1991-12-30 Sold (Public Records) $34,900 Public Records
- 1982-04-01 Sold (Public Records) $30,100 Public Records
Property tax history
+25.6%/yrLatest (2025): $2,361 · +13.8% YoY. Source: county tax records.
Cash-flow waterfall
monthlySold comps — $/sqft
last 12 mo · ≤1 miLoading sold comps…