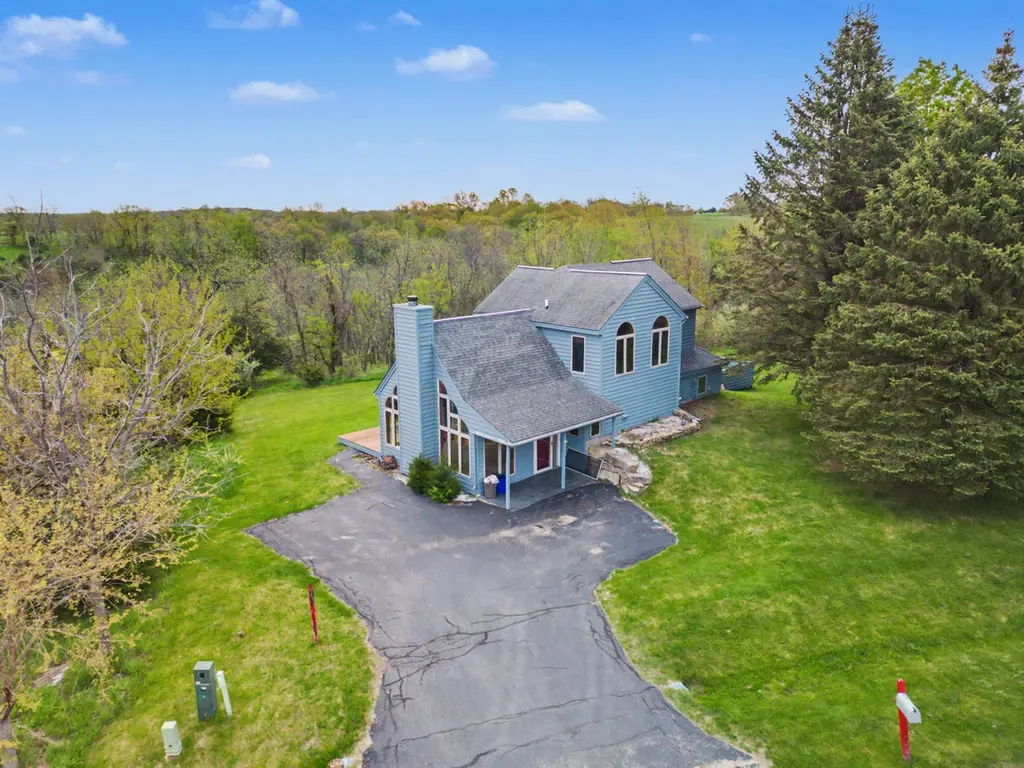
5 Maltby Ct · The Galena Territory, IL
Flood risk 1/10 · Minimal
- FEMA flood zone
- X (unshaded)
- Chance of flooding over 30 yrs
- 0.0%
- Est. flood insurance / yr
- $507 – $1,088
Fire risk 2/10 · Minimal
- Est. fire insurance / yr
- $804 – $1,492
Heat risk 2/10 · Minimal
- Hot days now (above 100°F)
- 7 days/yr
- Hot days in 30 yrs
- 15 days/yr
Wind risk 2/10 · Minimal
- Chance of severe wind over 30 yrs
- —
Air-quality risk 2/10 · Minimal
- Unhealthy air days now
- 2 days/yr
- Unhealthy air days in 30 yrs
- 2 days/yr
Risk factors via First Street. Map © Google.
Why this score? — see what drove the B grade
The composite is a weighted blend of 9 inputs, each scored 0–100. Each bar is that input's sub-score; the figure is the points it added to the 100-point composite (weight × sub-score).
- Cash flow +27.5/30.0
- ARV discount +15.0/15.0
- 1% rule +10.0/10.0
- DSCR +9.6/10.0
- Livability +3.6/5.0
- Schools +3.0/10.0
- Rent growth +2.5/5.0
- Condition / age +2.5/5.0
- Appreciation +0.0/10.0
$175,000
🖨 Deal sheet 📄 Offer letter ✓ Due diligence
Listing remarks
Calling all investors, contractors, or anyone looking to build some "sweat equity"! Set atop a hill in the scenic Shenandoah Valley, this property offers the kind of setting that’s getting harder to find; views and endless potential! This 3-bedroom, 2-bath home is ready for a new owner to bring it back to life and make it their own. The home features a spacious layout with a Great Room highlighted by soaring ceilings, a fireplace, and large windows designed to capture the surrounding countryside and allow for lots of natural light. The open-concept kitchen and dining area provide a solid footprint for future updates and modern touches. A main-floor primary suite with walk in
Key facts
- Large windows
- Open-concept kitchen
- Soaring ceilings
Tags
Property features AI
Finance
- HOA & community: Homeowners association with an annual fee of $1,404 (about $117/month)
Exterior
- Parking: Asphalt parking
- Utilities: Public water; Septic sewer
- Home design: Single-family residence (house); 2 stories; Residential property
- Exterior features: Shingle roof; Asphalt parking
Interior
- Kitchen: Electric cooktop; Dishwasher; Refrigerator
- Bathrooms: 2 full bathrooms; 1 half bathroom; 1 main-level bathroom
- Heating & cooling: Forced air heating with propane; Central air conditioning
- Interior features: Walk-in closets; Wood-burning fireplace (1)
- Laundry & utility: Washer; Dryer; Electric water heater
Neighborhood map
What this means for you Summary
Snapshot
- This is a 3-bed/2.5-bath other listed at $175k.
Deal economics
- At list price, monthly cash flow is $515 ($6k/yr) — positive.
- The deal already cash-flows at list — no discount required.
- Meets the 1% rule at list price ($3k rent vs $175k).
- Cap rate 9.8% vs local median 3.3% in The Galena Territory — top-decile yield for the area; either an underpriced asset or a hidden risk that comps aren't pricing in. Stress-test before assuming the spread holds.
Location & tenants
- Location reads 72/100 on livability (#313 in IL) — a middle-class / working-renter tenant base. Strengths: crime A+, employment A+, housing A+; Watch: health & safety C-, amenities F, commute F.
- River Ridge CUSD 210 (rural): math 32% / reading 36% proficiency, ranked #205 of 620 in IL (top 33%) — families likely to look elsewhere, expect single-tenant / working-renter base with shorter leases.
- Zoned schools: River Ridge Elementary School (math 37% / reading 47%, grade F, #336 of 2,056 statewide, top 18%, 220 students, 0% FRL); River Ridge Middle School (math 22% / reading 27%, grade F, #332 of 665 statewide, top 55%, 105 students, 0% FRL); River Ridge High School (math 44% / reading 34%, grade F, #88 of 693 statewide, top 14%, 135 students, 0% FRL) — zoned schools average 0% FRL vs 34% district-wide (34 pts lower); this property's tenant base skews higher-income than the district average.
- Market conditions: 156 active listings in the ZIP; 1 comparable units currently listed for rent nearby; 58 units permitted in Jo Daviess County in 2024 (0 in 5+ unit buildings).
Forward outlook
- Local home prices are declining (-3.0%/yr); year-one equity from $1k of loan paydown is wiped out by about $5k of value loss. Plan a longer hold.
- Jo Daviess County population projected at -25% by 2050 — secular population decline; favor cash flow + early exit over multi-decade hold.
- At projected returns (-3.0% appreciation + 3.0% rent growth), your $49k cash investment doubles in ~9 years — after that, you're playing with house money.
Negotiation context
- Only 13 days on market — expect competitive offers; lowballing is unlikely to land.
- 4 sale attempts since 15y ago with the ask held roughly flat each time — persistent listings suggest the price (not the market) is what's stuck; bring a comps-based counter.
Risks & watch-outs
- Watch-outs: property tax is 3.2% of price.
Questions for the listing agent
- Property tax is high relative to price — has the assessment been appealed recently, and will the sale trigger a re-assessment?
- What does the HOA fee cover, when was the last increase, and are there any pending special assessments or reserve-fund shortfalls?
- Is there a deadline driving the sale (1031 exchange, divorce, estate, relocation)? That informs how much negotiation room exists.
- Schools are D-rated, which usually means shorter tenancies and higher turnover. Who's the typical renter profile here, and what's been the actual vacancy rate?
- What's the average days-on-market for RENTAL listings here right now (not sales)? A rising rental-DOM trend means longer vacancies and softer asking-rent achievability than the comps imply.
- What's the recent tenant-quality profile in this submarket — average credit score on applications, eviction rate, late-payment / NSF rate, and stable-employment percentage? A property-management company in the area should have these aggregated.
- How much new for-sale + rental construction is in the pipeline within 1–3 miles? Heavy new supply typically softens prices + rents 12–24 months out; constrained supply supports both.
Investment metrics
- 1% rule
- 1.51% ✓
- Cap rate
- 9.82%
- Cash-on-cash
- 12.60%
- DSCR
- 1.56
- GRM
- 5.5
CMA / ARV
- ARV (median comp)
- $343,616
- List price
- $175,000
- Delta
- -49.07%
- Verdict
- UNDERPRICED
- Comps
- 20 within 1.0 mi
Projected returns pro-forma
-3.0% appreciation · 3.0% rent growth · sell at horizon
- IRR
- 2.5%
- Equity multiple
- 1.10×
- Total profit
- $4,679
- Equity at exit
- $26,093
- IRR
- 12.2%
- Equity multiple
- 1.97×
- Total profit
- $47,355
- Equity at exit
- $15,131
Cash invested: $49,000 (down + closing). Projections, not guarantees.
Landlord ↔ Tenant lean methodology
- Overall (STATE)
- 43 Moderately Tenant-Leaning
- State Illinois
- 43 Moderately Tenant-Leaning · D+7
- County
- — inherits STATE
- City
- — inherits STATE
ZIP-level market 61036
- Active inventory
- 156
- Price-to-rent
- 5.5×
Monthly cashflow live
- Estimated rent
- $2,650 medium interval (Pro) →
- Mortgage (P&I)
- −$918
- Tax from tax record
- −$471 /mo · $5,656/yr
- Insurance
- −$73
- HOA
- −$117
- Vacancy / Maint / Mgmt
- −$556
- Net cashflow
- $515
Break-even live
UW: 25.0% down · 7.5% · 30yr · 1.5% tax · 5.0% vac · 8.0% maint · 8.0% mgmt
Financing live
Cash to close
- Down payment
- $43,750
- Closing costs
- $5,250
- Reserves months
- —
- Total cash needed
- —
Loan-product check · same deal, 3 products live
Conventional
25% down · 7.5% · 30yr
- Down + closing
- —
- Monthly P&I
- —
- Monthly cashflow
- —
- DSCR
- —
- Eligible?
- —
Personal DTI + credit; lowest rate.
DSCR
20% down · 8.5% · 30yr
- Down + closing
- —
- Monthly P&I
- —
- Monthly cashflow
- —
- DSCR
- —
- Eligible?
- —
No personal income docs; deal must DSCR.
Hard money
10% down · 12.0% · 12mo
- Down + closing
- —
- Monthly P&I
- —
- Monthly cashflow
- —
- DSCR
- —
- Eligible?
- —
Short-term bridge; refi at stabilization.
Rent comps 1 comps
| Address | Beds | Baths | Sqft | Rent | $/sqft | DOM | Units | Dist |
|---|---|---|---|---|---|---|---|---|
| 125 Cogan Dr Galena, IL | 4.0 | 3.0 | 2550 | $2,650 | $1.04 | 43d | 1 | 0.75mi |
HOA detail
- Monthly dues
- $117 · $1,404/yr
Listing history 13 events
-
2026-06-07status $175,000 Pending 13 DOM
-
2026-06-05days on market $175,000 Active 13 DOM
-
2026-06-04days on market $175,000 Active 11 DOM
-
2026-06-02days on market $175,000 Active 10 DOM
-
2026-06-01days on market $175,000 Active 9 DOM
-
2026-05-31days on market $175,000 Active 8 DOM
-
2026-05-31days on market $175,000 Active 7 DOM
-
2026-05-10status Pending 1193-char remark
-
2026-05-07$175,000 Active 1193-char remark
-
2014-01-08historical
-
2013-10-30
-
2012-05-09historical
-
2011-12-08
ⓘ Source: listings_history table (triggers on properties + properties_extension) + one-shot
backfill from property_details.listing_events for pre-trigger history.
Tax reassessment forecast IL · Partial reset (capped growth)
- Current annual tax
- $5,656 · $471/mo
- Projected year-2 tax
- $5,656 · $471/mo
- Expected delta
- $0/yr ($0/mo · 0.0%)
ⓘ Screening estimate from a state-policy table — verify with the county assessor before closing.
Climate risk First Street
- Flood 1/10 Low FEMA zone X (unshaded) · 0% chance over 30 yrs
- Wildfire 2/10 Low
- Heat 2/10 Low 7 d/yr ≥100°F today · 15 d/yr by 30 yrs out
- Wind 2/10 Low
- Air quality 2/10 Low 2 unhealthy d/yr today · 2 by 30 yrs out
Nearby sold comps map
Loading sold comps map…
Walkable amenities ~0.75 mi
Loading nearby amenities…
Taxation est. · year 1
- Rental income
- $31,800
- − Mortgage interest
- −$9,803
- − Property taxes
- −$5,656
- − Insurance
- −$875
- − Repairs & maintenance
- −$2,544
- − Management
- −$2,544
- − HOA
- −$1,404
- − Depreciation
- −$5,091
- Taxable income
- $3,883
- Est. tax owed @ 24.0%
- −$932
- After-tax cash flow
- $5,242/yr
For passive investors: Depreciation is non-cash, so a rental often shows a tax loss while cash-flowing — sheltering income. Rental losses are passive: they offset passive income freely, and up to $25,000/yr can offset ordinary (W-2) income if you actively participate and your MAGI is under $100k (phasing out to $0 by $150k); unused losses carry forward. On sale, claimed depreciation is recaptured at up to 25%, and gains may owe capital-gains tax (a 1031 exchange can defer both). Figures are a year-1 estimate at your 24.0% rate — not tax advice; consult a CPA.
Schools (NCES district)
- District
- River Ridge CUSD 210
- NCES district ID
- 1700001
- Math proficiency
- 32% ▼ -10.00%
- Reading proficiency
- 36% ▼ -9.00%
- Median HH income
- $50,977
- Composite
- 29.6/100
- National rank
- #6477
- State rank
- #205 of 620 in IL
Livability — The Galena Territory
- Score
- 72/100
- State rank
- #313
- US rank
- #6203
Category grades
Schools grade is shown separately in the Schools card above.
Census & demographics
- Census place
- The Galena Territory, IL
- Population (ZIP)
- 7,014
Population outlook (Jo Daviess County) Hauer SSP2
- Today (2025)
- 20,420 people
- By 2030
- 19,405 · -5.0%
- By 2040
- 17,244 · -15.6%
- By 2050
- 15,357 · -24.8%
- By 2075
- 11,760 · -42.4%
- By 2100
- 8,355 · -59.1%
Race, ethnicity, and origin ACS 2023
- Neighborhood character
- Predominantly White (93%)
- Race & ethnicity
- White 93% Hispanic / Latino 4% Two or more races 3%
- Common ancestry
- Romanian 7% Portuguese 3% Lithuanian 2%
- Foreign-born
- 2% · Canada, Vietnam
- Languages at home
- 97% English-only · Spanish 2% Other Indo-European 1%
Political lean MEDSL · Jo Daviess
- 2024 margin
- R (+16.8) · D 40.8% · R 57.6% · Other 1.6%
- 2008→2024 swing
- -27.3pp toward R · 2008: 10.5pp · 2024: -16.8pp
- All cycles
- 2024: R+16.8 2020: R+16.5 2016: R+14.9 2012: D+1.1 2008: D+10.5
Not yet ingested
- Civics
- —
Market trends
- HPI YoY
- ▼ -85.06%
- Current HPI
- 156.4718
- Rent YoY
- —
- Metro
- —
- State GDP YoY
- ▲ 1.59%
- F500 in state
- 60
Industry mix (Fortune 500 HQ in IL)
| Industry | F500 HQs | Revenue |
|---|---|---|
| Insurance | 4 | $201B |
|
||
| Consumer Goods | 4 | $87B |
|
||
| Industrial Machinery | 3 | $64B |
|
||
| Healthcare | 2 | $55B |
|
||
| Retail / Pharmacy | 1 | $148B |
|
||
| Agriculture / Food | 1 | $86B |
|
||
Price history
8 events — show timeline
- 2026-06-05 Pending — NWIAR
- 2026-05-26 Relisted — NWIAR
- 2026-05-10 Pending — NWIAR
- 2026-05-07 Listed $175,000 NWIAR
- 2014-01-08 Listing Removed — MRED as Distributed by MLS Grid
- 2013-10-30 Listed — MRED as Distributed by MLS Grid
- 2012-05-09 Listing Removed — MRED as Distributed by MLS Grid
- 2011-12-08 Listed — MRED as Distributed by MLS Grid
Property tax history
+4.5%/yrLatest (2025): $5,656 · +21.6% YoY. Source: county tax records.
Cash-flow waterfall
monthlySold comps — $/sqft
last 12 mo · ≤1 miLoading sold comps…