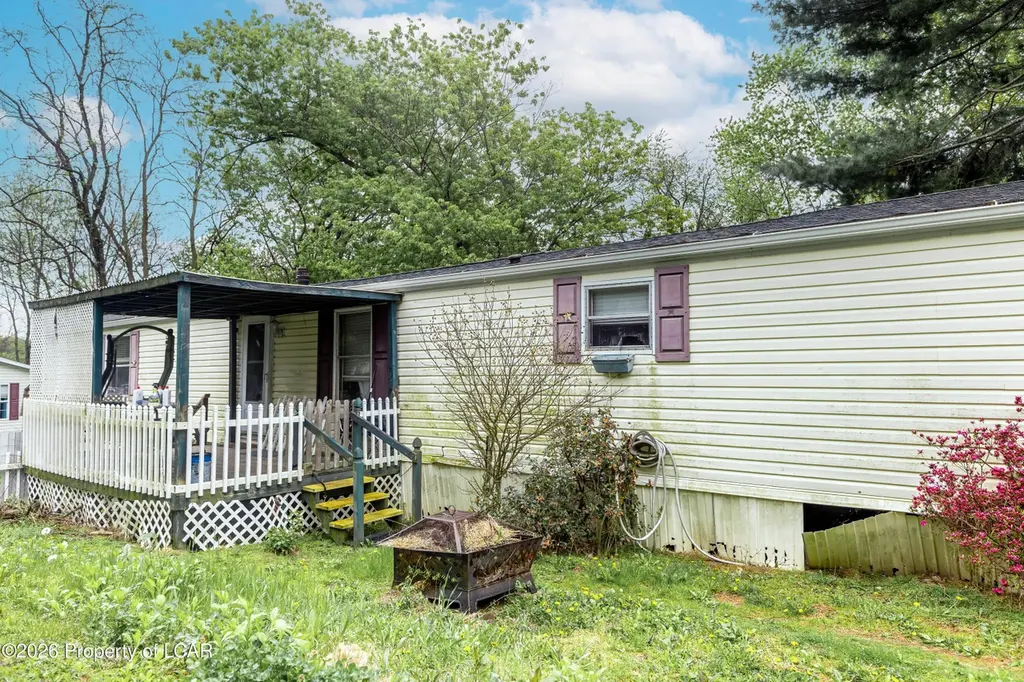
454 1/2 Carver St · Larksville, PA
Flood risk 1/10 · Minimal
- FEMA flood zone
- X (unshaded)
- Chance of flooding over 30 yrs
- 0.0%
- Est. flood insurance / yr
- $507 – $1,088
Fire risk 3/10 · Minor
- Est. fire insurance / yr
- $511 – $949
Heat risk 3/10 · Minor
- Hot days now (above 97°F)
- 7 days/yr
- Hot days in 30 yrs
- 16 days/yr
Wind risk 3/10 · Minor
- Chance of severe wind over 30 yrs
- 5.0%
Air-quality risk 3/10 · Minor
- Unhealthy air days now
- 2 days/yr
- Unhealthy air days in 30 yrs
- 4 days/yr
Risk factors via First Street. Map © Google.
Why this score? — see what drove the B grade
The composite is a weighted blend of 9 inputs, each scored 0–100. Each bar is that input's sub-score; the figure is the points it added to the 100-point composite (weight × sub-score).
- Cash flow +30.0/30.0
- ARV discount +10.1/15.0
- 1% rule +10.0/10.0
- DSCR +10.0/10.0
- Livability +3.9/5.0
- Rent growth +2.5/5.0
- Schools +2.5/10.0
- Condition / age +2.2/5.0
- Appreciation +0.0/10.0
$39,999
🖨 Deal sheet (PDF) 📄 Offer letter ✓ Due diligence
Listing remarks
Come check out this 3-bedroom, 2-bath mobile home located on a leased lot just outside the main section of Midtown Village Mobile Home Park--offering extra privacy while still being close to community amenities. This home features a private driveway for convenient off-street parking and easy access. The primary bedroom includes its own full bathroom, adding comfort and functionality.
Key facts
- Built 1993
- Listed 44 days
Property features AI
Finance
- HOA & community: Homeowners association with a $455 monthly fee
Exterior
- Utilities: Public water; Public sewer
- Home design: Manufactured home; One level
- Construction: Vinyl siding
- Exterior features: Leased lot; Residential zoning
Interior
- Kitchen: Eat-in kitchen
- Bedrooms: Total of 5 rooms (bedroom count not specified separately)
- Bathrooms: 2 full bathrooms
- Heating & cooling: Natural gas heating with forced air; Ceiling fan(s) for cooling
- Interior features: Eat-in kitchen; Electric water heater
Neighborhood map
What this means for you Summary
Snapshot
- This is a 3-bed/2.0-bath manufactured listed at $40k. Condition is rated fair.
Deal economics
- At list price, monthly cash flow is $304 ($4k/yr) — positive.
- The deal already cash-flows at list — no discount required.
- Meets the 1% rule at list price ($1k rent vs $40k).
- Recommended offer: $39k (3.0% below list) — sets the bar for market timing.
Location & tenants
- Location reads 77/100 on livability (#354 in PA, #3,113 nationally) — a middle-class / working-renter tenant base. Strengths: crime A+, cost of living A+, health & safety A+; Watch: schools F, amenities F, commute F.
- Wyoming Valley West SD (suburban): math 18% / reading 42% proficiency, ranked #445 of 539 in PA (top 83%) — families likely to look elsewhere, expect single-tenant / working-renter base with shorter leases.
- Market conditions: 61 active listings in the ZIP; 14 comparable units currently listed for rent nearby; rentals at typical pace (median 22d on market — plan ~3-4 weeks tenant-placement turnaround); 43% of comp listings sitting > 30 days — soft ceiling on asking rent; 349 units permitted in Luzerne County in 2024 (16 in 5+ unit buildings).
Forward outlook
- Local home prices are declining (-3.0%/yr); year-one equity from $276 of loan paydown is wiped out by about $1k of value loss. Plan a longer hold.
- Luzerne County population projected at +4% by 2050 — modest demand growth; plan on rents tracking national, not racing it.
- At projected returns (-3.0% appreciation + 3.0% rent growth), your $11k cash investment doubles in ~4 years — after that, you're playing with house money.
Negotiation context
- It's been on market 44 days — a 3% lower offer ($39k) is reasonable based on typical stale-listing flexibility.
Risks & watch-outs
- Watch-outs: HOA is 35% of rent.
Questions for the listing agent
- It's been on market 44 days. Have you received any prior offers? Is the seller open to a 3% concession, seller financing, or rate buy-down credit?
- Have any recent inspections been done? Can we get a copy of the seller's disclosures and any deferred-maintenance estimates?
- What does the HOA fee cover, when was the last increase, and are there any pending special assessments or reserve-fund shortfalls?
- Is there a deadline driving the sale (1031 exchange, divorce, estate, relocation)? That informs how much negotiation room exists.
- Schools are F-rated, which usually means shorter tenancies and higher turnover. Who's the typical renter profile here, and what's been the actual vacancy rate?
- What's the average days-on-market for RENTAL listings here right now (not sales)? A rising rental-DOM trend means longer vacancies and softer asking-rent achievability than the comps imply.
- What's the recent tenant-quality profile in this submarket — average credit score on applications, eviction rate, late-payment / NSF rate, and stable-employment percentage? A property-management company in the area should have these aggregated.
- How much new for-sale + rental construction is in the pipeline within 1–3 miles? Heavy new supply typically softens prices + rents 12–24 months out; constrained supply supports both.
Investment metrics
- 1% rule
- 3.28% ✓
- Cap rate
- 15.42%
- Cash-on-cash
- 32.60%
- DSCR
- 2.45
- GRM
- 2.5
CMA / ARV
- ARV (median comp)
- $42,500
- List price
- $39,999
- Delta
- -5.88%
- Verdict
- FAIR
- Comps
- 3 within 1.0 mi
Show comp detail 4 sales within ~0.75 mi
| Address | Dist | Beds/Ba | Sqft | Sold | Price | $/sf | Match |
|---|---|---|---|---|---|---|---|
| 17 Midtown Village Vlg | 0.12mi | 3/2.0 | 956 (-10%) | 2mo | $42,500 | $44 | 76 |
| 13 Midtown St | 0.06mi | 2/1.0 (-1) | 966 (-9%) | 10mo | $37,000 | $38 | 65 |
| 421 Washington Ave | 0.14mi | 3/1.0 | 924 (-13%) | 5mo | $50,000 | $54 | 63 |
| 478 Carver St | 0.04mi | 2/1.0 (-1) | 924 (-13%) | 21mo | $39,900 | $43 | 50 |
Match score weights: distance 35% · size 25% · config 20% · recency 20%. Top-matched comps best support the ARV.
Projected returns pro-forma
-3.0% appreciation · 3.0% rent growth · sell at horizon
- IRR
- 28.1%
- Equity multiple
- 2.18×
- Total profit
- $13,194
- Equity at exit
- $5,964
- IRR
- 35.8%
- Equity multiple
- 4.36×
- Total profit
- $37,656
- Equity at exit
- $3,458
Cash invested: $11,200 (down + closing). Projections, not guarantees.
Landlord ↔ Tenant lean methodology
- Overall (STATE)
- 62 Landlord-Friendly
- State Pennsylvania
- 62 Landlord-Friendly · EVEN
- County
- — inherits STATE
- City
- — inherits STATE
ZIP-level market 18651
- Home prices YoY
- -11.5%
- Active inventory
- 61
- Price-to-rent
- 2.5×
Monthly cashflow live
- Estimated rent
- $1,311 high interval (Pro) →
- Mortgage (P&I)
- −$210
- Tax est. 1.5%
- −$50 /mo · $600/yr
- Insurance
- −$17
- HOA
- −$455
- Vacancy / Maint / Mgmt
- −$275
- Net cashflow
- $304
Break-even live
Sensitivity live
| Price | -10% $332 | -5% $318 | +0% $304 | +5% $290 | +10% $277 |
|---|---|---|---|---|---|
| Rent | -10% $201 | -5% $252 | +0% $304 | +5% $356 | +10% $408 |
| Rate | -1.0pp $324 | -0.5pp $314 | base $304 | +0.5pp $294 | +1.0pp $283 |
UW: 25.0% down · 7.5% · 30yr · 1.5% tax · 5.0% vac · 8.0% maint · 8.0% mgmt
Financing live
Cash to close
- Down payment
- $10,000
- Closing costs
- $1,200
- Reserves months
- —
- Total cash needed
- —
Loan-product check · same deal, 3 products live
Conventional
25% down · 7.5% · 30yr
- Down + closing
- —
- Monthly P&I
- —
- Monthly cashflow
- —
- DSCR
- —
- Eligible?
- —
Personal DTI + credit; lowest rate.
DSCR
20% down · 8.5% · 30yr
- Down + closing
- —
- Monthly P&I
- —
- Monthly cashflow
- —
- DSCR
- —
- Eligible?
- —
No personal income docs; deal must DSCR.
Hard money
10% down · 12.0% · 12mo
- Down + closing
- —
- Monthly P&I
- —
- Monthly cashflow
- —
- DSCR
- —
- Eligible?
- —
Short-term bridge; refi at stabilization.
Rent comps 14 comps
| Address | Beds | Baths | Sqft | Rent | $/sqft | DOM | Units | Dist |
|---|---|---|---|---|---|---|---|---|
| 241 Gould St Plymouth, PA | 2.0 | 1.0 | 985 | $1,150 | $1.17 | 21d | 1 | 0.34mi |
| 48 E Shawnee Ave Plymouth, PA | 3.0 | 1.0 | 1500 | $1,250 | $0.83 | 14d | 1 | 0.52mi |
| 210-212 Center Ave Plymouth, PA | 3.0 | 1.0 | 1300 | $1,200 | $0.92 | 44d | 1 | 0.54mi |
| 229 Nesbitt St Larksville, PA | 3.0 | 1.0 | 1000 | $1,250 | $1.25 | 44d | 1 | 0.71mi |
| 206 Nesbitt St Larksville, PA | 3.0 | 1.0 | 980 | $1,325 | $1.35 | 44d | 1 | 0.72mi |
| 100 Nesbitt St Unit 2 Larksville, PA | 2.0 | 1.0 | 1200 | $1,295 | $1.08 | 44d | 1 | 0.72mi |
| 338 W Shawnee Ave Plymouth, PA | 2.0 | 1.5 | 945 | $1,550 | $1.64 | 14d | 1 | 0.90mi |
| 202 S Nesbitt St Unit 206 B Larksville, PA | 3.0 | 1.0 | 1100 | $1,500 | $1.36 | 44d | 1 | 0.90mi |
| 463 2nd St Plymouth, PA | 3.0 | 1.0 | 1250 | $1,500 | $1.20 | 44d | 1 | 1.02mi |
| 134 Blair St Plymouth, PA | 3.0 | 1.0 | 1300 | $1,300 | $1.00 | 21d | 1 | 1.18mi |
| 546 W Main St Plymouth, PA | 2.0 | 1.0 | 750 | $1,150 | $1.53 | 21d | 1 | 1.24mi |
| 72 Franklin St Plymouth, PA | 2.0 | 1.0 | 750 | $1,175 | $1.57 | 14d | 1 | 1.26mi |
| 617 Fellows Ave Wilkes-Barre, PA | 4.0 | 1.0 | 1100 | $1,395 | $1.27 | 14d | 1 | 1.26mi |
| 29 Franklin St Plymouth, PA | 3.0 | 1.0 | 1426 | $1,800 | $1.26 | 14d | 1 | 1.29mi |
HOA detail
- Monthly dues
- $455 · $5,460/yr
Listing history 19 events
-
2026-06-18days on market $39,999 Active 44 DOM
-
2026-06-17days on market $39,999 Active 43 DOM
-
2026-06-16days on market $39,999 Active 42 DOM
-
2026-06-15days on market $39,999 Active 41 DOM
-
2026-06-14days on market $39,999 Active 39 DOM
-
2026-06-13days on market $39,999 Active 38 DOM
-
2026-06-10days on market $39,999 Active 36 DOM
-
2026-06-09days on market $39,999 Active 35 DOM
-
2026-06-09price $39,999 Active 34 DOM
-
2026-06-08days on market $49,999 Active 34 DOM
-
2026-06-07days on market $49,999 Active 33 DOM
-
2026-06-05days on market $49,999 Active 30 DOM
-
2026-06-02days on market $49,999 Active 28 DOM
-
2026-06-01days on market $49,999 Active 27 DOM
-
2026-05-31days on market $49,999 Active 26 DOM
-
2026-05-30days on market $49,999 Active 25 DOM
-
2026-05-07price $49,999 386-char remark
-
2026-05-05$54,999 Active 386-char remark
-
2026-03-30price $54,999
ⓘ Source: listings_history table (triggers on properties + properties_extension) + one-shot
backfill from property_details.listing_events for pre-trigger history.
Climate risk First Street
- Flood 1/10 Low FEMA zone X (unshaded) · 0% chance over 30 yrs
- Wildfire 3/10 Moderate
- Heat 3/10 Moderate 7 d/yr ≥97°F today · 16 d/yr by 30 yrs out
- Wind 3/10 Moderate 5% chance of damaging wind over 30 yrs
- Air quality 3/10 Moderate 2 unhealthy d/yr today · 4 by 30 yrs out
Nearby sold comps map
Loading sold comps map…
Walkable amenities ~0.75 mi
Loading nearby amenities…
Taxation est. · year 1
- Rental income
- $15,731
- − Mortgage interest
- −$2,241
- − Property taxes
- −$600
- − Insurance
- −$200
- − Repairs & maintenance
- −$1,259
- − Management
- −$1,259
- − HOA
- −$5,460
- − Depreciation
- −$1,164
- Taxable income
- $3,550
- Est. tax owed @ 24.0%
- −$852
- After-tax cash flow
- $2,799/yr
For passive investors: Depreciation is non-cash, so a rental often shows a tax loss while cash-flowing — sheltering income. Rental losses are passive: they offset passive income freely, and up to $25,000/yr can offset ordinary (W-2) income if you actively participate and your MAGI is under $100k (phasing out to $0 by $150k); unused losses carry forward. On sale, claimed depreciation is recaptured at up to 25%, and gains may owe capital-gains tax (a 1031 exchange can defer both). Figures are a year-1 estimate at your 24.0% rate — not tax advice; consult a CPA.
Condition & rehab AI · 12 photos
This mobile home requires moderate renovations to improve its exterior and interior condition, enhancing its resale and rental value.
Repairs flagged
- Major exterior siding — Severe weathering and peeling
- Major interior paint — Worn and outdated
- Minor kitchen cabinets — Basic and dated design
Value-add opportunities
- Both Exterior siding replacement — Enhances curb appeal and value
- Both Interior paint refresh — Updates the look and feel
- Both Kitchen updates — Modernizes the space and increases functionality
Renovation cost estimate screening
| Repair item | Severity | Est. cost |
|---|---|---|
| exterior siding · Severe weathering and peeling | Major | $15,000–50,000 |
| interior paint · Worn and outdated | Major | $15,000–50,000 |
| kitchen cabinets · Basic and dated design | Minor | $500–3,000 |
| Total estimated repair cost · 3 items | $30,500–103,000 |
Value-add ROI direction
- Both Exterior siding replacement — Enhances curb appeal and value ↑
- Both Interior paint refresh — Updates the look and feel ↑
- Both Kitchen updates — Modernizes the space and increases functionality ↑
ⓘ Cost ranges are severity-bucket heuristics (US national rule-of-thumb). Get contractor quotes + a written scope before underwriting a rehab budget.
Schools (NCES district)
- District
- Wyoming Valley West SD
- NCES district ID
- 4225950
- Math proficiency
- 18% ▼ -11.00%
- Reading proficiency
- 42% ▼ -12.00%
- Median HH income
- $42,437
- Composite
- 25.38/100
- National rank
- #7470
- State rank
- #445 of 539 in PA
Livability — Larksville
- Score
- 77/100
- State rank
- #354
- US rank
- #3113
Category grades
Schools grade is shown separately in the Schools card above.
Census & demographics
- Census place
- Larksville, PA
- Population (ZIP)
- 8,672
Population outlook (Luzerne County) Hauer SSP2
- Today (2025)
- 319,505 people
- By 2030
- 319,943 · +0.1%
- By 2040
- 322,643 · +1.0%
- By 2050
- 330,817 · +3.5%
- By 2075
- 379,145 · +18.7%
- By 2100
- 431,908 · +35.2%
Race, ethnicity, and origin ACS 2023
- Neighborhood character
- Predominantly White (82%)
- Race & ethnicity
- White 82% Hispanic / Latino 10% Black 5% Two or more races 4%
- Hispanic origin (detail)
- Mexican 3% Dominican 5%
- Common ancestry
- Romanian 19% Scotch-Irish 2% Iranian 2%
- Foreign-born
- 5% · Canada
- Languages at home
- 91% English-only · Spanish 7% Other Indo-European 1%
Political lean MEDSL · Luzerne
- 2024 margin
- R (+19.2) · D 40.0% · R 59.2%
- 2008→2024 swing
- -27.6pp toward R · 2008: 8.4pp · 2024: -19.2pp
- All cycles
- 2024: R+19.2 2020: R+14.4 2016: R+19.6 2012: D+4.8 2008: D+8.4
Not yet ingested
- Civics
- —
Market trends
- HPI YoY
- ▼ -29.78%
- Current HPI
- 229.6791
- Rent YoY
- —
- Metro
- —
- State GDP YoY
- ▲ 1.68%
- F500 in state
- 34
Industry mix (Fortune 500 HQ in PA)
| Industry | F500 HQs | Revenue |
|---|---|---|
| Healthcare | 2 | $309B |
|
||
| Insurance | 2 | $27B |
|
||
| Telecommunications / Media | 1 | $124B |
|
||
| Industrial Distribution | 1 | $22B |
|
||
| Financial Services | 1 | $20B |
|
||
| Chemicals / Materials | 1 | $18B |
|
||
Price history
-27.3% since first listed4 events — show timeline
- 2026-06-08 Price Changed $39,999 LCAR
- 2026-05-07 Price Changed $49,999 LCAR
- 2026-05-05 Listed $54,999 LCAR
- 2026-03-30 Price Changed $54,999 LCAR
Cash-flow waterfall
monthlySold comps — $/sqft
last 12 mo · ≤1 miLoading sold comps…