 Multi-family
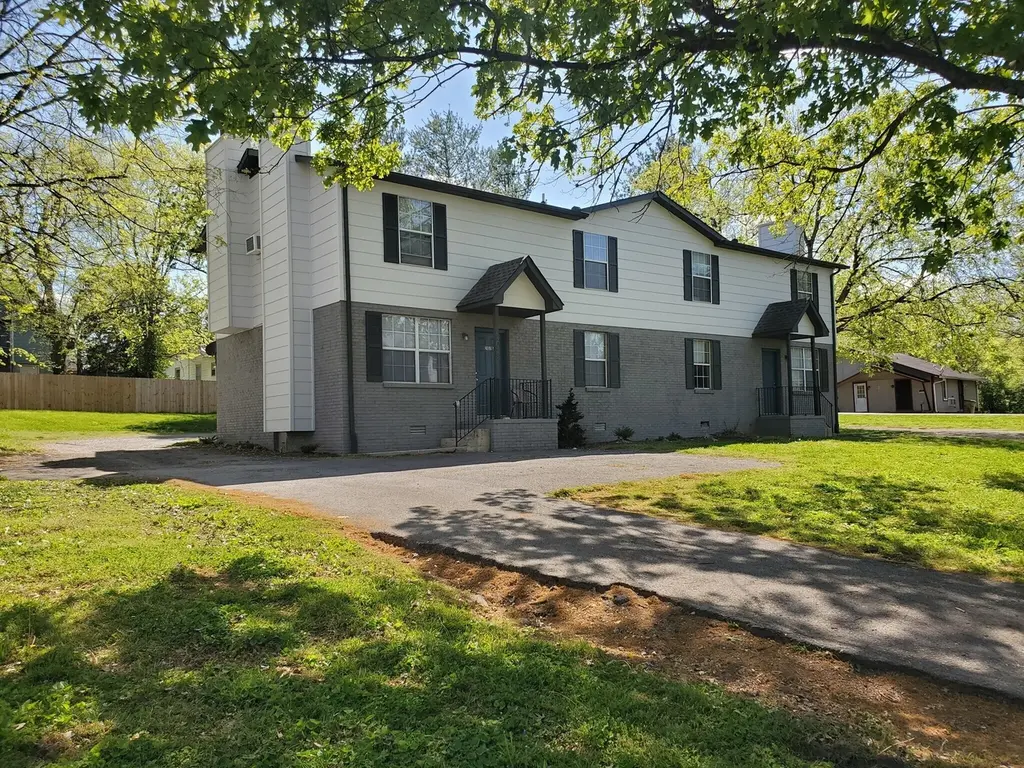
206A E Palestine Ave · Nashville-Davidson metropolitan government (balance), TN
Flood risk 1/10 · Minimal
- FEMA flood zone
- X (unshaded)
- Chance of flooding over 30 yrs
- 0.0%
- Est. flood insurance / yr
- $507 – $1,088
Fire risk 1/10 · Minimal
- Est. fire insurance / yr
- $949 – $1,763
Heat risk 6/10 · Moderate
- Hot days now (above 105°F)
- 7 days/yr
- Hot days in 30 yrs
- 21 days/yr
Wind risk 4/10 · Minor
- Chance of severe wind over 30 yrs
- 8.0%
Air-quality risk 3/10 · Minor
- Unhealthy air days now
- 3 days/yr
- Unhealthy air days in 30 yrs
- 5 days/yr
Risk factors via First Street. Map © Google.
Why this score? — see what drove the B- grade
The composite is a weighted blend of 9 inputs, each scored 0–100. Each bar is that input's sub-score; the figure is the points it added to the 100-point composite (weight × sub-score).
- Cash flow +30.0/30.0
- 1% rule +10.0/10.0
- DSCR +10.0/10.0
- ARV discount +6.2/15.0
- Condition / age +4.0/5.0
- Livability +2.5/5.0
- Rent growth +2.3/5.0
- Schools +1.4/10.0
- Appreciation +0.0/10.0
$390,000
🖨 Deal sheet 📄 Offer letter ✓ Due diligence
Multi-family units
County records classify this as Multi-Family (2-4 Unit). Listing-text estimate: 1 unit. estimate disagrees with records
Listing remarks
Public Remarks: 10 full units completely rented and always rented. This is investors dream with instant revenue stream. Currently posting a NOI over $133k per year and that will only increase. Some rents under market and 2 units increasing rent by $248 per month. All of this with super low expenses as all units on separate utility meters. All units are 2-bedroom 1 bath units and recently remodeled as well. Each unit features a wood burning fireplace and believe it or not, washer and dryer inside the unit as well. Great setup to properties as occupants have either a downstairs patio or second floor deck. Owner recently replaced roofs plus finished other repairs and updates for this sale. L
Key facts
- Recently remodeled
- Downstairs patio
- Washer and dryer
Tags
Property features AI
Finance
- Financial info: Gross income approximately $163,260; Net operating income approximately $133,730; Tenants pay cable TV, electricity, trash collection, and water; Owner pays none of the listed tenant expenses
Exterior
- Parking: Driveway parking; Asphalt parking surface
- Utilities: Public water; Public sewer; Water available
- Home design: Residential income property; Attached property; Duplex; One level
- Construction: Brick and frame construction; Shingle roof; Existing structure
- Exterior features: Asphalt driveway; 50 x 169 lot dimensions; Lot measured in acres
Interior
- Bedrooms: Two 2-bedroom units
- Flooring: Laminate
- Bathrooms: Two 1-bath units
- Heating & cooling: Baseboard heating; Wall/window air conditioning units
- Interior features: Laminate flooring; Has heating (baseboard); Has cooling (wall/window unit(s)); Has view
- Laundry & utility: Individual laundry; Electric dryer hookup; Washer hookup
Neighborhood map
What this means for you Summary
Snapshot
- This is a 4-bed/2.0-bath multifamily listed at $390k. Condition is rated good.
Deal economics
- At list price, monthly cash flow is $8k ($99k/yr) — positive.
- The deal already cash-flows at list — no discount required.
- Meets the 1% rule at list price ($14k rent vs $390k).
- Recommended offer: $367k (6.0% below list) — sets the bar for market timing.
- Cap rate 31.6% vs local median 2.9% in Nashville-Davidson metropolitan government (balance) — top-decile yield for the area; either an underpriced asset or a hidden risk that comps aren't pricing in. Stress-test before assuming the spread holds.
Location & tenants
- Location reads: area grade B — affects rentability + tenant quality, not the cash-flow math above.
- Davidson County (urban): math 12% / reading 19% proficiency, ranked #126 of 139 in TN (top 91%) — low school quality limits family demand, transient renter base, plan for 1-2y turnover; 66% free/reduced lunch — lower-income household profile, screen leases tightly.
- Zoned schools: Stratton Elementary (math 2% / reading 8%, grade F, #896 of 952 statewide, top 96%, 474 students, 0% FRL); Hunters Lane High (math 0% / reading 8%, grade F, #321 of 332 statewide, top 97%, 1,466 students, 0% FRL) — zoned schools average 0% FRL vs 66% district-wide (66 pts lower); this property's tenant base skews higher-income than the district average.
- Market conditions: Rents soft (-0.9%/yr); 330 active listings in the ZIP; 24 comparable units currently listed for rent nearby; rentals at typical pace (median 18d on market — plan ~3-4 weeks tenant-placement turnaround); 6,873 units permitted in Davidson County in 2024 (4,138 in 5+ unit buildings).
- At $13,833/mo this rent would consume 304% of the median local household income ($55k/yr) (locally 2759% of renters already pay >50% of income on rent) — very limited rent-growth headroom before tenants either downsize or default.
Forward outlook
- Local home prices are declining (-3.0%/yr); year-one equity from $3k of loan paydown is wiped out by about $12k of value loss. Plan a longer hold.
- Davidson County population projected at +42% by 2050 — long-run rental-demand tailwind backs the buy-and-hold thesis.
- At projected returns (-3.0% appreciation + 0.0% rent growth), your $109k cash investment doubles in ~2 years — after that, you're playing with house money.
Negotiation context
- It's been on market 67 days — a 6% lower offer ($367k) is reasonable based on typical stale-listing flexibility.
- 3 sale attempts since 5y ago with the ask held roughly flat each time — persistent listings suggest the price (not the market) is what's stuck; bring a comps-based counter.
Risks & watch-outs
- Climate carrying-cost: extreme-heat days projected 7→21/yr by 2055 (HVAC capex compounding) — expect insurance premiums to compound above CPI over the hold.
Questions for the listing agent
- It's been on market 67 days. Have you received any prior offers? Is the seller open to a 6% concession, seller financing, or rate buy-down credit?
- Why hasn't it sold? Are there any deal-killer items the seller is aware of (foundation, flood, title, zoning, code violations)?
- Is there a deadline driving the sale (1031 exchange, divorce, estate, relocation)? That informs how much negotiation room exists.
- What's the average days-on-market for RENTAL listings here right now (not sales)? A rising rental-DOM trend means longer vacancies and softer asking-rent achievability than the comps imply.
- What's the recent tenant-quality profile in this submarket — average credit score on applications, eviction rate, late-payment / NSF rate, and stable-employment percentage? A property-management company in the area should have these aggregated.
- How much new apartment / multifamily construction is in the pipeline within 1–3 miles? Heavy new supply (>2% of stock underway) typically softens rents 12–24 months out; light construction supports rent growth.
Investment metrics
- 1% rule
- 3.55% ✓
- Cap rate
- 31.62%
- Cash-on-cash
- 90.47%
- DSCR
- 5.03
- GRM
- 2.3
CMA / ARV
- ARV (on-the-fly)
- $378,820
- Comps found
- 3
Show comp detail 3 sales within ~0.75 mi
| Address | Dist | Beds/Ba | Sqft | Sold | Price | $/sf | Match |
|---|---|---|---|---|---|---|---|
| 322 Emmitt Ave | 0.29mi | 4/2.0 | 1,575 (-2%) | 9mo | $255,000 | $162 | 76 |
| 809 Denson Ave | 0.50mi | 4/2.0 | 1,400 (-13%) | 15mo | $385,000 | $275 | 42 |
| 831 Gallavista Ave | 0.34mi | 4/2.0 | 1,374 (-15%) | 23mo | $322,500 | $235 | 40 |
Match score weights: distance 35% · size 25% · config 20% · recency 20%. Top-matched comps best support the ARV.
Projected returns pro-forma
-3.0% appreciation · 0.0% rent growth · sell at horizon
- IRR
- 87.7%
- Equity multiple
- 4.85×
- Total profit
- $420,829
- Equity at exit
- $58,150
- IRR
- 90.1%
- Equity multiple
- 9.11×
- Total profit
- $885,822
- Equity at exit
- $33,720
Cash invested: $109,200 (down + closing). Projections, not guarantees.
Landlord ↔ Tenant lean methodology
- Overall (STATE)
- 87 Strongly Landlord-Friendly
- State Tennessee
- 87 Strongly Landlord-Friendly · R+13
- County
- — inherits STATE
- City
- — inherits STATE
ZIP-level market 37115
- Rents YoY
- -0.9%
- Active inventory
- 330
- Price-to-rent
- 23.5×
Monthly cashflow live
- Estimated rent
- $13,833 high interval (Pro) →
- Mortgage (P&I)
- −$2,045
- Tax est. 1.5%
- −$488 /mo · $5,850/yr
- Insurance
- −$162
- HOA
- −$0
- Vacancy / Maint / Mgmt
- −$2,905
- Net cashflow
- $8,233
Break-even live
10-unit breakdown (identical units grouped — click to expand)
| Units | Beds | Baths | Est. rent |
|---|---|---|---|
| 10× units | 2 | 1 | $13,830 |
| #1 | 2 | 1 | $1,383 |
| #2 | 2 | 1 | $1,383 |
| #3 | 2 | 1 | $1,383 |
| #4 | 2 | 1 | $1,383 |
| #5 | 2 | 1 | $1,383 |
| #6 | 2 | 1 | $1,383 |
| #7 | 2 | 1 | $1,383 |
| #8 | 2 | 1 | $1,383 |
| #9 | 2 | 1 | $1,383 |
| #10 | 2 | 1 | $1,383 |
| Total (10 units) | $13,833 | ||
UW: 25.0% down · 7.5% · 30yr · 1.5% tax · 5.0% vac · 8.0% maint · 8.0% mgmt
Financing live
Cash to close
- Down payment
- $97,500
- Closing costs
- $11,700
- Reserves months
- —
- Total cash needed
- —
Loan-product check · same deal, 3 products live
Conventional
25% down · 7.5% · 30yr
- Down + closing
- —
- Monthly P&I
- —
- Monthly cashflow
- —
- DSCR
- —
- Eligible?
- —
Personal DTI + credit; lowest rate.
DSCR
20% down · 8.5% · 30yr
- Down + closing
- —
- Monthly P&I
- —
- Monthly cashflow
- —
- DSCR
- —
- Eligible?
- —
No personal income docs; deal must DSCR.
Hard money
10% down · 12.0% · 12mo
- Down + closing
- —
- Monthly P&I
- —
- Monthly cashflow
- —
- DSCR
- —
- Eligible?
- —
Short-term bridge; refi at stabilization.
Rent comps 24 comps
| Address | Beds | Baths | Sqft | Rent | $/sqft | DOM | Units | Dist |
|---|---|---|---|---|---|---|---|---|
| 201 E Palestine Ave Madison, TN | 1.0–3.0 | 1.0–2.0 | 1097 | $1,549 | $1.41 | 2d | 8 | 0.12mi |
| 1132 Peter Pan St Madison, TN | 4.0 | 3.0 | 1668 | $2,695 | $1.62 | 23d | 1 | 0.31mi |
| 766 Oakdell Ave Madison, TN | 4.0 | 2.0 | 1528 | $1,750 | $1.15 | 23d | 1 | 0.49mi |
| 409 Barbara Dr Madison, TN | 3.0 | 2.5 | 1849 | $3,000 | $1.62 | 17d | 1 | 0.58mi |
| 266 Neelys Bend Rd Madison, TN | 3.0 | 2.0 | 1668 | $2,600 | $1.56 | 17d | 1 | 0.60mi |
| 101 Rothwood Ct Madison, TN | 3.0 | 2.0 | 1100 | $2,300 | $2.09 | 17d | 1 | 0.65mi |
| 3128 Penn Meade Way Nashville, TN | 3.0 | 2.0 | 1103 | $2,300 | $2.09 | 21d | 1 | 0.68mi |
| 3172 Penn Meade Way Nashville, TN | 3.0 | 2.0 | 1103 | $1,973 | $1.79 | 23d | 1 | 0.74mi |
| 2141 Wooddale Ln Nashville, TN | 3.0 | 2.5 | 1887 | $2,750 | $1.46 | 20d | 1 | 0.74mi |
| 600 Rothwood Ave Madison, TN | 1.0–3.0 | 1.0–1.5 | 990 | $1,500 | $1.52 | 2d | 8 | 0.77mi |
| 2637 River Meade Way Nashville, TN | 3.0 | 2.0 | 1244 | $2,135 | $1.72 | 12d | 1 | 0.83mi |
| 926 Idlewild Dr Madison, TN | 3.0 | 2.0 | 1500 | $2,500 | $1.67 | 21d | 1 | 0.84mi |
| 3304 Penn Meade Way Nashville, TN | 4.0 | 2.0 | 1852 | $2,445 | $1.32 | 2d | 1 | 0.90mi |
| 2773 River Bend Dr Nashville, TN | 3.0 | 2.5 | 1400 | $2,239 | $1.60 | 16d | 1 | 1.07mi |
| 4904 Inglewood Ct Nashville, TN | 4.0 | 2.0 | 1545 | $2,000 | $1.29 | 17d | 1 | 1.20mi |
| 720 Carmel Ave Madison, TN | 3.0 | 2.0 | 1424 | $2,100 | $1.47 | 23d | 1 | 1.20mi |
| 4810 Gallatin Pike #301 Nashville, TN | 3.0 | 3.0 | 1247 | $3,250 | $2.61 | 14d | 1 | 1.22mi |
| 1013 Chadwell Dr Madison, TN | 3.0 | 2.0 | 1454 | $2,325 | $1.60 | 3d | 1 | 1.23mi |
| 2916 Delta Queen Dr Nashville, TN | 3.0 | 2.0 | 1217 | $2,600 | $2.14 | 23d | 1 | 1.24mi |
| 96 Shields Ln Madison, TN | 3.0 | 3.0 | 1613 | $2,600 | $1.61 | 16d | 1 | 1.24mi |
| 2712 River Bend Dr Nashville, TN | 3.0 | 2.0 | 1075 | $2,150 | $2.00 | 4d | 1 | 1.28mi |
| 510 Heritage Dr Madison, TN | 1.0–3.0 | 1.0–2.5 | 1097 | $2,010 | $1.83 | 2d | 17 | 1.31mi |
| 3348 Cain Harbor Dr Nashville, TN | 3.0 | 2.5 | 1480 | $2,300 | $1.55 | 17d | 1 | 1.42mi |
| 4213 Longfellow Dr Nashville, TN | 3.0 | 2.5 | 2069 | $3,100 | $1.50 | 23d | 1 | 1.50mi |
Listing history 19 events
-
2026-06-18days on market $390,000 Active 67 DOM
-
2026-06-17days on market $390,000 Active 66 DOM
-
2026-06-16days on market $390,000 Active 65 DOM
-
2026-06-15days on market $390,000 Active 64 DOM
-
2026-06-13days on market $390,000 Active 62 DOM
-
2026-06-13days on market $390,000 Active 61 DOM
-
2026-06-09days on market $390,000 Active 58 DOM
-
2026-06-08days on market $390,000 Active 57 DOM
-
2026-06-07days on market $390,000 Active 56 DOM
-
2026-06-05days on market $390,000 Active 53 DOM
-
2026-06-03days on market $390,000 Active 52 DOM
-
2026-06-02days on market $390,000 Active 51 DOM
-
2026-06-01days on market $390,000 Active 50 DOM
-
2026-05-31days on market $390,000 Active 49 DOM
-
2026-04-12$390,000 Active
-
2025-05-17historical $1,350
-
2025-03-18$1,350
-
2021-02-25historical
-
2021-02-24$289,000 Active
ⓘ Source: listings_history table (triggers on properties + properties_extension) + one-shot
backfill from property_details.listing_events for pre-trigger history.
Climate risk First Street
- Flood 1/10 Low FEMA zone X (unshaded) · 0% chance over 30 yrs
- Wildfire 1/10 Low
- Heat 6/10 Major 7 d/yr ≥105°F today · 21 d/yr by 30 yrs out
- Wind 4/10 Moderate 8% chance of damaging wind over 30 yrs
- Air quality 3/10 Moderate 3 unhealthy d/yr today · 5 by 30 yrs out
Nearby sold comps map
Loading sold comps map…
Walkable amenities ~0.75 mi
Loading nearby amenities…
Taxation est. · year 1
- Rental income
- $165,996
- − Mortgage interest
- −$21,846
- − Property taxes
- −$5,850
- − Insurance
- −$1,950
- − Repairs & maintenance
- −$13,280
- − Management
- −$13,280
- − Depreciation
- −$11,345
- Taxable income
- $98,445
- Est. tax owed @ 24.0%
- −$23,627
- After-tax cash flow
- $75,168/yr
For passive investors: Depreciation is non-cash, so a rental often shows a tax loss while cash-flowing — sheltering income. Rental losses are passive: they offset passive income freely, and up to $25,000/yr can offset ordinary (W-2) income if you actively participate and your MAGI is under $100k (phasing out to $0 by $150k); unused losses carry forward. On sale, claimed depreciation is recaptured at up to 25%, and gains may owe capital-gains tax (a 1031 exchange can defer both). Figures are a year-1 estimate at your 24.0% rate — not tax advice; consult a CPA.
Condition & rehab AI · 13 photos
This multi-family property is in good condition with no major repairs needed. It has a good exterior and interior condition, and the roof appears to be in good condition. The property is currently rented and posting a NOI over $133k per year. Painting the exterior siding and replacing the flooring and kitchen appliances would be the highest-ROI updates to increase its value.
Value-add opportunities
- Both Paint the exterior siding — Painting the exterior siding will improve the curb appeal and increase the resale and rental value of the property.
- Both Replace the flooring — Replacing the flooring with a more durable and attractive option will improve the overall appearance of the property and increase its value.
- Both Upgrade the kitchen appliances — Upgrading the kitchen appliances to more modern and energy-efficient models will improve the overall appearance of the property and increase its value.
Renovation cost estimate screening
Value-add ROI direction
- Both Paint the exterior siding — Painting the exterior siding will improve the curb appeal and increase the resale and rental value of the property. ↑
- Both Replace the flooring — Replacing the flooring with a more durable and attractive option will improve the overall appearance of the property and increase its value. ↑
- Both Upgrade the kitchen appliances — Upgrading the kitchen appliances to more modern and energy-efficient models will improve the overall appearance of the property and increase its value. ↑
ⓘ Cost ranges are severity-bucket heuristics (US national rule-of-thumb). Get contractor quotes + a written scope before underwriting a rehab budget.
Schools (NCES district)
- District
- Davidson County
- NCES district ID
- 4703180
- Math proficiency
- 12% ▼ -17.00%
- Reading proficiency
- 19% ▼ -7.00%
- Median HH income
- $48,667
- Composite
- 14.03/100
- National rank
- #9472
- State rank
- #126 of 139 in TN
Livability — Nashville-Davidson metropolitan government (balance)
No livability data for this city. (Only ~50 U.S. cities are tracked.)
Census & demographics
- Census place
- Nashville-Davidson metropolitan government (balance), TN
- County
- Davidson County · 680,067 people
- City population
- 677,595
- Metro
- Nashville-Davidson--Murfreesboro--Franklin, TN
- Population (ZIP)
- 40,615
- Household income
- $54,566
- Rent vs Own
- Severe rent burden
- 2759.0
Population outlook (Davidson County) Hauer SSP2
- Today (2025)
- 808,568 people
- By 2030
- 874,489 · +8.2%
- By 2040
- 1,009,046 · +24.8%
- By 2050
- 1,147,294 · +41.9%
- By 2075
- 1,475,439 · +82.5%
- By 2100
- 1,714,101 · +112.0%
Race, ethnicity, and origin ACS 2023
- Neighborhood character
- Diverse neighborhood (Simpson 0.70)
- Race & ethnicity
- White 37% Black 32% Hispanic / Latino 26% Two or more races 12% Asian 2%
- Hispanic origin (detail)
- Mexican 13% Cuban 2%
- Common ancestry
- Serbian 1% Italian 1% Iranian 1%
- Foreign-born
- 18% · Canada
- Languages at home
- 74% English-only · Spanish 22% Tagalog/Filipino 1% Other Indo-European 1%
Political lean MEDSL · Davidson
- 2024 margin
- Strong D (+27.4) · D 62.7% · R 35.3% · Other 2.0%
- 2008→2024 swing
- +6.5pp toward D · 2008: 21.0pp · 2024: 27.4pp
- All cycles
- 2024: D+27.4 2020: D+32.1 2016: D+26.0 2012: D+18.7 2008: D+21.0
Not yet ingested
- Civics
- —
Market trends
- HPI YoY
- ▼ -259.74%
- Current HPI
- 341.9614
- Rent YoY
- ▼ -0.94%
- Metro
- Nashville-Davidson--Murfreesboro--Franklin, TN
- State GDP YoY
- ▲ 2.78%
- F500 in state
- 22
Industry mix (Fortune 500 HQ in TN)
| Industry | F500 HQs | Revenue |
|---|---|---|
| Healthcare | 3 | $91B |
|
||
| Retail | 3 | $72B |
|
||
| Transportation / Logistics | 1 | $88B |
|
||
| Paper / Packaging | 1 | $19B |
|
||
| Insurance | 1 | $13B |
|
||
| Energy | 1 | $12B |
|
||
Price history
+34.9% since first listed5 events — show timeline
- 2026-04-12 Listed $390,000 REALTRACS as Distributed by MLS Grid
- 2025-05-17 Rental Removed $1,350 REALTRACS
- 2025-03-18 Listed for Rent $1,350 REALTRACS
- 2021-02-25 Listing Removed — REALTRACS as Distributed by MLS Grid
- 2021-02-24 Listed $289,000 REALTRACS as Distributed by MLS Grid
Cash-flow waterfall
monthlySold comps — $/sqft
last 12 mo · ≤1 miLoading sold comps…