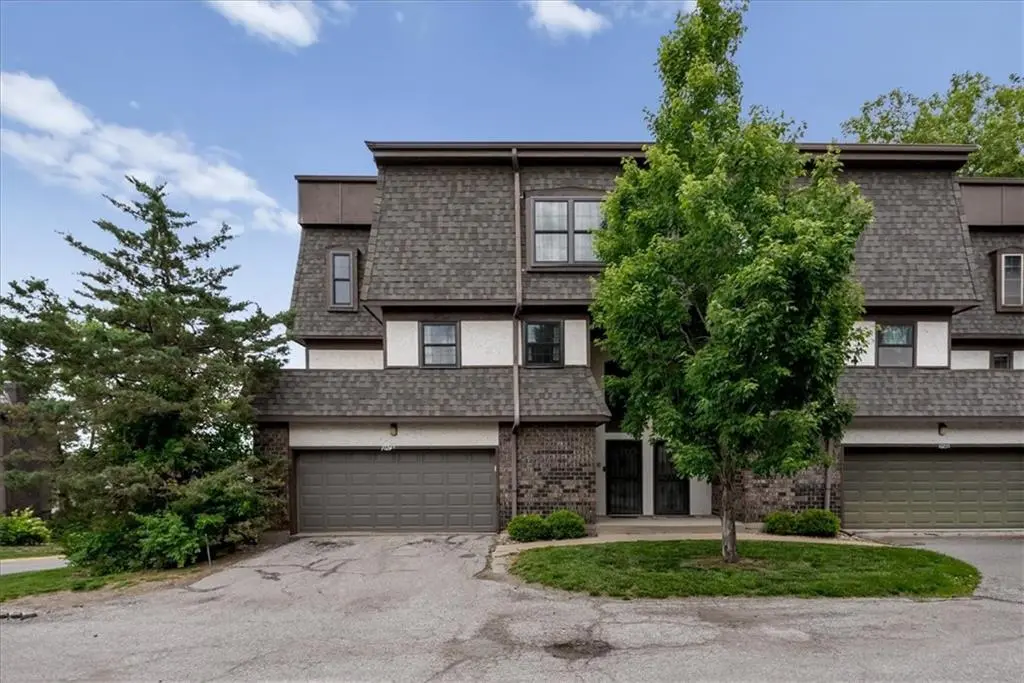
10249 Cedarbrooke Ln · Kansas City, MO
Flood risk 1/10 · Minimal
- FEMA flood zone
- X (unshaded)
- Chance of flooding over 30 yrs
- 0.0%
- Est. flood insurance / yr
- $473 – $860
Fire risk 1/10 · Minimal
- Est. fire insurance / yr
- $1,054 – $1,958
Heat risk 4/10 · Minor
- Hot days now (above 107°F)
- 7 days/yr
- Hot days in 30 yrs
- 17 days/yr
Wind risk 2/10 · Minimal
- Chance of severe wind over 30 yrs
- —
Air-quality risk 3/10 · Minor
- Unhealthy air days now
- 3 days/yr
- Unhealthy air days in 30 yrs
- 3 days/yr
Risk factors via First Street. Map © Google.
Why this score? — see what drove the F grade
The composite is a weighted blend of 9 inputs, each scored 0–100. Each bar is that input's sub-score; the figure is the points it added to the 100-point composite (weight × sub-score).
- ARV discount +6.4/15.0
- Cash flow +5.0/30.0
- Livability +3.9/5.0
- Rent growth +3.5/5.0
- Condition / age +2.5/5.0
- 1% rule +2.3/10.0
- Schools +1.8/10.0
- DSCR +0.0/10.0
- Appreciation +0.0/10.0
$250,000
🖨 Deal sheet 📄 Offer letter ✓ Due diligence
Listing remarks MLS
Tons of living space in this large end unit! Living room features fireplace & brand new balcony/deck. Spacious eat-in kitchen opens to formal dining room. Den is located on kitchen level! All bedrooms are large w/ great closets! Finished, walkout basement. Never mow or shovel again! Walk to the community pool that offers shaded & sunny areas.
Key facts
- $375 HOA
- 2 garage spots
- Community pool
Property features AI
Finance
- HOA & community: Cedarbrooke HOA; Monthly association fee; Community clubhouse and pool; HOA covers building exterior, lawn service, roof repair/replace, snow removal, street maintenance, water, curbside recycling, and management
Exterior
- Parking: Attached garage with opener (2 garage spaces)
- Utilities: Public water; Public sewer
- Home design: Attached townhouse; 3 stories with split-entry elements; Public records list above-grade finished area; additional finished space below grade
- Construction: Brick/mortar construction; Other type roof
- Exterior features: Deck; Patio; Wood fencing; Not in a flood plain
Interior
- Kitchen: Dishwasher; Disposal; Electric range; Pantry; Eat-in kitchen and formal dining area
- Bedrooms: 4 bedrooms (various levels; bedrooms include walk-in closets)
- Flooring: Carpet; Wood; Ceramic tile in kitchen
- Bathrooms: 2 full bathrooms; 1 half bathroom
- Heating & cooling: Forced air heating; Electric cooling
- Interior features: Ceiling fans; Walk-in closets; Window coverings; Finished basement with walk-out access; Two fireplaces (family room and living room)
- Laundry & utility: Laundry in basement
Neighborhood map
What this means for you Summary
Snapshot
- This is a 3-bed/3.5-bath townhouse listed at $250k.
Deal economics
- At list price, monthly cash flow is $-592 ($-7k/yr) — negative.
- To cash-flow at today's rent, offer at most $145k (41.8% below list).
- To meet the 1% rule (rent ≥ 1% of price), the offer needs to be $182k (27.3% below list).
- Recommended offer: $145k (41.8% below list) — sets the bar for cash-flow.
Location & tenants
- Location reads 78/100 on livability (#28 in MO, #2,671 nationally) — a middle-class / working-renter tenant base. Strengths: amenities A+, commute A+, cost of living A+; Watch: crime F.
- Center 58 (urban): math 12% / reading 29% proficiency, ranked #301 of 324 in MO (top 93%) — low school quality limits family demand, transient renter base, plan for 1-2y turnover; 63% free/reduced lunch — lower-income household profile, screen leases tightly.
- Zoned schools: Indian Creek Elem. (math 12% / reading 17%, grade F, #993 of 1,115 statewide, top 90%, 274 students, 99% FRL); Center Sr. High (math 5% / reading 37%, grade F, #468 of 521 statewide, top 90%, 742 students, 62% FRL) — zoned schools average 81% FRL vs 63% district-wide (18 pts higher); higher-poverty schools than district average — tighter screening recommended.
- Market conditions: Rents rising (+4.0%/yr); 131 active listings in the ZIP; 7 comparable units currently listed for rent nearby; rentals leasing fast (median 11d on market — plan ~1-2 weeks tenant-placement turnaround); 4,002 units permitted in Jackson County in 2024 (2,271 in 5+ unit buildings).
- This rent runs 34% of the median local income ($64k/yr) — at the standard rent-burdened threshold; future hikes will face affordability resistance.
Forward outlook
- Local home prices are declining (-3.0%/yr); year-one equity from $2k of loan paydown is wiped out by about $8k of value loss. Plan a longer hold.
- Jackson County population projected at +4% by 2050 — modest demand growth; plan on rents tracking national, not racing it.
Negotiation context
- Only 13 days on market — expect competitive offers; lowballing is unlikely to land.
- 3 sale attempts since 18y ago with the ask held roughly flat each time — persistent listings suggest the price (not the market) is what's stuck; bring a comps-based counter.
Risks & watch-outs
- Watch-outs: HOA is 21% of rent.
Questions for the listing agent
- What do current leases actually rent for vs. the listed asking? Can we see a recent rent roll and the last 12 months of T-12 income?
- Built in 1969 — when were the roof, HVAC, electrical panel, plumbing, and water heater last replaced?
- What does the HOA fee cover, when was the last increase, and are there any pending special assessments or reserve-fund shortfalls?
- Is there a deadline driving the sale (1031 exchange, divorce, estate, relocation)? That informs how much negotiation room exists.
- Crime grade is F in this area — have there been break-ins, vandalism, or insurance claims at this property in the last 3 years? What carrier currently insures it and at what premium?
- The area grade is low — what's the realistic commute time and amenity access for the typical tenant pool here? Any planned neighborhood developments (good or bad) we should know about?
- What's the average days-on-market for RENTAL listings here right now (not sales)? A rising rental-DOM trend means longer vacancies and softer asking-rent achievability than the comps imply.
- What's the recent tenant-quality profile in this submarket — average credit score on applications, eviction rate, late-payment / NSF rate, and stable-employment percentage? A property-management company in the area should have these aggregated.
- How much new for-sale + rental construction is in the pipeline within 1–3 miles? Heavy new supply typically softens prices + rents 12–24 months out; constrained supply supports both.
Investment metrics
- 1% rule
- 0.73% ✗
- Cap rate
- 3.45%
- Cash-on-cash
- -10.14%
- DSCR
- 0.55
- GRM
- 11.5
CMA / ARV
- ARV (on-the-fly)
- $243,788
- Comps found
- 5
Show comp detail 5 sales within ~0.75 mi
| Address | Dist | Beds/Ba | Sqft | Sold | Price | $/sf | Match |
|---|---|---|---|---|---|---|---|
| 10209 Cedarbrooke Ln | 0.08mi | 3/2.5 | 2,220 (+8%) | 3mo | $249,000 | $112 | 78 |
| 10229 Cedarbrooke Ln | 0.06mi | 3/2.5 | 2,146 (+4%) | 13mo | $254,000 | $118 | 76 |
| 10248 Cedarbrooke Ln | 0.06mi | 3/2.5 | 1,859 (-10%) | 4mo | $249,500 | $134 | 73 |
| 10132 Locust St | 0.13mi | 2/2.5 (-1) | 1,890 (-8%) | 3mo | $239,900 | $127 | 68 |
| 10200 Locust St | 0.12mi | 2/2.5 (-1) | 1,960 (-5%) | 19mo | $185,000 | $94 | 61 |
Match score weights: distance 35% · size 25% · config 20% · recency 20%. Top-matched comps best support the ARV.
Projected returns pro-forma
-3.0% appreciation · 3.97% rent growth · sell at horizon
- IRR
- -33.1%
- Equity multiple
- -0.09×
- Total profit
- $-76,195
- Equity at exit
- $37,276
- IRR
- -33.3%
- Equity multiple
- -0.52×
- Total profit
- $-106,518
- Equity at exit
- $21,615
Cash invested: $70,000 (down + closing). Projections, not guarantees.
Landlord ↔ Tenant lean methodology
- Overall (STATE)
- 81 Strongly Landlord-Friendly
- State Missouri
- 81 Strongly Landlord-Friendly · R+10
- County
- — inherits STATE
- City
- — inherits STATE
ZIP-level market 64131
- Rents YoY
- 4.0%
- Active inventory
- 131
- Price-to-rent
- 11.5×
Monthly cashflow live
- Estimated rent
- $1,818 high interval (Pro) →
- Mortgage (P&I)
- −$1,311
- Tax from tax record
- −$238 /mo · $2,856/yr
- Insurance
- −$104
- HOA
- −$375
- Vacancy / Maint / Mgmt
- −$382
- Net cashflow
- $-592
Break-even live
UW: 25.0% down · 7.5% · 30yr · 1.5% tax · 5.0% vac · 8.0% maint · 8.0% mgmt
Financing live
Cash to close
- Down payment
- $62,500
- Closing costs
- $7,500
- Reserves months
- —
- Total cash needed
- —
Loan-product check · same deal, 3 products live
Conventional
25% down · 7.5% · 30yr
- Down + closing
- —
- Monthly P&I
- —
- Monthly cashflow
- —
- DSCR
- —
- Eligible?
- —
Personal DTI + credit; lowest rate.
DSCR
20% down · 8.5% · 30yr
- Down + closing
- —
- Monthly P&I
- —
- Monthly cashflow
- —
- DSCR
- —
- Eligible?
- —
No personal income docs; deal must DSCR.
Hard money
10% down · 12.0% · 12mo
- Down + closing
- —
- Monthly P&I
- —
- Monthly cashflow
- —
- DSCR
- —
- Eligible?
- —
Short-term bridge; refi at stabilization.
Rent comps 7 comps
| Address | Beds | Baths | Sqft | Rent | $/sqft | DOM | Units | Dist |
|---|---|---|---|---|---|---|---|---|
| 201 W 99th Ter Kansas City, MO | 1.0–2.0 | 1.0–2.5 | 1262 | $1,962 | $1.55 | 1d | 52 | 0.61mi |
| 9615 Holmes Rd Kansas City, MO | 4.0 | 2.0 | 1442 | $2,300 | $1.60 | 14d | 1 | 0.77mi |
| 10601 Jefferson St Kansas City, MO | 1.0–2.0 | 1.0–2.0 | 1090 | $3,886 | $3.57 | 10d | 1 | 0.88mi |
| 9706 Wornall Rd Kansas City, MO | 2.0 | 2.5 | 1400 | $1,395 | $1.00 | 17d | 1 | 0.93mi |
| 1520 E 97th St Kansas City, MO | 1.0–3.0 | 1.0–2.0 | 1163 | $1,595 | $1.37 | 2d | 7 | 1.02mi |
| 655 E Minor Dr Kansas City, MO | 1.0–3.0 | 1.0–2.5 | 1232 | $1,800 | $1.46 | 1d | 50 | 1.45mi |
| 9108 Oak St Kansas City, MO | 3.0 | 2.0 | 1966 | $2,295 | $1.17 | 21d | 1 | 1.46mi |
HOA detail
- Monthly dues
- $375 · $4,500/yr
- Likely covers
- pool
Listing history 17 events
-
2026-06-13statusdays on market $250,000 Pending 13 DOM
-
2026-06-09days on market $250,000 Active 12 DOM
-
2026-06-08days on market $250,000 Active 11 DOM
-
2026-06-07days on market $250,000 Active 10 DOM
-
2026-06-03days on market $250,000 Active 6 DOM
-
2026-06-02days on market $250,000 Active 5 DOM
-
2026-06-01days on market $250,000 Active 4 DOM
-
2026-05-31days on market $250,000 Active 3 DOM
-
2026-05-29$250,000 Active
-
2026-05-29historical $250,000
-
2015-07-08soldstatus
-
2012-10-06historical 360-char remark
Show marketing remark (360 chars)
Tons of living space in this large end unit! Living room features fireplace & brand new balcony/deck. Spacious eat-in kitchen opens to formal dining room. Den is located on kitchen level! All bedrooms are large w/ great closets! Finished, walkout basement. Never mow or shovel again! Walk to the community pool that offers shaded & sunny areas.
-
2012-04-06$119,500 360-char remark
Show marketing remark (360 chars)
Tons of living space in this large end unit! Living room features fireplace & brand new balcony/deck. Spacious eat-in kitchen opens to formal dining room. Den is located on kitchen level! All bedrooms are large w/ great closets! Finished, walkout basement. Never mow or shovel again! Walk to the community pool that offers shaded & sunny areas.
-
2008-06-12soldstatus 210-char remark
Show marketing remark (210 chars)
do a little save a lot, BIG BANG FOR YOUR BUCKS, SPECIAL ADDENDUMS APPLY, AS IS, NO SELLER DISCLOSURE, SHOP AND COMPARE TO LIKE UNITS IN SUBDIVISION, FAX OFFERS ALLOW FEW DAYS FOR REPLY, SELLER MAKES NO REPAIRS
-
2008-01-29$108,500 210-char remark
Show marketing remark (210 chars)
do a little save a lot, BIG BANG FOR YOUR BUCKS, SPECIAL ADDENDUMS APPLY, AS IS, NO SELLER DISCLOSURE, SHOP AND COMPARE TO LIKE UNITS IN SUBDIVISION, FAX OFFERS ALLOW FEW DAYS FOR REPLY, SELLER MAKES NO REPAIRS
-
2003-02-04soldstatus
-
1986-07-08soldstatus
ⓘ Source: listings_history table (triggers on properties + properties_extension) + one-shot
backfill from property_details.listing_events for pre-trigger history.
Tax reassessment forecast MO · Resets to sale price
- Current annual tax
- $2,856 · $238/mo
- Projected year-2 tax
- $2,856 · $238/mo
- Expected delta
- $0/yr ($0/mo · 0.0%)
ⓘ Screening estimate from a state-policy table — verify with the county assessor before closing.
Climate risk First Street
- Flood 1/10 Low FEMA zone X (unshaded) · 0% chance over 30 yrs
- Wildfire 1/10 Low
- Heat 4/10 Moderate 7 d/yr ≥107°F today · 17 d/yr by 30 yrs out
- Wind 2/10 Low
- Air quality 3/10 Moderate 3 unhealthy d/yr today · 3 by 30 yrs out
Nearby sold comps map
Loading sold comps map…
Walkable amenities ~0.75 mi
Loading nearby amenities…
Taxation est. · year 1
- Rental income
- $21,820
- − Mortgage interest
- −$14,004
- − Property taxes
- −$2,856
- − Insurance
- −$1,250
- − Repairs & maintenance
- −$1,746
- − Management
- −$1,746
- − HOA
- −$4,500
- − Depreciation
- −$7,273
- Taxable loss
- −$11,554
- Est. tax savings @ 24.0%
- +$2,773
- After-tax cash flow
- $-4,328/yr
For passive investors: Depreciation is non-cash, so a rental often shows a tax loss while cash-flowing — sheltering income. Rental losses are passive: they offset passive income freely, and up to $25,000/yr can offset ordinary (W-2) income if you actively participate and your MAGI is under $100k (phasing out to $0 by $150k); unused losses carry forward. On sale, claimed depreciation is recaptured at up to 25%, and gains may owe capital-gains tax (a 1031 exchange can defer both). Figures are a year-1 estimate at your 24.0% rate — not tax advice; consult a CPA.
Schools (NCES district)
- District
- Center 58
- NCES district ID
- 2908250
- Math proficiency
- 12% ▼ -15.00%
- Reading proficiency
- 29% ▼ -6.00%
- Median HH income
- $43,544
- Composite
- 17.64/100
- National rank
- #9031
- State rank
- #301 of 324 in MO
Livability — Kansas City
- Score
- 78/100
- State rank
- #28
- US rank
- #2671
Category grades
Schools grade is shown separately in the Schools card above.
Census & demographics
- Census place
- Kansas City, MO
- County
- Jackson County · 687,798 people
- City population
- 439,467
- Metro
- Kansas City, MO-KS
- Population (ZIP)
- 21,942
- Household income
- $64,201
- Rent vs Own
- Severe rent burden
- 1249.0
Population outlook (Jackson County) Hauer SSP2
- Today (2025)
- 719,589 people
- By 2030
- 731,456 · +1.6%
- By 2040
- 746,689 · +3.8%
- By 2050
- 749,289 · +4.1%
- By 2075
- 736,227 · +2.3%
- By 2100
- 668,210 · -7.1%
Race, ethnicity, and origin ACS 2023
- Neighborhood character
- Diverse neighborhood (Simpson 0.61)
- Race & ethnicity
- White 48% Black 39% Hispanic / Latino 7% Two or more races 7% Asian 1%
- Hispanic origin (detail)
- Mexican 3%
- Common ancestry
- Italian 5% Slovak 1% Lithuanian 1%
- Foreign-born
- 5% · Canada, Vietnam
- Languages at home
- 93% English-only · Spanish 3% French/Haitian/Cajun 1%
Political lean MEDSL · Jackson
- 2024 margin
- D (+19.3) · D 58.9% · R 39.5% · Other 1.6%
- 2008→2024 swing
- -6.1pp toward R · 2008: 25.4pp · 2024: 19.3pp
- All cycles
- 2024: D+19.3 2020: D+22.0 2016: D+16.6 2012: D+19.0 2008: D+25.4
Not yet ingested
- Civics
- —
Market trends
- HPI YoY
- ▼ -253.25%
- Current HPI
- 340.8202
- Rent YoY
- ▲ 3.97%
- Metro
- Kansas City, MO-KS
- State GDP YoY
- ▲ 1.84%
- F500 in state
- 20
Industry mix (Fortune 500 HQ in MO)
| Industry | F500 HQs | Revenue |
|---|---|---|
| Healthcare | 1 | $163B |
|
||
| Insurance | 1 | $21B |
|
||
| Industrial Technology | 1 | $17B |
|
||
| Retail | 1 | $16B |
|
||
| Industrial Distribution | 1 | $10B |
|
||
| Utilities | 1 | $9B |
|
||
Price history
+130.4% since first listed9 events — show timeline
- 2026-05-29 Listed $250,000 Heartland MLS as Distributed by MLS Grid
- 2026-05-29 Coming Soon $250,000 Heartland MLS as Distributed by MLS Grid
- 2015-07-08 Sold (Public Records) — Public Records
- 2012-10-06 Listing Removed — Heartland MLS as Distributed by MLS Grid
- 2012-04-06 Listed $119,500 Heartland MLS as Distributed by MLS Grid
- 2008-06-12 Sold (MLS) — Heartland MLS as Distributed by MLS Grid
- 2008-01-29 Listed $108,500 Heartland MLS as Distributed by MLS Grid
- 2003-02-04 Sold (Public Records) — Public Records
- 1986-07-08 Sold (Public Records) — Public Records
Property tax history
+3.1%/yrLatest (2025): $2,856 · -8.3% YoY. Source: county tax records.
Cash-flow waterfall
monthlySold comps — $/sqft
last 12 mo · ≤1 miLoading sold comps…