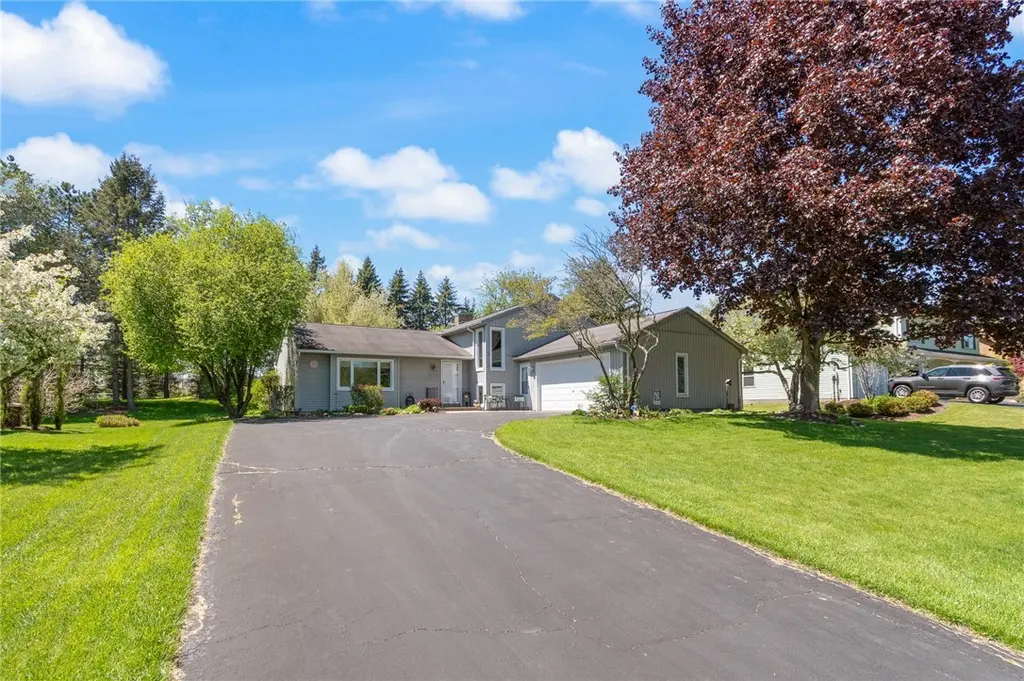
9 Falling Brook Rd · Fairport, NY
Flood risk 1/10 · Minimal
- FEMA flood zone
- X (unshaded)
- Chance of flooding over 30 yrs
- 0.0%
- Est. flood insurance / yr
- $473 – $860
Fire risk 1/10 · Minimal
- Est. fire insurance / yr
- $691 – $1,283
Heat risk 2/10 · Minimal
- Hot days now (above 96°F)
- 7 days/yr
- Hot days in 30 yrs
- 16 days/yr
Wind risk 1/10 · Minimal
- Chance of severe wind over 30 yrs
- —
Air-quality risk 2/10 · Minimal
- Unhealthy air days now
- 1 days/yr
- Unhealthy air days in 30 yrs
- 1 days/yr
Risk factors via First Street. Map © Google.
Why this score? — see what drove the D- grade
The composite is a weighted blend of 9 inputs, each scored 0–100. Each bar is that input's sub-score; the figure is the points it added to the 100-point composite (weight × sub-score).
- ARV discount +15.0/15.0
- Cash flow +6.3/30.0
- Schools +5.4/10.0
- Livability +3.7/5.0
- 1% rule +2.8/10.0
- Condition / age +2.5/5.0
- Rent growth +2.3/5.0
- DSCR +0.6/10.0
- Appreciation +0.0/10.0
$299,900
🖨 Deal sheet (PDF) 📄 Offer letter ✓ Due diligence
Listing remarks
Beautifully maintained split-level home in the heart of Fairport offering the perfect blend of space, comfort, and location! Featuring 4 bedrooms and 2.5 baths, this versatile home includes a desirable in-law suite complete with a kitchenette, opening many options to potential buyers! The main living areas are designed for both everyday living and entertaining, with a living room/formal dining area in addition to a cozy family room with fireplace and built-ins! Eat-in kitchen sliding door opens to private patio area with nicely manicured landscaping and flower beds overlooking a peaceful backyard setting, backing directly to Center Park East Sports Fields, divided by foliage providing
Key facts
- In-law suite
- Updated appliances
- Private patio area
Tags
Property features AI
Finance
- HOA & community: Trails/paths nearby
Exterior
- Parking: Attached garage; 2-car garage; Driveway
- Utilities: Public water connected; Sewer connected; High-speed internet available; Electric service with circuit breakers
- Home design: Single-story; Existing construction
- Construction: Vinyl siding; Blown-in insulation; Copper plumbing; Asphalt roof; Block and slab foundation; Below-grade finished area present (partial finished basement)
- Exterior features: Blacktop driveway; Rectangular residential lot; City street frontage; Lot dimensions approximately 90 x 160
Interior
- Kitchen: Electric range; Electric oven; Dishwasher; Refrigerator; Eat-in kitchen
- Bedrooms: One bedroom on the main level; In-law suite
- Flooring: Carpet; Vinyl; Varied flooring
- Bathrooms: 2 full bathrooms; 1 half bathroom; One bathroom on the main level
- Heating & cooling: Electric heating; Forced air; Heat pump (heating and cooling); Central air
- Interior features: Ceiling fan(s); Separate/formal dining room; Eat-in kitchen; Separate/formal living room; Living/dining room; Sliding glass door(s); Window treatments; Drapes; Sliding doors; In-law floorplan; Workshop; See remarks
- Laundry & utility: Washer; Dryer; Laundry in basement
Neighborhood map
What this means for you Summary
Snapshot
- This is a 3-bed/2.5-bath single-family listed at $300k.
Deal economics
- At list price, monthly cash flow is $-536 ($-6k/yr) — negative.
- To cash-flow at today's rent, offer at most $205k (31.6% below list).
- To meet the 1% rule (rent ≥ 1% of price), the offer needs to be $234k (21.8% below list).
- Recommended offer: $205k (31.6% below list) — sets the bar for cash-flow.
- Cap rate 4.1% vs local median 3.4% in Fairport — meaningfully above typical; check what's discounted (condition, days-on-market, listing class) to confirm the premium yield is real.
Location & tenants
- Location reads 74/100 on livability (#301 in NY, #4,847 nationally) — a middle-class / working-renter tenant base. Strengths: housing A+, health & safety A+, schools A; Watch: commute F.
- Fairport Central School District (suburban): math 55% / reading 66% proficiency, ranked #199 of 590 in NY (top 34%) — acceptable for families but not a draw, mixed tenant base, ~2y average lease; only 14% free/reduced lunch — higher-income household profile.
- Market conditions: Rents soft (-0.8%/yr); 188 active listings in the ZIP; solid renter incomes; 1,169 units permitted in Monroe County in 2024 (591 in 5+ unit buildings).
Forward outlook
- Local home prices are declining (-3.0%/yr); year-one equity from $2k of loan paydown is wiped out by about $9k of value loss. Plan a longer hold.
- Monroe County population projected to shrink 6% by 2050 — rents likely to lag national; underwrite the cash flow, not the appreciation.
Negotiation context
- Only 11 days on market — expect competitive offers; lowballing is unlikely to land.
- Current owner paid $188k; list at $300k implies a 60% gain — meaningful room to come down on a strong offer.
Risks & watch-outs
- Watch-outs: property tax is 2.8% of price.
Questions for the listing agent
- What do current leases actually rent for vs. the listed asking? Can we see a recent rent roll and the last 12 months of T-12 income?
- Property tax is high relative to price — has the assessment been appealed recently, and will the sale trigger a re-assessment?
- Is there a deadline driving the sale (1031 exchange, divorce, estate, relocation)? That informs how much negotiation room exists.
- Schools are A-rated — typically a magnet for longer-tenancy family renters. What's the average tenant stay here, and is there a school-zone premium baked into asking?
- The area grade is low — what's the realistic commute time and amenity access for the typical tenant pool here? Any planned neighborhood developments (good or bad) we should know about?
- What's the average days-on-market for RENTAL listings here right now (not sales)? A rising rental-DOM trend means longer vacancies and softer asking-rent achievability than the comps imply.
- What's the recent tenant-quality profile in this submarket — average credit score on applications, eviction rate, late-payment / NSF rate, and stable-employment percentage? A property-management company in the area should have these aggregated.
- How much new for-sale + rental construction is in the pipeline within 1–3 miles? Heavy new supply typically softens prices + rents 12–24 months out; constrained supply supports both.
Investment metrics
- 1% rule
- 0.78% ✗
- Cap rate
- 4.15%
- Cash-on-cash
- -7.66%
- DSCR
- 0.66
- GRM
- 10.7
CMA / ARV
- ARV (median comp)
- $464,094
- List price
- $299,900
- Delta
- -35.38%
- Verdict
- UNDERPRICED
- Comps
- 20 within 1.0 mi
Show comp detail 12 sales within ~0.75 mi
| Address | Dist | Beds/Ba | Sqft | Sold | Price | $/sf | Match |
|---|---|---|---|---|---|---|---|
| 12 Falling Brook Rd | 0.04mi | 4/2.5 (+1) | 2,356 (+9%) | 6mo | $429,500 | $182 | 73 |
| 11 Axel Rim Trl | 0.41mi | 3/2.0 | 1,850 (-14%) | 1mo | $657,000 | $355 | 54 |
| 14 Peppermill Dr | 0.69mi | 4/2.5 (+1) | 2,084 (-4%) | 7mo | $345,000 | $166 | 51 |
| 92 Pebble Hill Rd | 0.72mi | 3/2.5 | 2,039 (-6%) | 12mo | $440,500 | $216 | 47 |
| 25 Killdeer Ln | 0.50mi | 3/1.5 | 1,912 (-12%) | 10mo | $415,000 | $217 | 45 |
| 93 Matthew Dr | 0.63mi | 4/2.5 (+1) | 1,926 (-11%) | 3mo | $375,000 | $195 | 45 |
| 65 Falling Brook Rd | 0.50mi | 4/2.5 (+1) | 2,417 (+12%) | 13mo | $650,000 | $269 | 42 |
| 64 Misty Pine Rd | 0.73mi | 3/2.5 | 2,279 (+6%) | 19mo | $480,000 | $211 | 41 |
| 19 Ledgemont Dr | 0.67mi | 4/2.5 (+1) | 1,981 (-8%) | 11mo | $462,000 | $233 | 40 |
| 91 Matthew Dr | 0.64mi | 4/2.5 (+1) | 1,914 (-11%) | 17mo | $305,000 | $159 | 32 |
| 10 Norbrook Rd | 0.54mi | 4/3.0 (+1) | 2,406 (+11%) | 20mo | $435,000 | $181 | 32 |
| 12 Center Xing | 0.70mi | 3/2.0 | 1,836 (-15%) | 20mo | $310,000 | $169 | 24 |
Match score weights: distance 35% · size 25% · config 20% · recency 20%. Top-matched comps best support the ARV.
Projected returns pro-forma
-3.0% appreciation · 0.0% rent growth · sell at horizon
- IRR
- -33.7%
- Equity multiple
- -0.06×
- Total profit
- $-89,399
- Equity at exit
- $44,716
- IRR
- -69.0%
- Equity multiple
- -0.76×
- Total profit
- $-147,457
- Equity at exit
- $25,930
Cash invested: $83,972 (down + closing). Projections, not guarantees.
Landlord ↔ Tenant lean methodology
- Overall (STATE)
- 15 Strongly Tenant-Friendly
- State New York
- 15 Strongly Tenant-Friendly · D+10
- County
- — inherits STATE
- City
- — inherits STATE
ZIP-level market 14450
- Rents YoY
- -0.8%
- Active inventory
- 188
- Price-to-rent
- 10.7×
Monthly cashflow live
- Estimated rent
- $2,345 medium interval (Pro) →
- Mortgage (P&I)
- −$1,573
- Tax from tax record
- −$691 /mo · $8,293/yr
- Insurance
- −$125
- HOA
- −$0
- Vacancy / Maint / Mgmt
- −$492
- Net cashflow
- $-536
Break-even live
Sensitivity live
| Price | -10% $-367 | -5% $-451 | +0% $-536 | +5% $-621 | +10% $-706 |
|---|---|---|---|---|---|
| Rent | -10% $-722 | -5% $-629 | +0% $-536 | +5% $-444 | +10% $-351 |
| Rate | -1.0pp $-385 | -0.5pp $-460 | base $-536 | +0.5pp $-614 | +1.0pp $-693 |
UW: 25.0% down · 7.5% · 30yr · 1.5% tax · 5.0% vac · 8.0% maint · 8.0% mgmt
Financing live
Cash to close
- Down payment
- $74,975
- Closing costs
- $8,997
- Reserves months
- —
- Total cash needed
- —
Loan-product check · same deal, 3 products live
Conventional
25% down · 7.5% · 30yr
- Down + closing
- —
- Monthly P&I
- —
- Monthly cashflow
- —
- DSCR
- —
- Eligible?
- —
Personal DTI + credit; lowest rate.
DSCR
20% down · 8.5% · 30yr
- Down + closing
- —
- Monthly P&I
- —
- Monthly cashflow
- —
- DSCR
- —
- Eligible?
- —
No personal income docs; deal must DSCR.
Hard money
10% down · 12.0% · 12mo
- Down + closing
- —
- Monthly P&I
- —
- Monthly cashflow
- —
- DSCR
- —
- Eligible?
- —
Short-term bridge; refi at stabilization.
Listing history 4 events
-
2026-05-15$299,900 Active 1275-char remark
-
2009-03-24soldstatus $188,000
-
2002-07-26soldstatus $158,000
-
2000-10-31soldstatus $150,000
ⓘ Source: listings_history table (triggers on properties + properties_extension) + one-shot
backfill from property_details.listing_events for pre-trigger history.
Tax reassessment forecast NY · Partial reset (capped growth)
- Current annual tax
- $8,293 · $691/mo
- Projected year-2 tax
- $8,293 · $691/mo
- Expected delta
- $0/yr ($0/mo · 0.0%)
ⓘ Screening estimate from a state-policy table — verify with the county assessor before closing.
Climate risk First Street
- Flood 1/10 Low FEMA zone X (unshaded) · 0% chance over 30 yrs
- Wildfire 1/10 Low
- Heat 2/10 Low 7 d/yr ≥96°F today · 16 d/yr by 30 yrs out
- Wind 1/10 Low
- Air quality 2/10 Low 1 unhealthy d/yr today · 1 by 30 yrs out
Nearby sold comps map
Loading sold comps map…
Walkable amenities ~0.75 mi
Loading nearby amenities…
Taxation est. · year 1
- Rental income
- $28,138
- − Mortgage interest
- −$16,799
- − Property taxes
- −$8,293
- − Insurance
- −$1,500
- − Repairs & maintenance
- −$2,251
- − Management
- −$2,251
- − Depreciation
- −$8,724
- Taxable loss
- −$11,680
- Est. tax savings @ 24.0%
- +$2,803
- After-tax cash flow
- $-3,633/yr
For passive investors: Depreciation is non-cash, so a rental often shows a tax loss while cash-flowing — sheltering income. Rental losses are passive: they offset passive income freely, and up to $25,000/yr can offset ordinary (W-2) income if you actively participate and your MAGI is under $100k (phasing out to $0 by $150k); unused losses carry forward. On sale, claimed depreciation is recaptured at up to 25%, and gains may owe capital-gains tax (a 1031 exchange can defer both). Figures are a year-1 estimate at your 24.0% rate — not tax advice; consult a CPA.
Schools (NCES district)
- District
- Fairport Central School District
- NCES district ID
- 3610890
- Math proficiency
- 55% ▼ -16.00%
- Reading proficiency
- 66% ▲ 3.00%
- Median HH income
- $74,981
- Composite
- 53.84/100
- National rank
- #1409
- State rank
- #199 of 590 in NY
Livability — Fairport
- Score
- 74/100
- State rank
- #301
- US rank
- #4847
Category grades
Schools grade is shown separately in the Schools card above.
Census & demographics
- County
- Monroe County · 674,131 people
- City population
- 42,750
- Metro
- Rochester, NY
- Population (ZIP)
- 42,750
- Household income
- $109,466
- Rent vs Own
- Severe rent burden
- 843.0
Population outlook (Monroe County) Hauer SSP2
- Today (2025)
- 759,460 people
- By 2030
- 757,154 · -0.3%
- By 2040
- 740,644 · -2.5%
- By 2050
- 714,443 · -5.9%
- By 2075
- 645,883 · -15.0%
- By 2100
- 547,084 · -28.0%
Race, ethnicity, and origin ACS 2023
- Neighborhood character
- Predominantly White (89%)
- Race & ethnicity
- White 89% Two or more races 5% Hispanic / Latino 3% Asian 2% Black 2%
- Common ancestry
- Romanian 6% Lithuanian 2% Iranian 2%
- Foreign-born
- 6% · Canada, China, South Korea
- Languages at home
- 94% English-only · Other Indo-European 1% Spanish 1% Other Asian/Pacific 1%
Political lean MEDSL · Monroe
- 2024 margin
- D (+19.1) · D 59.5% · R 40.5%
- 2008→2024 swing
- +1.4pp toward D · 2008: 17.7pp · 2024: 19.1pp
- All cycles
- 2024: D+19.1 2020: D+21.0 2016: D+14.1 2012: D+17.4 2008: D+17.7
Not yet ingested
- Civics
- —
Market trends
- HPI YoY
- ▼ -189.56%
- Current HPI
- 270.7329
- Rent YoY
- ▼ -0.84%
- Metro
- Rochester, NY
- State GDP YoY
- ▲ 2.60%
- F500 in state
- 92
Industry mix (Fortune 500 HQ in NY)
| Industry | F500 HQs | Revenue |
|---|---|---|
| Financial Services | 10 | $950B |
|
||
| Consumer Goods | 9 | $162B |
|
||
| Insurance | 4 | $225B |
|
||
| Telecommunications | 2 | $144B |
|
||
| Pharmaceuticals | 2 | $112B |
|
||
| Media / Entertainment | 2 | $69B |
|
||
Price history
+99.9% since first listed5 events — show timeline
- 2026-05-27 Pending — UNYREIS
- 2026-05-15 Listed $299,900 UNYREIS
- 2009-03-24 Sold (Public Records) $188,000 Public Records
- 2002-07-26 Sold (Public Records) $158,000 Public Records
- 2000-10-31 Sold (Public Records) $150,000 Public Records
Property tax history
+2.8%/yrLatest (2025): $8,293 · +10.0% YoY. Source: county tax records.
Cash-flow waterfall
monthlySold comps — $/sqft
last 12 mo · ≤1 miLoading sold comps…