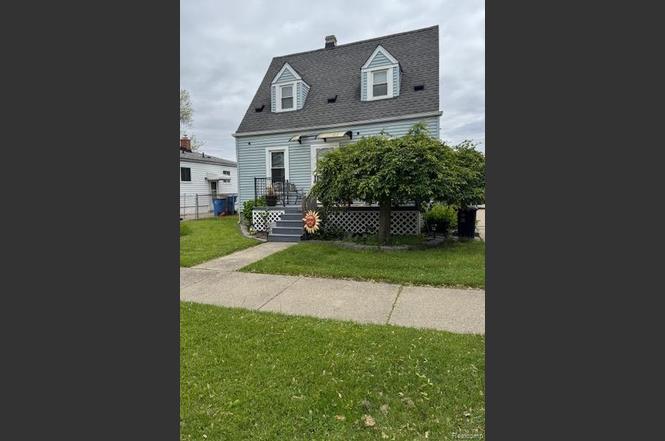
4715 Culver St · Dearborn Heights, MI
Flood risk 5/10 · Moderate
- FEMA flood zone
- X (unshaded)
- Chance of flooding over 30 yrs
- 0.58%
- Est. flood insurance / yr
- $507 – $1,088
Fire risk 1/10 · Minimal
- Est. fire insurance / yr
- $784 – $1,456
Heat risk 3/10 · Minor
- Hot days now (above 98°F)
- 7 days/yr
- Hot days in 30 yrs
- 14 days/yr
Wind risk 2/10 · Minimal
- Chance of severe wind over 30 yrs
- —
Air-quality risk 3/10 · Minor
- Unhealthy air days now
- 2 days/yr
- Unhealthy air days in 30 yrs
- 4 days/yr
Risk factors via First Street. Map © Google.
Why this score? — see what drove the D+ grade
The composite is a weighted blend of 9 inputs, each scored 0–100. Each bar is that input's sub-score; the figure is the points it added to the 100-point composite (weight × sub-score).
- Cash flow +15.8/30.0
- ARV discount +14.0/15.0
- DSCR +4.9/10.0
- 1% rule +4.2/10.0
- Livability +4.0/5.0
- Rent growth +3.0/5.0
- Condition / age +2.5/5.0
- Schools +1.7/10.0
- Appreciation +0.0/10.0
$212,000
🖨 Deal sheet (PDF) 📄 Offer letter ✓ Due diligence
Listing remarks MLS
Super clean and spacious 4 bedrooms 2 full baths, floors are hardwood floors, wiht granite tops, newer furnace, water tank, patio, garage siding, 1920 sqf, first floor bedroom/family room with access to backyard patio, fenced in backyard and driveway, tenant is month to month , possession at closing.
Key facts
- Water tank
- Newer furnace
- Backyard patio
Tags
Property features AI
Exterior
- Parking: Detached 2-car garage
- Utilities: Public water; Public sewer
- Home design: Single-family residence; Two levels; Ground-level entry
- Construction: Aluminum siding
- Exterior features: Paved road access; Lot approximately 0.1 acres (53 x 133)
Interior
- Bathrooms: Two full bathrooms
- Heating & cooling: Forced air heating (natural gas); No central air
- Interior features: Crawl space basement; Five total rooms
Neighborhood map
What this means for you Summary
Snapshot
- This is a 3-bed/1.0-bath single-family listed at $212k.
Deal economics
- At list price, monthly cash flow is $95 ($1k/yr) — positive.
- The deal already cash-flows at list — no discount required.
- To meet the 1% rule (rent ≥ 1% of price), the offer needs to be $196k (7.7% below list).
- Recommended offer: $187k (12.0% below list) — sets the bar for market timing.
- Cap rate 6.8% vs local median 5.5% in Dearborn Heights — meaningfully above typical; check what's discounted (condition, days-on-market, listing class) to confirm the premium yield is real.
Location & tenants
- Location reads 79/100 on livability (#82 in MI, #1,885 nationally) — a middle-class / working-renter tenant base. Strengths: commute A+, cost of living A+, housing A+; Watch: crime D+, employment D+, health & safety D+.
- Dearborn Heights School District #7 (suburban): math 13% / reading 26% proficiency, ranked #466 of 540 in MI (top 86%) — low school quality limits family demand, transient renter base, plan for 1-2y turnover; 60% free/reduced lunch — lower-income household profile, screen leases tightly.
- Zoned schools: Oakley W Best Middle School (math 12% / reading 31%, grade F, #415 of 493 statewide, top 85%, 586 students, 82% FRL); Annapolis High School (math 12% / reading 32%, grade F, #582 of 713 statewide, top 83%, 748 students, 77% FRL) — zoned schools average 79% FRL vs 60% district-wide (19 pts higher); higher-poverty schools than district average — tighter screening recommended.
- Market conditions: Rents rising (+2.0%/yr); 139 active listings in the ZIP; 2 comparable units currently listed for rent nearby; 2,639 units permitted in Wayne County in 2024 (1,216 in 5+ unit buildings).
- This rent runs 39% of the median local income ($60k/yr) — at the standard rent-burdened threshold; future hikes will face affordability resistance.
Forward outlook
- Local home prices are declining (-3.0%/yr); year-one equity from $1k of loan paydown is wiped out by about $6k of value loss. Plan a longer hold.
- Wayne County population projected at -17% by 2050 — secular population decline; favor cash flow + early exit over multi-decade hold.
Negotiation context
- It's been on market 190 days — a 12% lower offer ($187k) is reasonable based on typical stale-listing flexibility.
- 15 sale attempts since 22y ago with the ask held roughly flat each time — persistent listings suggest the price (not the market) is what's stuck; bring a comps-based counter.
- Current owner paid $119k; list at $212k implies a 78% gain — meaningful room to come down on a strong offer.
Risks & watch-outs
- Watch-outs: built in 1937 — expect roof / HVAC / electrical / plumbing capex.
- Climate carrying-cost: moderate flood risk — expect insurance premiums to compound above CPI over the hold.
Questions for the listing agent
- It's been on market 190 days. Have you received any prior offers? Is the seller open to a 12% concession, seller financing, or rate buy-down credit?
- Built in 1937 — when were the roof, HVAC, electrical panel, plumbing, and water heater last replaced?
- Why hasn't it sold? Are there any deal-killer items the seller is aware of (foundation, flood, title, zoning, code violations)?
- Is there a deadline driving the sale (1031 exchange, divorce, estate, relocation)? That informs how much negotiation room exists.
- Crime grade is D in this area — have there been break-ins, vandalism, or insurance claims at this property in the last 3 years? What carrier currently insures it and at what premium?
- The area grade is low — what's the realistic commute time and amenity access for the typical tenant pool here? Any planned neighborhood developments (good or bad) we should know about?
- What's the average days-on-market for RENTAL listings here right now (not sales)? A rising rental-DOM trend means longer vacancies and softer asking-rent achievability than the comps imply.
- What's the recent tenant-quality profile in this submarket — average credit score on applications, eviction rate, late-payment / NSF rate, and stable-employment percentage? A property-management company in the area should have these aggregated.
- How much new for-sale + rental construction is in the pipeline within 1–3 miles? Heavy new supply typically softens prices + rents 12–24 months out; constrained supply supports both.
Investment metrics
- 1% rule
- 0.92% ✗
- Cap rate
- 6.83%
- Cash-on-cash
- 1.92%
- DSCR
- 1.09
- GRM
- 9.0
CMA / ARV
- ARV (on-the-fly)
- $247,680
- Comps found
- 12
Show comp detail 12 sales within ~0.75 mi
| Address | Dist | Beds/Ba | Sqft | Sold | Price | $/sf | Match |
|---|---|---|---|---|---|---|---|
| 4701 Croissant St | 0.12mi | 3/1.0 | 1,768 (-8%) | 1mo | $180,000 | $102 | 80 |
| 3446 Chestnut St | 0.50mi | 3/1.5 | 2,016 (+5%) | 2mo | $240,000 | $119 | 65 |
| 3310 Culver Ave | 0.61mi | 3/1.5 | 1,968 (+2%) | 3mo | $210,000 | $107 | 63 |
| 18657 Audette St | 0.49mi | 3/3.0 | 1,870 (-3%) | 4mo | $300,000 | $160 | 61 |
| 5416 Jackson St | 0.48mi | 3/1.5 | 1,770 (-8%) | 2mo | $221,450 | $125 | 61 |
| 3513 Raymond Ave | 0.47mi | 4/2.5 (+1) | 2,020 (+5%) | 3mo | $291,000 | $144 | 56 |
| 3545 Willow St | 0.47mi | 3/1.5 | 1,691 (-12%) | 1mo | $317,800 | $188 | 56 |
| 2623 Venice St | 0.75mi | 3/2.0 | 1,854 (-3%) | 2mo | $300,000 | $162 | 54 |
| 18015 Audette St | 0.42mi | 3/2.0 | 2,187 (+14%) | 1mo | $255,000 | $117 | 53 |
| 4124 Jackson St | 0.51mi | 4/2.0 (+1) | 1,708 (-11%) | 1mo | $149,900 | $88 | 48 |
| 4212 Huron St | 0.65mi | 4/2.0 (+1) | 2,100 (+9%) | 3mo | $270,000 | $129 | 42 |
| 18723 Audette St | 0.51mi | 4/3.0 (+1) | 2,183 (+14%) | 3mo | $335,000 | $153 | 38 |
Match score weights: distance 35% · size 25% · config 20% · recency 20%. Top-matched comps best support the ARV.
Projected returns pro-forma
-3.0% appreciation · 2.03% rent growth · sell at horizon
- IRR
- -14.3%
- Equity multiple
- 0.49×
- Total profit
- $-30,167
- Equity at exit
- $31,610
- IRR
- -7.2%
- Equity multiple
- 0.56×
- Total profit
- $-25,996
- Equity at exit
- $18,330
Cash invested: $59,360 (down + closing). Projections, not guarantees.
Landlord ↔ Tenant lean methodology
- Overall (STATE)
- 62 Landlord-Friendly
- State Michigan
- 62 Landlord-Friendly · EVEN
- County
- — inherits STATE
- City
- — inherits STATE
ZIP-level market 48125
- Rents YoY
- 2.0%
- Active inventory
- 139
- Price-to-rent
- 9.0×
Monthly cashflow live
- Estimated rent
- $1,956 medium interval (Pro) →
- Mortgage (P&I)
- −$1,112
- Tax from tax record
- −$250 /mo · $3,001/yr
- Insurance
- −$88
- HOA
- −$0
- Vacancy / Maint / Mgmt
- −$411
- Net cashflow
- $95
Break-even live
Sensitivity live
| Price | -10% $215 | -5% $155 | +0% $95 | +5% $35 | +10% $-25 |
|---|---|---|---|---|---|
| Rent | -10% $-59 | -5% $18 | +0% $95 | +5% $172 | +10% $250 |
| Rate | -1.0pp $202 | -0.5pp $149 | base $95 | +0.5pp $40 | +1.0pp $-16 |
UW: 25.0% down · 7.5% · 30yr · 1.5% tax · 5.0% vac · 8.0% maint · 8.0% mgmt
Financing live
Cash to close
- Down payment
- $53,000
- Closing costs
- $6,360
- Reserves months
- —
- Total cash needed
- —
Loan-product check · same deal, 3 products live
Conventional
25% down · 7.5% · 30yr
- Down + closing
- —
- Monthly P&I
- —
- Monthly cashflow
- —
- DSCR
- —
- Eligible?
- —
Personal DTI + credit; lowest rate.
DSCR
20% down · 8.5% · 30yr
- Down + closing
- —
- Monthly P&I
- —
- Monthly cashflow
- —
- DSCR
- —
- Eligible?
- —
No personal income docs; deal must DSCR.
Hard money
10% down · 12.0% · 12mo
- Down + closing
- —
- Monthly P&I
- —
- Monthly cashflow
- —
- DSCR
- —
- Eligible?
- —
Short-term bridge; refi at stabilization.
Rent comps 2 comps
| Address | Beds | Baths | Sqft | Rent | $/sqft | DOM | Units | Dist |
|---|---|---|---|---|---|---|---|---|
| 18535 Audette St Dearborn, MI | 3.0 | 2.0 | 1957 | $2,000 | $1.02 | 0d | 1 | 0.43mi |
| 1829 Walnut St Dearborn, MI | 3.0 | 1.5 | 1752 | $1,800 | $1.03 | 23d | 1 | 0.97mi |
Listing history 50 events
-
2026-06-21days on market $212,000 Active 190 DOM
-
2026-06-18days on market $212,000 Active 187 DOM
-
2026-06-17days on market $212,000 Active 186 DOM
-
2026-06-16days on market $212,000 Active 185 DOM
-
2026-06-15days on market $212,000 Active 184 DOM
-
2026-06-13days on market $212,000 Active 182 DOM
-
2026-06-13days on market $212,000 Active 181 DOM
-
2026-06-09days on market $212,000 Active 178 DOM
-
2026-06-08days on market $212,000 Active 177 DOM
-
2026-06-07days on market $212,000 Active 176 DOM
-
2026-06-04days on market $212,000 Active 173 DOM
-
2026-06-03days on market $212,000 Active 172 DOM
-
2026-06-02days on market $212,000 Active 171 DOM
-
2026-06-01days on market $212,000 Active 170 DOM
-
2026-05-31days on market $212,000 Active 169 DOM
-
2026-03-04price $212,000 301-char remark
Show marketing remark (301 chars)
Super clean and spacious 4 bedrooms 2 full baths, floors are hardwood floors, wiht granite tops, newer furnace, water tank, patio, garage siding, 1920 sqf, first floor bedroom/family room with access to backyard patio, fenced in backyard and driveway, tenant is month to month , possession at closing.
-
2026-03-04price $212,000
Show marketing remark (301 chars)
Super clean and spacious 4 bedrooms 2 full baths, floors are hardwood floors, wiht granite tops, newer furnace, water tank, patio, garage siding, 1920 sqf, first floor bedroom/family room with access to backyard patio, fenced in backyard and driveway, tenant is month to month , possession at closing.
-
2026-03-04status Active 301-char remark
Show marketing remark (301 chars)
Super clean and spacious 4 bedrooms 2 full baths, floors are hardwood floors, wiht granite tops, newer furnace, water tank, patio, garage siding, 1920 sqf, first floor bedroom/family room with access to backyard patio, fenced in backyard and driveway, tenant is month to month , possession at closing.
-
2026-03-04status Active
Show marketing remark (301 chars)
Super clean and spacious 4 bedrooms 2 full baths, floors are hardwood floors, wiht granite tops, newer furnace, water tank, patio, garage siding, 1920 sqf, first floor bedroom/family room with access to backyard patio, fenced in backyard and driveway, tenant is month to month , possession at closing.
-
2026-01-21status Pending 301-char remark
Show marketing remark (301 chars)
Super clean and spacious 4 bedrooms 2 full baths, floors are hardwood floors, wiht granite tops, newer furnace, water tank, patio, garage siding, 1920 sqf, first floor bedroom/family room with access to backyard patio, fenced in backyard and driveway, tenant is month to month , possession at closing.
-
2026-01-21status Pending
Show marketing remark (301 chars)
Super clean and spacious 4 bedrooms 2 full baths, floors are hardwood floors, wiht granite tops, newer furnace, water tank, patio, garage siding, 1920 sqf, first floor bedroom/family room with access to backyard patio, fenced in backyard and driveway, tenant is month to month , possession at closing.
-
2025-11-01$218,000 Active
Show marketing remark (301 chars)
Super clean and spacious 4 bedrooms 2 full baths, floors are hardwood floors, wiht granite tops, newer furnace, water tank, patio, garage siding, 1920 sqf, first floor bedroom/family room with access to backyard patio, fenced in backyard and driveway, tenant is month to month , possession at closing.
-
2025-11-01$218,000 Active 301-char remark
Show marketing remark (301 chars)
Super clean and spacious 4 bedrooms 2 full baths, floors are hardwood floors, wiht granite tops, newer furnace, water tank, patio, garage siding, 1920 sqf, first floor bedroom/family room with access to backyard patio, fenced in backyard and driveway, tenant is month to month , possession at closing.
-
2025-11-01historical
Show marketing remark (301 chars)
Super clean and spacious 4 bedrooms 2 full baths, floors are hardwood floors, wiht granite tops, newer furnace, water tank, patio, garage siding, 1920 sqf, first floor bedroom/family room with access to backyard patio, fenced in backyard and driveway, tenant is month to month , possession at closing.
-
2025-10-24price $218,000
-
2025-10-23price $218,000
-
2025-06-04$238,000 Active
-
2025-06-04$238,000 Active
-
2021-09-16status Pending
-
2021-09-14historical
-
2021-09-14historical
-
2021-08-10$219,900 Active
-
2021-08-10$219,900
-
2018-01-25soldstatus $119,000
-
2018-01-12soldstatus $119,000 Sold
-
2018-01-12soldstatus $119,000 Closed
-
2017-12-18status Pending
-
2017-12-18status Pending
-
2017-12-08price $124,800
-
2017-12-08price $124,800
-
2017-11-04price $124,900
-
2017-11-01price $124,900
-
2017-09-27price $129,600
-
2017-09-26price $129,600
-
2017-09-15$129,700 Active
-
2017-09-15$129,700 Active
-
2017-08-29historical
-
2017-08-29historical
-
2017-07-28price $139,000
ⓘ Source: listings_history table (triggers on properties + properties_extension) + one-shot
backfill from property_details.listing_events for pre-trigger history.
Tax reassessment forecast MI · Partial reset (capped growth)
- Current annual tax
- $3,001 · $250/mo
- Projected year-2 tax
- $3,133 · $261/mo
- Expected delta
- +$132/yr (+$11/mo · 4.4%)
ⓘ Screening estimate from a state-policy table — verify with the county assessor before closing.
Climate risk First Street
- Flood 5/10 Major FEMA zone X (unshaded) · 58% chance over 30 yrs
- Wildfire 1/10 Low
- Heat 3/10 Moderate 7 d/yr ≥98°F today · 14 d/yr by 30 yrs out
- Wind 2/10 Low
- Air quality 3/10 Moderate 2 unhealthy d/yr today · 4 by 30 yrs out
Nearby sold comps map
Loading sold comps map…
Walkable amenities ~0.75 mi
Loading nearby amenities…
Taxation est. · year 1
- Rental income
- $23,472
- − Mortgage interest
- −$11,875
- − Property taxes
- −$3,001
- − Insurance
- −$1,060
- − Repairs & maintenance
- −$1,878
- − Management
- −$1,878
- − Depreciation
- −$6,167
- Taxable loss
- −$2,387
- Est. tax savings @ 24.0%
- +$573
- After-tax cash flow
- $1,714/yr
For passive investors: Depreciation is non-cash, so a rental often shows a tax loss while cash-flowing — sheltering income. Rental losses are passive: they offset passive income freely, and up to $25,000/yr can offset ordinary (W-2) income if you actively participate and your MAGI is under $100k (phasing out to $0 by $150k); unused losses carry forward. On sale, claimed depreciation is recaptured at up to 25%, and gains may owe capital-gains tax (a 1031 exchange can defer both). Figures are a year-1 estimate at your 24.0% rate — not tax advice; consult a CPA.
Schools (NCES district)
- District
- Dearborn Heights School District #7
- NCES district ID
- 2611610
- Math proficiency
- 13% ▼ -10.00%
- Reading proficiency
- 26% ▼ -7.00%
- Median HH income
- $47,468
- Composite
- 17.21/100
- National rank
- #9101
- State rank
- #466 of 540 in MI
Livability — Dearborn Heights
- Score
- 79/100
- State rank
- #82
- US rank
- #1885
Category grades
Schools grade is shown separately in the Schools card above.
Census & demographics
- Census place
- Dearborn Heights, MI
- County
- Wayne County · 1,562,939 people
- City population
- 61,771
- Metro
- Detroit-Warren-Dearborn, MI
- Population (ZIP)
- 22,125
- Household income
- $60,195
- Rent vs Own
- Severe rent burden
- 654.0
Population outlook (Wayne County) Hauer SSP2
- Today (2025)
- 1,675,273 people
- By 2030
- 1,620,300 · -3.3%
- By 2040
- 1,502,341 · -10.3%
- By 2050
- 1,384,039 · -17.4%
- By 2075
- 1,124,592 · -32.9%
- By 2100
- 881,193 · -47.4%
Race, ethnicity, and origin ACS 2023
- Neighborhood character
- Predominantly White (76%)
- Race & ethnicity
- White 76% Black 10% Two or more races 9% Hispanic / Latino 9%
- Hispanic origin (detail)
- Mexican 6%
- Common ancestry
- Romanian 11% Arab 3% Slovak 2%
- Foreign-born
- 11% · Canada
- Languages at home
- 82% English-only · Arabic 13% Spanish 3% Russian/Polish/Slavic 1%
Political lean MEDSL · Wayne
- 2024 margin
- Strong D (+29.0) · D 62.7% · R 33.7% · Other 3.6%
- 2008→2024 swing
- -20.5pp toward R · 2008: 49.5pp · 2024: 29.0pp
- All cycles
- 2024: D+29.0 2020: D+38.1 2016: D+37.3 2012: D+46.9 2008: D+49.5
Not yet ingested
- Civics
- —
Market trends
- HPI YoY
- ▼ -214.70%
- Current HPI
- 218.4698
- Rent YoY
- ▲ 2.03%
- Metro
- Detroit-Warren-Dearborn, MI
- State GDP YoY
- ▲ 1.37%
- F500 in state
- 28
Industry mix (Fortune 500 HQ in MI)
| Industry | F500 HQs | Revenue |
|---|---|---|
| Automotive Parts | 3 | $48B |
|
||
| Automotive | 2 | $372B |
|
||
| Chemicals | 1 | $45B |
|
||
| Automotive Retail | 1 | $29B |
|
||
| Healthcare / Medical Devices | 1 | $23B |
|
||
| Automotive Technology | 1 | $20B |
|
||
Price history
+21.2% since first listed44 events — show timeline
- 2026-03-04 Price Changed $212,000 MiRealSource-MiMLS
- 2026-03-04 Price Changed $212,000 REALCOMP
- 2026-03-04 Relisted — MiRealSource-MiMLS
- 2026-03-04 Relisted — REALCOMP
- 2026-01-21 Pending — MiRealSource-MiMLS
- 2026-01-21 Pending — REALCOMP
- 2025-11-01 Listed $218,000 REALCOMP
- 2025-11-01 Listing Removed — REALCOMP
- 2025-11-01 Listing Removed — MiRealSource-MiMLS
- 2025-11-01 Listed $218,000 MiRealSource-MiMLS
- 2025-10-24 Price Changed $218,000 MiRealSource-MiMLS
- 2025-10-23 Price Changed $218,000 REALCOMP
- 2025-06-04 Listed $238,000 REALCOMP
- 2025-06-04 Listed $238,000 MiRealSource-MiMLS
- 2021-09-16 Pending — MiRealSource-MiMLS
- 2021-09-14 Listing Removed — REALCOMP
- 2021-09-14 Listing Removed — MiRealSource-MiMLS
- 2021-08-10 Listed $219,900 REALCOMP
- 2021-08-10 Listed $219,900 MiRealSource-MiMLS
- 2018-01-25 Sold (Public Records) $119,000 Public Records
- 2018-01-12 Sold (MLS) $119,000 MiRealSource-MiMLS
- 2018-01-12 Sold (MLS) $119,000 REALCOMP
- 2017-12-18 Pending — MiRealSource-MiMLS
- 2017-12-18 Pending — REALCOMP
- 2017-12-08 Price Changed $124,800 MiRealSource-MiMLS
- 2017-12-08 Price Changed $124,800 REALCOMP
- 2017-11-04 Price Changed $124,900 MiRealSource-MiMLS
- 2017-11-01 Price Changed $124,900 REALCOMP
- 2017-09-27 Price Changed $129,600 MiRealSource-MiMLS
- 2017-09-26 Price Changed $129,600 REALCOMP
- 2017-09-15 Listed $129,700 MiRealSource-MiMLS
- 2017-09-15 Listed $129,700 REALCOMP
- 2017-08-29 Listing Removed — REALCOMP
- 2017-08-29 Listing Removed — MiRealSource-MiMLS
- 2017-07-28 Price Changed $139,000 MiRealSource-MiMLS
- 2017-07-27 Price Changed $139,000 REALCOMP
- 2017-05-11 Listed $140,000 MiRealSource-MiMLS
- 2017-05-11 Listed $140,000 REALCOMP
- 2005-07-30 Listing Removed — REALCOMP
- 2005-05-03 Listing Removed — REALCOMP
- 2005-05-03 Listed $169,900 REALCOMP
- 2005-04-01 Listed $174,900 REALCOMP
- 2004-07-14 Listing Removed — REALCOMP
- 2004-04-06 Listed $174,900 REALCOMP
Property tax history
+3.3%/yrLatest (2025): $3,001 · -9.2% YoY. Source: county tax records.
Cash-flow waterfall
monthlySold comps — $/sqft
last 12 mo · ≤1 miLoading sold comps…