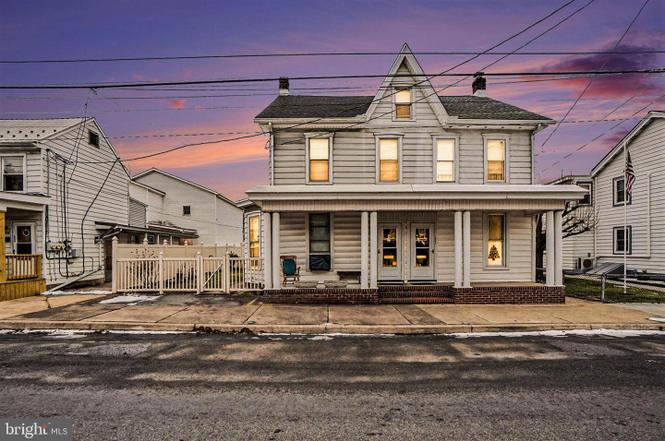
534 Main St · Lykens, PA
Flood risk 9/10 · Severe
- FEMA flood zone
- X (shaded)
- Chance of flooding over 30 yrs
- 0.99%
- Est. flood insurance / yr
- $473 – $860
Fire risk 3/10 · Minor
- Est. fire insurance / yr
- $511 – $949
Heat risk 5/10 · Moderate
- Hot days now (above 95°F)
- 8 days/yr
- Hot days in 30 yrs
- 17 days/yr
Wind risk 2/10 · Minimal
- Chance of severe wind over 30 yrs
- 4.0%
Air-quality risk 2/10 · Minimal
- Unhealthy air days now
- 1 days/yr
- Unhealthy air days in 30 yrs
- 2 days/yr
Risk factors via First Street. Map © Google.
Why this score? — see what drove the B+ grade
The composite is a weighted blend of 9 inputs, each scored 0–100. Each bar is that input's sub-score; the figure is the points it added to the 100-point composite (weight × sub-score).
- Cash flow +27.8/30.0
- ARV discount +15.0/15.0
- DSCR +9.8/10.0
- 1% rule +7.3/10.0
- Appreciation +4.8/10.0
- Schools +3.9/10.0
- Livability +3.4/5.0
- Rent growth +2.5/5.0
- Condition / age +2.5/5.0
$138,500
🖨 Deal sheet (PDF) 📄 Offer letter ✓ Due diligence
Listing remarks MLS
REDUCED TO $61,900!! VERY AFFORDABLE SEMI IN DOWN TOWN LYKENS. HOME WITH TONS OF OLD WORLD CHARM AND CHARACTER. FEATURES: DOUBLE LIVING ROOM, FLORIDA ROOM, FORMAL DINING ROOM W/ FANTASTIC BUILT-INS AND MOLDING, EAT IN KITCHEN, ENCLOSED SCREENED BACK PORCH, AND 2 CAR GARAGE WITH ALLEY ENTRANCE. VERY NICE, LARGE FENCED REAR YARD. ALL APPLIANCES/W & D CONVEY PLUS A 1 YR HOME WARRANTY. ROOF OVER KITCHEN/SCREEN PORCH JUST REPLACED.
Key facts
- 2 garage spots
- Built 1899
- Listed 70 days
Neighborhood map
What this means for you Summary
Snapshot
- This is a 4-bed/1.5-bath single-family listed at $138k.
Deal economics
- At list price, monthly cash flow is $365 ($4k/yr) — positive.
- The deal already cash-flows at list — no discount required.
- Meets the 1% rule at list price ($2k rent vs $138k).
- Recommended offer: $130k (6.0% below list) — sets the bar for market timing.
Location & tenants
- Location reads 67/100 on livability (#969 in PA) — a middle-class / working-renter tenant base. Strengths: crime A+, cost of living A+, housing A+; Watch: amenities F, commute F, employment D-.
- Upper Dauphin Area SD (rural): math 37% / reading 55% proficiency, ranked #259 of 539 in PA (top 48%) — families likely to look elsewhere, expect single-tenant / working-renter base with shorter leases.
- Zoned schools: Upper Dauphin Area El Sch (math 42% / reading 62%, grade C-, #586 of 1,518 statewide, top 42%, 399 students, 52% FRL); Upper Dauphin Area Ms (math 25% / reading 52%, grade F, #275 of 512 statewide, top 55%, 312 students, 48% FRL); Upper Dauphin Area Hs (math 77%, 343 students, 47% FRL) — zoned schools average 49% FRL vs 32% district-wide (17 pts higher); higher-poverty schools than district average — tighter screening recommended.
- Market conditions: 26 active listings in the ZIP; 540 units permitted in Dauphin County in 2024 (194 in 5+ unit buildings).
Forward outlook
- In year one you build about $292 of equity ($958 loan paydown + $-666 appreciation (-0.5% local appreciation)).
- At projected returns (-0.5% appreciation + 3.0% rent growth), your $39k cash investment doubles in ~7 years — after that, you're playing with house money.
Negotiation context
- It's been on market 70 days — a 6% lower offer ($130k) is reasonable based on typical stale-listing flexibility.
- 3 sale attempts since 13y ago with the ask held roughly flat each time — persistent listings suggest the price (not the market) is what's stuck; bring a comps-based counter.
- Current owner paid $60k; list at $138k implies a 131% gain — meaningful room to come down on a strong offer.
Risks & watch-outs
- Watch-outs: flood insurance adds $56/mo; built in 1899 — expect roof / HVAC / electrical / plumbing capex.
- Climate carrying-cost: severe flood risk; extreme-heat days projected 8→17/yr by 2055 (HVAC capex compounding) — expect insurance premiums to compound above CPI over the hold.
Questions for the listing agent
- It's been on market 70 days. Have you received any prior offers? Is the seller open to a 6% concession, seller financing, or rate buy-down credit?
- Built in 1899 — when were the roof, HVAC, electrical panel, plumbing, and water heater last replaced?
- What's the actual annual flood-insurance premium (NFIP or private), and is the property in a SFHA with mandatory coverage?
- Why hasn't it sold? Are there any deal-killer items the seller is aware of (foundation, flood, title, zoning, code violations)?
- Is there a deadline driving the sale (1031 exchange, divorce, estate, relocation)? That informs how much negotiation room exists.
- Schools are D-rated, which usually means shorter tenancies and higher turnover. Who's the typical renter profile here, and what's been the actual vacancy rate?
- What's the average days-on-market for RENTAL listings here right now (not sales)? A rising rental-DOM trend means longer vacancies and softer asking-rent achievability than the comps imply.
- What's the recent tenant-quality profile in this submarket — average credit score on applications, eviction rate, late-payment / NSF rate, and stable-employment percentage? A property-management company in the area should have these aggregated.
- How much new for-sale + rental construction is in the pipeline within 1–3 miles? Heavy new supply typically softens prices + rents 12–24 months out; constrained supply supports both.
Investment metrics
- 1% rule
- 1.23% ✓
- Cap rate
- 9.93%
- Cash-on-cash
- 13.01%
- DSCR
- 1.58
- GRM
- 6.8
CMA / ARV
- ARV (on-the-fly)
- $176,000
- Comps found
- 11
Show comp detail 11 sales within ~0.75 mi
| Address | Dist | Beds/Ba | Sqft | Sold | Price | $/sf | Match |
|---|---|---|---|---|---|---|---|
| 433 S 2nd St | 0.13mi | 4/2.0 | 1,598 (-0%) | 7mo | $154,500 | $97 | 86 |
| 454 S 2nd St | 0.10mi | 3/2.0 (-1) | 1,596 (-0%) | 10mo | $174,900 | $110 | 79 |
| 422 North St | 0.20mi | 3/2.0 (-1) | 1,636 (+2%) | 2mo | $287,000 | $175 | 78 |
| 711 Main St | 0.30mi | 4/1.5 | 1,664 (+4%) | 4mo | $222,000 | $133 | 76 |
| 767 Main St | 0.42mi | 3/1.5 (-1) | 1,603 (+0%) | 11mo | $120,000 | $75 | 66 |
| 312 Center St | 0.65mi | 3/1.5 (-1) | 1,575 (-2%) | 1mo | $228,100 | $145 | 61 |
| 247 North St | 0.35mi | 4/1.0 | 1,720 (+8%) | 22mo | $187,000 | $109 | 50 |
| 342 Railroad St | 0.44mi | 3/2.0 (-1) | 1,728 (+8%) | 14mo | $260,000 | $150 | 48 |
| 183 Pottsville St | 0.67mi | 3/1.5 (-1) | 1,714 (+7%) | 16mo | $190,000 | $111 | 38 |
| 307 Pottsville St | 0.74mi | 3/1.0 (-1) | 1,780 (+11%) | 9mo | $140,900 | $79 | 32 |
| 217 Walnut St | 0.67mi | 3/1.0 (-1) | 1,744 (+9%) | 21mo | $85,000 | $49 | 29 |
Match score weights: distance 35% · size 25% · config 20% · recency 20%. Top-matched comps best support the ARV.
Projected returns pro-forma
-0.48% appreciation · 3.0% rent growth · sell at horizon
- IRR
- 9.0%
- Equity multiple
- 1.42×
- Total profit
- $16,122
- Equity at exit
- $36,916
- IRR
- 14.5%
- Equity multiple
- 2.52×
- Total profit
- $58,868
- Equity at exit
- $41,820
Cash invested: $38,780 (down + closing). Projections, not guarantees.
Landlord ↔ Tenant lean methodology
- Overall (STATE)
- 62 Landlord-Friendly
- State Pennsylvania
- 62 Landlord-Friendly · EVEN
- County
- — inherits STATE
- City
- — inherits STATE
ZIP-level market 17048
- Home prices YoY
- -0.2%
- Active inventory
- 26
- Price-to-rent
- 6.8×
Monthly cashflow live
- Estimated rent
- $1,707 medium interval (Pro) →
- Mortgage (P&I)
- −$726
- Tax from tax record
- −$144 /mo · $1,728/yr
- Insurance
- −$58
- Flood insurance flood zone
- −$56 /mo · $666/yr
- HOA
- −$0
- Vacancy / Maint / Mgmt
- −$358
- Net cashflow
- $365
Break-even live
Sensitivity live
| Price | -10% $443 | -5% $404 | +0% $365 | +5% $326 | +10% $286 |
|---|---|---|---|---|---|
| Rent | -10% $230 | -5% $297 | +0% $365 | +5% $432 | +10% $500 |
| Rate | -1.0pp $435 | -0.5pp $400 | base $365 | +0.5pp $329 | +1.0pp $292 |
UW: 25.0% down · 7.5% · 30yr · 1.5% tax · 5.0% vac · 8.0% maint · 8.0% mgmt
Financing live
Cash to close
- Down payment
- $34,625
- Closing costs
- $4,155
- Reserves months
- —
- Total cash needed
- —
Loan-product check · same deal, 3 products live
Conventional
25% down · 7.5% · 30yr
- Down + closing
- —
- Monthly P&I
- —
- Monthly cashflow
- —
- DSCR
- —
- Eligible?
- —
Personal DTI + credit; lowest rate.
DSCR
20% down · 8.5% · 30yr
- Down + closing
- —
- Monthly P&I
- —
- Monthly cashflow
- —
- DSCR
- —
- Eligible?
- —
No personal income docs; deal must DSCR.
Hard money
10% down · 12.0% · 12mo
- Down + closing
- —
- Monthly P&I
- —
- Monthly cashflow
- —
- DSCR
- —
- Eligible?
- —
Short-term bridge; refi at stabilization.
Listing history 10 events
-
2026-03-20status Pending
-
2026-01-19price $138,500
-
2026-01-10$140,000 Active
-
2026-01-09historical $140,000
-
2015-05-04soldstatus $60,000
-
2015-04-30soldstatus $60,000 436-char remark
Show marketing remark (436 chars)
REDUCED TO $61,900!! VERY AFFORDABLE SEMI IN DOWN TOWN LYKENS. HOME WITH TONS OF OLD WORLD CHARM AND CHARACTER. FEATURES: DOUBLE LIVING ROOM, FLORIDA ROOM, FORMAL DINING ROOM W/ FANTASTIC BUILT-INS AND MOLDING, EAT IN KITCHEN, ENCLOSED SCREENED BACK PORCH, AND 2 CAR GARAGE WITH ALLEY ENTRANCE. VERY NICE, LARGE FENCED REAR YARD. ALL APPLIANCES/W & D CONVEY PLUS A 1 YR HOME WARRANTY. ROOF OVER KITCHEN/SCREEN PORCH JUST REPLACED.
-
2015-03-18historical 436-char remark
Show marketing remark (436 chars)
REDUCED TO $61,900!! VERY AFFORDABLE SEMI IN DOWN TOWN LYKENS. HOME WITH TONS OF OLD WORLD CHARM AND CHARACTER. FEATURES: DOUBLE LIVING ROOM, FLORIDA ROOM, FORMAL DINING ROOM W/ FANTASTIC BUILT-INS AND MOLDING, EAT IN KITCHEN, ENCLOSED SCREENED BACK PORCH, AND 2 CAR GARAGE WITH ALLEY ENTRANCE. VERY NICE, LARGE FENCED REAR YARD. ALL APPLIANCES/W & D CONVEY PLUS A 1 YR HOME WARRANTY. ROOF OVER KITCHEN/SCREEN PORCH JUST REPLACED.
-
2014-06-25$61,900 436-char remark
Show marketing remark (436 chars)
REDUCED TO $61,900!! VERY AFFORDABLE SEMI IN DOWN TOWN LYKENS. HOME WITH TONS OF OLD WORLD CHARM AND CHARACTER. FEATURES: DOUBLE LIVING ROOM, FLORIDA ROOM, FORMAL DINING ROOM W/ FANTASTIC BUILT-INS AND MOLDING, EAT IN KITCHEN, ENCLOSED SCREENED BACK PORCH, AND 2 CAR GARAGE WITH ALLEY ENTRANCE. VERY NICE, LARGE FENCED REAR YARD. ALL APPLIANCES/W & D CONVEY PLUS A 1 YR HOME WARRANTY. ROOF OVER KITCHEN/SCREEN PORCH JUST REPLACED.
-
2014-05-18historical
-
2013-11-18$82,000
ⓘ Source: listings_history table (triggers on properties + properties_extension) + one-shot
backfill from property_details.listing_events for pre-trigger history.
Tax reassessment forecast PA · Partial reset (capped growth)
- Current annual tax
- $1,728 · $144/mo
- Projected year-2 tax
- $1,958 · $163/mo
- Expected delta
- +$230/yr (+$19/mo · 13.3%)
ⓘ Screening estimate from a state-policy table — verify with the county assessor before closing.
Climate risk First Street
- Flood 9/10 Extreme FEMA zone X (shaded) · 99% chance over 30 yrs
- Wildfire 3/10 Moderate
- Heat 5/10 Major 8 d/yr ≥95°F today · 17 d/yr by 30 yrs out
- Wind 2/10 Low 4% chance of damaging wind over 30 yrs
- Air quality 2/10 Low 1 unhealthy d/yr today · 2 by 30 yrs out
Nearby sold comps map
Loading sold comps map…
Walkable amenities ~0.75 mi
Loading nearby amenities…
Taxation est. · year 1
- Rental income
- $20,481
- − Mortgage interest
- −$7,758
- − Property taxes
- −$1,728
- − Insurance
- −$1,359
- − Repairs & maintenance
- −$1,638
- − Management
- −$1,638
- − Depreciation
- −$4,029
- Taxable income
- $2,330
- Est. tax owed @ 24.0%
- −$559
- After-tax cash flow
- $3,818/yr
For passive investors: Depreciation is non-cash, so a rental often shows a tax loss while cash-flowing — sheltering income. Rental losses are passive: they offset passive income freely, and up to $25,000/yr can offset ordinary (W-2) income if you actively participate and your MAGI is under $100k (phasing out to $0 by $150k); unused losses carry forward. On sale, claimed depreciation is recaptured at up to 25%, and gains may owe capital-gains tax (a 1031 exchange can defer both). Figures are a year-1 estimate at your 24.0% rate — not tax advice; consult a CPA.
Schools (NCES district)
- District
- Upper Dauphin Area SD
- NCES district ID
- 4224360
- Math proficiency
- 37% ▼ -3.00%
- Reading proficiency
- 55% ▼ -8.00%
- Median HH income
- $48,201
- Composite
- 39.23/100
- National rank
- #4012
- State rank
- #259 of 539 in PA
Livability — Lykens
- Score
- 67/100
- State rank
- #969
- US rank
- #10571
Category grades
Schools grade is shown separately in the Schools card above.
Census & demographics
- Census place
- Lykens, PA
- Population (ZIP)
- 3,801
Population outlook (Dauphin County) Hauer SSP2
- Today (2025)
- 281,628 people
- By 2030
- 283,549 · +0.7%
- By 2040
- 285,385 · +1.3%
- By 2050
- 286,188 · +1.6%
- By 2075
- 291,053 · +3.3%
- By 2100
- 282,374 · +0.3%
Race, ethnicity, and origin ACS 2023
- Neighborhood character
- Predominantly White (88%)
- Race & ethnicity
- White 88% Two or more races 8% Hispanic / Latino 2% Asian 2%
- Common ancestry
- Polish 4% Romanian 3% Iranian 3%
- Foreign-born
- 1% · Canada, India
- Languages at home
- 88% English-only · German/W. Germanic 10% Spanish 2%
Political lean MEDSL · Dauphin
- 2024 margin
- Lean D (+5.9) · D 52.4% · R 46.5% · Other 1.1%
- 2008→2024 swing
- -3.1pp toward R · 2008: 9.1pp · 2024: 5.9pp
- All cycles
- 2024: D+5.9 2020: D+8.5 2016: D+2.8 2012: D+6.0 2008: D+9.1
Not yet ingested
- Civics
- —
Market trends
- HPI YoY
- ▼ -0.48%
- Current HPI
- 241.7628
- Rent YoY
- —
- Metro
- —
- State GDP YoY
- ▲ 1.68%
- F500 in state
- 34
Industry mix (Fortune 500 HQ in PA)
| Industry | F500 HQs | Revenue |
|---|---|---|
| Healthcare | 2 | $309B |
|
||
| Insurance | 2 | $27B |
|
||
| Telecommunications / Media | 1 | $124B |
|
||
| Industrial Distribution | 1 | $22B |
|
||
| Financial Services | 1 | $20B |
|
||
| Chemicals / Materials | 1 | $18B |
|
||
Price history
+68.9% since first listed10 events — show timeline
- 2026-03-20 Pending — BRIGHT MLS
- 2026-01-19 Price Changed $138,500 BRIGHT MLS
- 2026-01-10 Listed $140,000 BRIGHT MLS
- 2026-01-09 Coming Soon $140,000 BRIGHT MLS
- 2015-05-04 Sold (Public Records) $60,000 Public Records
- 2015-04-30 Sold (MLS) $60,000 BRIGHT MLS
- 2015-03-18 Listing Removed — BRIGHT MLS
- 2014-06-25 Listed $61,900 BRIGHT MLS
- 2014-05-18 Listing Removed — BRIGHT MLS
- 2013-11-18 Listed $82,000 BRIGHT MLS
Property tax history
+2.2%/yrLatest (2026): $1,728 · +5.6% YoY. Source: county tax records.
Cash-flow waterfall
monthlySold comps — $/sqft
last 12 mo · ≤1 miLoading sold comps…