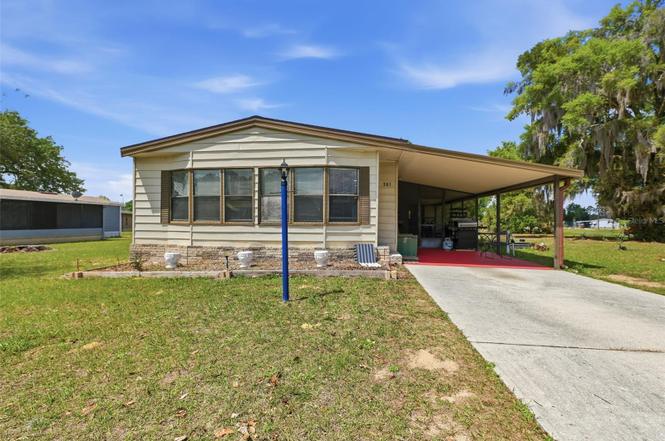
361 Wade Park Ct · Four Corners, FL
Flood risk 1/10 · Minimal
- FEMA flood zone
- X (unshaded)
- Chance of flooding over 30 yrs
- 0.0%
- Est. flood insurance / yr
- $507 – $1,088
Fire risk 6/10 · Moderate
- Est. fire insurance / yr
- $947 – $1,759
Heat risk 8/10 · Major
- Hot days now (above 107°F)
- 7 days/yr
- Hot days in 30 yrs
- 24 days/yr
Wind risk 9/10 · Severe
- Chance of severe wind over 30 yrs
- 99.0%
Air-quality risk 1/10 · Minimal
- Unhealthy air days now
- 0 days/yr
- Unhealthy air days in 30 yrs
- 0 days/yr
Risk factors via First Street. Map © Google.
Why this score? — see what drove the C- grade
The composite is a weighted blend of 9 inputs, each scored 0–100. Each bar is that input's sub-score; the figure is the points it added to the 100-point composite (weight × sub-score).
- Cash flow +18.2/30.0
- ARV discount +7.5/15.0
- DSCR +5.7/10.0
- 1% rule +5.2/10.0
- Appreciation +4.7/10.0
- Schools +3.5/10.0
- Livability +3.5/5.0
- Condition / age +2.5/5.0
- Rent growth +1.8/5.0
$179,900
🖨 Deal sheet (PDF) 📄 Offer letter ✓ Due diligence
Listing remarks
Under contract-accepting backup offers. * * Professional Photos Coming Soon * * Come see this lovely, updated 2-bedroom, 2-bath home on a huge corner lot in the desirable 55+ Polo Park community in Davenport. Recent improvements include laminate flooring throughout (no carpet), new kitchen cabinets and countertops, new appliances, updated bathrooms, fresh interior paint, a new roof (2024), and AC replaced in 2021. Enjoy the added benefit of owning the land with NO lot rent, NO CDD, and a low HOA of just $70 per month. Polo Park offers a vibrant and active lifestyle with two clubhouses, two pools, tennis courts, pickleball courts, bocce ball, horseshoe pits, and countless clubs and social
Key facts
- Laminate flooring
- New kitchen cabinets
- New appliances
Tags
Neighborhood map
What this means for you Summary
Snapshot
- This is a 2-bed/2.0-bath manufactured listed at $180k.
Deal economics
- At list price, monthly cash flow is $161 ($2k/yr) — positive.
- The deal already cash-flows at list — no discount required.
- Meets the 1% rule at list price ($2k rent vs $180k).
- Recommended offer: $177k (1.5% below list) — sets the bar for market timing.
- Cap rate 7.4% vs local median 3.2% in Four Corners — top-decile yield for the area; either an underpriced asset or a hidden risk that comps aren't pricing in. Stress-test before assuming the spread holds.
Location & tenants
- Location reads 69/100 on livability (#453 in FL) — a middle-class / working-renter tenant base. Strengths: housing A+, cost of living A-; Watch: schools F, amenities F, health & safety F.
- Polk (suburban): math 39% / reading 43% proficiency, ranked #62 of 73 in FL (top 85%) — families likely to look elsewhere, expect single-tenant / working-renter base with shorter leases.
- Market conditions: Rents soft (-2.7%/yr); 646 active listings in the ZIP; 38 comparable units currently listed for rent nearby; rentals at typical pace (median 24d on market — plan ~3-4 weeks tenant-placement turnaround); 10,384 units permitted in Polk County in 2024 (1,716 in 5+ unit buildings).
- This rent runs 31% of the median local income ($71k/yr) — at the standard rent-burdened threshold; future hikes will face affordability resistance.
Forward outlook
- In year one you build about $148 of equity ($1k loan paydown + $-1k appreciation (-0.6% local appreciation)).
- Polk County population projected at +33% by 2050 — long-run rental-demand tailwind backs the buy-and-hold thesis.
Negotiation context
- It's been on market 18 days — a 2% lower offer ($177k) is reasonable based on typical stale-listing flexibility.
- 2 sale attempts with the ask held roughly flat each time — persistent listings suggest the price (not the market) is what's stuck; bring a comps-based counter.
Risks & watch-outs
- Climate carrying-cost: severe wind risk, 99% chance of damaging wind over 30y; major wildfire risk; extreme-heat days projected 7→24/yr by 2055 (HVAC capex compounding) — expect insurance premiums to compound above CPI over the hold.
Questions for the listing agent
- What does the HOA fee cover, when was the last increase, and are there any pending special assessments or reserve-fund shortfalls?
- Is there a deadline driving the sale (1031 exchange, divorce, estate, relocation)? That informs how much negotiation room exists.
- Schools are F-rated, which usually means shorter tenancies and higher turnover. Who's the typical renter profile here, and what's been the actual vacancy rate?
- What's the average days-on-market for RENTAL listings here right now (not sales)? A rising rental-DOM trend means longer vacancies and softer asking-rent achievability than the comps imply.
- What's the recent tenant-quality profile in this submarket — average credit score on applications, eviction rate, late-payment / NSF rate, and stable-employment percentage? A property-management company in the area should have these aggregated.
- How much new for-sale + rental construction is in the pipeline within 1–3 miles? Heavy new supply typically softens prices + rents 12–24 months out; constrained supply supports both.
Investment metrics
- 1% rule
- 1.02% ✓
- Cap rate
- 7.37%
- Cash-on-cash
- 3.83%
- DSCR
- 1.17
- GRM
- 8.2
CMA / ARV
No comps found within radius.
Projected returns pro-forma
-0.61% appreciation · 0.0% rent growth · sell at horizon
- IRR
- -2.4%
- Equity multiple
- 0.89×
- Total profit
- $-5,433
- Equity at exit
- $46,825
- IRR
- 1.3%
- Equity multiple
- 1.12×
- Total profit
- $5,894
- Equity at exit
- $52,130
Cash invested: $50,372 (down + closing). Projections, not guarantees.
Landlord ↔ Tenant lean methodology
- Overall (STATE)
- 87 Strongly Landlord-Friendly
- State Florida
- 87 Strongly Landlord-Friendly · R+3
- County
- — inherits STATE
- City
- — inherits STATE
ZIP-level market 33897
- Home prices YoY
- -0.3%
- Rents YoY
- -2.7%
- Active inventory
- 646
- Price-to-rent
- 8.2×
Monthly cashflow live
- Estimated rent
- $1,837 high interval (Pro) →
- Mortgage (P&I)
- −$943
- Tax from tax record
- −$202 /mo · $2,424/yr
- Insurance
- −$75
- HOA
- −$70
- Vacancy / Maint / Mgmt
- −$386
- Net cashflow
- $161
Break-even live
Sensitivity live
| Price | -10% $263 | -5% $212 | +0% $161 | +5% $110 | +10% $59 |
|---|---|---|---|---|---|
| Rent | -10% $16 | -5% $88 | +0% $161 | +5% $233 | +10% $306 |
| Rate | -1.0pp $251 | -0.5pp $207 | base $161 | +0.5pp $114 | +1.0pp $67 |
UW: 25.0% down · 7.5% · 30yr · 1.5% tax · 5.0% vac · 8.0% maint · 8.0% mgmt
Financing live
Cash to close
- Down payment
- $44,975
- Closing costs
- $5,397
- Reserves months
- —
- Total cash needed
- —
Loan-product check · same deal, 3 products live
Conventional
25% down · 7.5% · 30yr
- Down + closing
- —
- Monthly P&I
- —
- Monthly cashflow
- —
- DSCR
- —
- Eligible?
- —
Personal DTI + credit; lowest rate.
DSCR
20% down · 8.5% · 30yr
- Down + closing
- —
- Monthly P&I
- —
- Monthly cashflow
- —
- DSCR
- —
- Eligible?
- —
No personal income docs; deal must DSCR.
Hard money
10% down · 12.0% · 12mo
- Down + closing
- —
- Monthly P&I
- —
- Monthly cashflow
- —
- DSCR
- —
- Eligible?
- —
Short-term bridge; refi at stabilization.
Rent comps 38 comps
| Address | Beds | Baths | Sqft | Rent | $/sqft | DOM | Units | Dist |
|---|---|---|---|---|---|---|---|---|
| 232 Nesbitt Park Ave Davenport, FL | 2.0 | 2.0 | 864 | $1,325 | $1.53 | 24d | 1 | 0.18mi |
| 623 Coconut Palm Way Davenport, FL | 3.0 | 2.0 | 1100 | $1,650 | $1.50 | 24d | 1 | 0.21mi |
| 400 Australian Way Unit A Davenport, FL | 3.0 | 2.0 | 1350 | $1,600 | $1.19 | 15d | 1 | 0.25mi |
| 1000 Western Breeze CIR Unit 3-410 Davenport, FL | 2.0 | 2.0 | 1185 | $2,360 | $1.99 | 4d | 1 | 0.29mi |
| 217 Australian Way Unit A Davenport, FL | 3.0 | 2.0 | 1211 | $1,750 | $1.45 | 3d | 1 | 0.30mi |
| 130 Orlando Breeze Cir Davenport, FL | 1.0–3.0 | 1.0–2.0 | 1022 | $2,097 | $2.05 | 15d | 21 | 0.30mi |
| 2929 Fan Palm Dr Unit 1 Davenport, FL | 3.0 | 2.5 | 1090 | $1,600 | $1.47 | 15d | 1 | 0.33mi |
| 2929 Fan Palm Dr Davenport, FL | 3.0 | 3.0 | 1090 | $1,600 | $1.47 | 15d | 1 | 0.33mi |
| 2918 Fan Palm Dr Unit Main Davenport, FL | 3.0 | 2.0 | 1400 | $1,800 | $1.29 | 24d | 1 | 0.34mi |
| 223 Washington Palm Loop Unit B Davenport, FL | 1.0 | 1.0 | 745 | $1,000 | $1.34 | 24d | 1 | 0.35mi |
| 1000 Western Breeze Cir Davenport, FL | 1.0–3.0 | 1.0–2.0 | 1350 | $2,448 | $1.81 | 15d | 83 | 0.35mi |
| 631 Washington Palm Loop Davenport, FL | 3.0 | 2.0 | 1387 | $1,450 | $1.05 | 24d | 1 | 0.37mi |
| 601 Washington Palm Loop Unit B Davenport, FL | 1.0 | 1.0 | 800 | $1,100 | $1.38 | 24d | 1 | 0.37mi |
| 1623 Fan Palm Dr Davenport, FL | 3.0 | 2.5 | 1451 | $1,950 | $1.34 | 4d | 1 | 0.43mi |
| 218 Langford Park Dr Davenport, FL | 3.0 | 2.0 | 1479 | $2,100 | $1.42 | 24d | 1 | 0.56mi |
| 315 Allison Ave Davenport, FL | 3.0 | 2.0 | 1180 | $2,400 | $2.03 | 24d | 1 | 0.59mi |
| 1000 Ketner St Davenport, FL | 1.0–3.0 | 1.0–2.0 | 1057 | $1,746 | $1.65 | 4d | 22 | 0.70mi |
| 50989 Highway 27 #108 Davenport, FL | 2.0 | 1.0 | 800 | $1,500 | $1.88 | 22d | 1 | 0.75mi |
| 2010 Limetta DR Davenport, FL | 1.0–3.0 | 1.0–2.0 | 1178 | $1,970 | $1.67 | 4d | 15 | 0.76mi |
| 309 Catfish Dr E Davenport, FL | 3.0 | 2.0 | 1454 | $1,895 | $1.30 | 24d | 1 | 0.82mi |
| 130 Town Center Blvd Clermont, FL | 1.0–3.0 | 1.0–2.0 | 904 | $1,890 | $2.09 | 2d | 19 | 0.94mi |
| 218 Haversham Way Davenport, FL | 1.0 | 1.0 | 785 | $600 | $0.76 | 24d | 1 | 1.02mi |
| 145 Town Center Blvd Clermont, FL | 1.0–3.0 | 1.0–3.0 | 1029 | $1,850 | $1.80 | 2d | 22 | 1.07mi |
| 17345 Cagan Crossings Blvd Clermont, FL | 3.0 | 2.0 | 1269 | $2,195 | $1.73 | 13d | 1 | 1.20mi |
| 603 New Providence Promenade #603 Davenport, FL | 3.0 | 2.0 | 1227 | $1,550 | $1.26 | 24d | 1 | 1.21mi |
| 183 Ashbourne Way Davenport, FL | 1.0–3.0 | 1.0–2.0 | 1039 | $1,822 | $1.75 | 4d | 35 | 1.23mi |
| 237 Somerset Dr Davenport, FL | 2.0 | 1.0 | 1330 | $1,900 | $1.43 | 24d | 1 | 1.23mi |
| 304 New Providence Promenade Unit 304 Davenport, FL | 3.0 | 2.0 | 1227 | $1,495 | $1.22 | 24d | 1 | 1.24mi |
| 222 Bexley Dr Davenport, FL | 2.0 | 2.5 | 1313 | $2,000 | $1.52 | 24d | 1 | 1.27mi |
| 1301 Tuscan Hills Blvd Unit 9406 1 Davenport, FL | 2.0 | 2.0 | 1134 | $2,200 | $1.94 | 24d | 1 | 1.37mi |
| 774 Chelsea Dr Davenport, FL | 2.0 | 2.5 | 988 | $1,750 | $1.77 | 24d | 1 | 1.38mi |
| 17177 Cagan Crossings Blvd Clermont, FL | 3.0 | 2.0 | 1483 | $2,500 | $1.69 | 24d | 1 | 1.39mi |
| 807 Chelsea Dr Davenport, FL | 2.0 | 2.5 | 1076 | $1,450 | $1.35 | 24d | 1 | 1.40mi |
| 9055 Treasure Trove Ln Kissimmee, FL | 2.0–3.0 | 2.0 | 1572 | $1,800 | $1.14 | 4d | 2 | 1.41mi |
| 9055 Treasure Trove Ln Kissimmee, FL | 2.0–3.0 | 2.0 | 1572 | $1,900 | $1.21 | 5d | 2 | 1.41mi |
| 1556 Mirabella Cir Davenport, FL | 3.0 | 2.5 | 1371 | $1,950 | $1.42 | 4d | 1 | 1.44mi |
| 1492 Mirabella Cir Davenport, FL | 3.0 | 2.0 | 1435 | $1,995 | $1.39 | 24d | 1 | 1.48mi |
| 1492 Mirabella Cir Davenport, FL | 3.0 | 2.5 | 1435 | $1,950 | $1.36 | 15d | 1 | 1.48mi |
HOA detail
- Monthly dues
- $70 · $840/yr
- Likely covers
- pool
Listing history 6 events
-
2026-03-30status Pending
-
2026-03-12$179,900 Active
-
2025-06-10status Pending
-
2025-06-07historical
-
2025-04-02price $179,900
-
2025-03-21$197,500 Active
ⓘ Source: listings_history table (triggers on properties + properties_extension) + one-shot
backfill from property_details.listing_events for pre-trigger history.
Tax reassessment forecast FL · Resets to sale price
- Current annual tax
- $2,424 · $202/mo
- Projected year-2 tax
- $2,424 · $202/mo
- Expected delta
- $0/yr ($0/mo · 0.0%)
ⓘ Screening estimate from a state-policy table — verify with the county assessor before closing.
Climate risk First Street
- Flood 1/10 Low FEMA zone X (unshaded) · 0% chance over 30 yrs
- Wildfire 6/10 Major
- Heat 8/10 Severe 7 d/yr ≥107°F today · 24 d/yr by 30 yrs out
- Wind 9/10 Extreme 99% chance of damaging wind over 30 yrs
- Air quality 1/10 Low 0 unhealthy d/yr today · 0 by 30 yrs out
Nearby sold comps map
Loading sold comps map…
Walkable amenities ~0.75 mi
Loading nearby amenities…
Taxation est. · year 1
- Rental income
- $22,044
- − Mortgage interest
- −$10,077
- − Property taxes
- −$2,424
- − Insurance
- −$900
- − Repairs & maintenance
- −$1,764
- − Management
- −$1,764
- − HOA
- −$840
- − Depreciation
- −$5,233
- Taxable loss
- −$957
- Est. tax savings @ 24.0%
- +$230
- After-tax cash flow
- $2,160/yr
For passive investors: Depreciation is non-cash, so a rental often shows a tax loss while cash-flowing — sheltering income. Rental losses are passive: they offset passive income freely, and up to $25,000/yr can offset ordinary (W-2) income if you actively participate and your MAGI is under $100k (phasing out to $0 by $150k); unused losses carry forward. On sale, claimed depreciation is recaptured at up to 25%, and gains may owe capital-gains tax (a 1031 exchange can defer both). Figures are a year-1 estimate at your 24.0% rate — not tax advice; consult a CPA.
Schools (NCES district)
- District
- Polk
- NCES district ID
- 1201590
- Math proficiency
- 39% ▼ -11.00%
- Reading proficiency
- 43% ▼ -4.00%
- Median HH income
- $43,979
- Composite
- 34.74/100
- National rank
- #5132
- State rank
- #62 of 73 in FL
Livability — Four Corners
- Score
- 69/100
- State rank
- #453
- US rank
- #8218
Category grades
Schools grade is shown separately in the Schools card above.
Census & demographics
- County
- Polk County · 740,051 people
- City population
- 27,422
- Metro
- Lakeland-Winter Haven, FL
- Population (ZIP)
- 30,159
- Household income
- $70,982
- Rent vs Own
- Severe rent burden
- 926.0
Population outlook (Polk County) Hauer SSP2
- Today (2025)
- 752,975 people
- By 2030
- 804,621 · +6.9%
- By 2040
- 906,117 · +20.3%
- By 2050
- 1,000,476 · +32.9%
- By 2075
- 1,197,520 · +59.0%
- By 2100
- 1,271,518 · +68.9%
Race, ethnicity, and origin ACS 2023
- Neighborhood character
- Diverse neighborhood (Simpson 0.61)
- Race & ethnicity
- White 45% Hispanic / Latino 43% Two or more races 12% Black 5% Asian 2%
- Hispanic origin (detail)
- Mexican 2% Puerto Rican 21% Cuban 2% Dominican 2%
- Common ancestry
- Romanian 2% Lithuanian 2% Serbian 1%
- Foreign-born
- 16% · Canada, Jamaica, China
- Languages at home
- 61% English-only · Spanish 34% Other Indo-European 1% French/Haitian/Cajun 1%
Political lean MEDSL · Polk
- 2024 margin
- Strong R (+20.7) · D 39.2% · R 59.9%
- 2008→2024 swing
- -14.6pp toward R · 2008: -6.1pp · 2024: -20.7pp
- All cycles
- 2024: R+20.7 2020: R+14.4 2016: R+14.1 2012: R+6.8 2008: R+6.1
Not yet ingested
- Civics
- —
Market trends
- HPI YoY
- ▼ -0.61%
- Current HPI
- 236.2905
- Rent YoY
- ▼ -2.69%
- Metro
- Lakeland-Winter Haven, FL
- State GDP YoY
- ▲ 3.28%
- F500 in state
- 36
Industry mix (Fortune 500 HQ in FL)
| Industry | F500 HQs | Revenue |
|---|---|---|
| Industrial Technology | 2 | $29B |
|
||
| Insurance | 2 | $17B |
|
||
| Retail | 1 | $60B |
|
||
| Technology Distribution | 1 | $58B |
|
||
| Homebuilding | 1 | $35B |
|
||
| Technology Manufacturing | 1 | $35B |
|
||
Price history
-8.9% since first listed6 events — show timeline
- 2026-03-30 Pending — Stellar MLS as Distributed by MLS Grid
- 2026-03-12 Listed $179,900 Stellar MLS as Distributed by MLS Grid
- 2025-06-10 Pending — Stellar MLS as Distributed by MLS Grid
- 2025-06-07 Listing Removed — Stellar MLS as Distributed by MLS Grid
- 2025-04-02 Price Changed $179,900 Stellar MLS as Distributed by MLS Grid
- 2025-03-21 Listed $197,500 Stellar MLS as Distributed by MLS Grid
Property tax history
+8.7%/yrLatest (2025): $2,424 · +9.6% YoY. Source: county tax records.
Cash-flow waterfall
monthlySold comps — $/sqft
last 12 mo · ≤1 miLoading sold comps…