 Multi-family
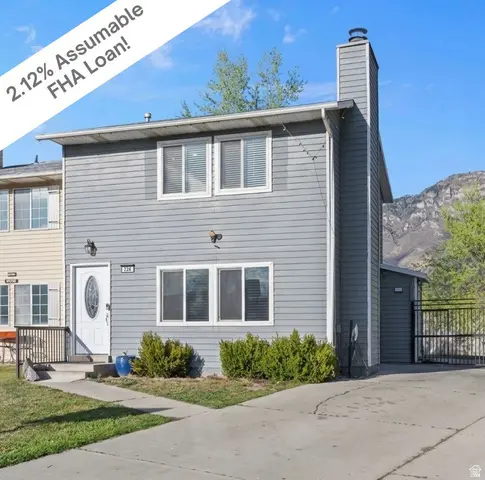
124 W 880 S · Provo, UT
Flood risk 1/10 · Minimal
- FEMA flood zone
- X (unshaded)
- Chance of flooding over 30 yrs
- 0.0%
- Est. flood insurance / yr
- $507 – $1,088
Fire risk 6/10 · Moderate
- Est. fire insurance / yr
- $453 – $841
Heat risk 5/10 · Moderate
- Hot days now (above 95°F)
- 7 days/yr
- Hot days in 30 yrs
- 21 days/yr
Wind risk 1/10 · Minimal
- Chance of severe wind over 30 yrs
- —
Air-quality risk 5/10 · Moderate
- Unhealthy air days now
- 7 days/yr
- Unhealthy air days in 30 yrs
- 8 days/yr
Risk factors via First Street. Map © Google.
Why this score? — see what drove the D+ grade
The composite is a weighted blend of 9 inputs, each scored 0–100. Each bar is that input's sub-score; the figure is the points it added to the 100-point composite (weight × sub-score).
- Cash flow +17.9/30.0
- ARV discount +7.5/15.0
- DSCR +5.6/10.0
- Livability +4.2/5.0
- Rent growth +4.0/5.0
- 1% rule +3.8/10.0
- Schools +3.5/10.0
- Condition / age +2.5/5.0
- Appreciation +0.0/10.0
$370,000
🖨 Deal sheet 📄 Offer letter ✓ Due diligence
Multi-family units
County records classify this as Multi-Family (2-4 Unit). Listing-text estimate: 1 unit. estimate disagrees with records
Listing remarks MLS
There are no remarks available.
Key facts
- Fully fenced-in yard
- End-unit townhouse
- Mountain views
Tags
Property features AI
Finance
- HOA & community: Subdivision: CREATIVE ESTATES
Exterior
- Parking: 3 open/uncovered parking spaces; RV parking available
- Utilities: Natural gas connected; Electricity connected; Sewer connected; Culinary water
- Home design: Townhouse, row-end; Faces west; Residential use
- Construction: Built and currently standing; Aluminum exterior; Asphalt roof
- Exterior features: Located on a cul-de-sac; Curb and gutter; Fully fenced yard; Sidewalks; Mountain view; Partially landscaped
Interior
- Kitchen: Microwave; Refrigerator
- Bedrooms: Primary bedroom on 2nd floor
- Flooring: Tile flooring
- Bathrooms: 1 full bathroom; 1 three-quarter bathroom
- Heating & cooling: Forced air heating (gas central); Central air conditioning
- Interior features: Blinds on windows; Storage shed(s); 8 total rooms; No basement
Neighborhood map
What this means for you Summary
Snapshot
- This is a 3-bed/2.0-bath multifamily listed at $370k.
Deal economics
- At list price, monthly cash flow is $311 ($4k/yr) — positive.
- The deal already cash-flows at list — no discount required.
- To meet the 1% rule (rent ≥ 1% of price), the offer needs to be $324k (12.4% below list).
- Recommended offer: $324k (12.4% below list) — sets the bar for 1% rule.
Location & tenants
- Location reads 85/100 on livability (#15 in UT, #602 nationally) — a professional / high-income tenant draw. Strengths: amenities A+, commute A+, health & safety A.
- Provo District (urban): math 38% / reading 46% proficiency, ranked #44 of 80 in UT (top 55%) — families likely to look elsewhere, expect single-tenant / working-renter base with shorter leases.
- Zoned schools: Spring Creek School (math 35% / reading 38%, grade F, #371 of 585 statewide, top 64%, 456 students, 60% FRL); Centennial Middle (math 32% / reading 50%, grade F, #66 of 138 statewide, top 49%, 1,094 students, 32% FRL); Timpview High (math 35% / reading 61%, grade D, #35 of 171 statewide, top 20%, 2,341 students, 27% FRL) — zoned schools at 40% FRL track the district average.
- Market conditions: Rents rising fast (+5.8%/yr); 221 active listings in the ZIP; 33 comparable units currently listed for rent nearby; rentals at typical pace (median 19d on market — plan ~3-4 weeks tenant-placement turnaround); 6,326 units permitted in Utah County in 2024 (1,053 in 5+ unit buildings).
- At $3,242/mo this rent would consume 58% of the median local household income ($67k/yr) (locally 1332% of renters already pay >50% of income on rent) — very limited rent-growth headroom before tenants either downsize or default.
Forward outlook
- Local home prices are declining (-3.0%/yr); year-one equity from $3k of loan paydown is wiped out by about $11k of value loss. Plan a longer hold.
- Utah County population projected at +49% by 2050 — long-run rental-demand tailwind backs the buy-and-hold thesis.
Negotiation context
- It's been on market 25 days — a 2% lower offer ($364k) is reasonable based on typical stale-listing flexibility.
- 5 sale attempts since 12y ago with the ask held roughly flat each time — persistent listings suggest the price (not the market) is what's stuck; bring a comps-based counter.
Risks & watch-outs
- Climate carrying-cost: major wildfire risk; extreme-heat days projected 7→21/yr by 2055 (HVAC capex compounding) — expect insurance premiums to compound above CPI over the hold.
Questions for the listing agent
- Is there a deadline driving the sale (1031 exchange, divorce, estate, relocation)? That informs how much negotiation room exists.
- The area grade is low — what's the realistic commute time and amenity access for the typical tenant pool here? Any planned neighborhood developments (good or bad) we should know about?
- What's the average days-on-market for RENTAL listings here right now (not sales)? A rising rental-DOM trend means longer vacancies and softer asking-rent achievability than the comps imply.
- What's the recent tenant-quality profile in this submarket — average credit score on applications, eviction rate, late-payment / NSF rate, and stable-employment percentage? A property-management company in the area should have these aggregated.
- How much new apartment / multifamily construction is in the pipeline within 1–3 miles? Heavy new supply (>2% of stock underway) typically softens rents 12–24 months out; light construction supports rent growth.
Investment metrics
- 1% rule
- 0.88% ✗
- Cap rate
- 7.30%
- Cash-on-cash
- 3.60%
- DSCR
- 1.16
- GRM
- 9.5
CMA / ARV
No comps found within radius.
Projected returns pro-forma
-3.0% appreciation · 5.82% rent growth · sell at horizon
- IRR
- -7.9%
- Equity multiple
- 0.70×
- Total profit
- $-30,831
- Equity at exit
- $55,168
- IRR
- 4.6%
- Equity multiple
- 1.38×
- Total profit
- $39,213
- Equity at exit
- $31,991
Cash invested: $103,600 (down + closing). Projections, not guarantees.
Landlord ↔ Tenant lean methodology
- Overall (STATE)
- 86 Strongly Landlord-Friendly
- State Utah
- 86 Strongly Landlord-Friendly · R+15
- County
- — inherits STATE
- City
- — inherits STATE
ZIP-level market 84601
- Rents YoY
- 5.8%
- Active inventory
- 221
- Price-to-rent
- 19.0×
Monthly cashflow live
- Estimated rent
- $3,242 high interval (Pro) →
- Mortgage (P&I)
- −$1,940
- Tax from tax record
- −$156 /mo · $1,869/yr
- Insurance
- −$154
- HOA
- −$0
- Vacancy / Maint / Mgmt
- −$681
- Net cashflow
- $311
Break-even live
2-unit breakdown (identical units grouped — click to expand)
| Units | Beds | Baths | Est. rent |
|---|---|---|---|
| 2× units | 3 | 2 | $3,242 |
| #1 | 3 | 2 | $1,621 |
| #2 | 3 | 2 | $1,621 |
| Total (2 units) | $3,242 | ||
UW: 25.0% down · 7.5% · 30yr · 1.5% tax · 5.0% vac · 8.0% maint · 8.0% mgmt
Financing live
Cash to close
- Down payment
- $92,500
- Closing costs
- $11,100
- Reserves months
- —
- Total cash needed
- —
Loan-product check · same deal, 3 products live
Conventional
25% down · 7.5% · 30yr
- Down + closing
- —
- Monthly P&I
- —
- Monthly cashflow
- —
- DSCR
- —
- Eligible?
- —
Personal DTI + credit; lowest rate.
DSCR
20% down · 8.5% · 30yr
- Down + closing
- —
- Monthly P&I
- —
- Monthly cashflow
- —
- DSCR
- —
- Eligible?
- —
No personal income docs; deal must DSCR.
Hard money
10% down · 12.0% · 12mo
- Down + closing
- —
- Monthly P&I
- —
- Monthly cashflow
- —
- DSCR
- —
- Eligible?
- —
Short-term bridge; refi at stabilization.
Rent comps 33 comps
| Address | Beds | Baths | Sqft | Rent | $/sqft | DOM | Units | Dist |
|---|---|---|---|---|---|---|---|---|
| 237 W 1020 S #3 Provo, UT | 3.0 | 2.0 | 1000 | $2,000 | $2.00 | 14d | 1 | 0.24mi |
| 237 W 1020 S #3 Provo, UT | 3.0 | 2.0 | 1000 | $2,000 | $2.00 | 23d | 1 | 0.24mi |
| 77 W 500 S Provo, UT | 2.0 | 1.0–2.0 | 928 | $1,761 | $1.90 | 2d | 5 | 0.24mi |
| 580 S 300 W Unit 2 Provo, UT | 2.0 | 1.0 | 910 | $1,120 | $1.23 | 23d | 1 | 0.29mi |
| 61 W 400 S Provo, UT | 2.0 | 2.0 | 860 | $1,835 | $2.13 | 2d | 14 | 0.34mi |
| 750 S 650 W Provo, UT | 1.0–3.0 | 1.0–2.0 | 703 | $1,725 | $2.45 | 2d | 1 | 0.50mi |
| 215 S 400 W Unit A Provo, UT | 2.0 | 1.0 | 1000 | $1,495 | $1.50 | 23d | 1 | 0.58mi |
| 138 S 300 W Provo, UT | 2.0 | 1.0 | 890 | $1,250 | $1.40 | 23d | 1 | 0.64mi |
| 306 S 400 E Provo, UT | 2.0 | 2.0 | 900 | $1,300 | $1.44 | 19d | 1 | 0.65mi |
| 550 W 200 S #5 Provo, UT | 2.0 | 1.0 | 703 | $1,150 | $1.64 | 19d | 1 | 0.71mi |
| 271 S 700 W Provo, UT | 2.0 | 1.0 | 950 | $1,700 | $1.79 | 23d | 1 | 0.72mi |
| 63 E Center St Provo, UT | 2.0 | 1.5–2.0 | 885 | $1,628 | $1.84 | 2d | 4 | 0.79mi |
| 755 E 950 South St Provo, UT | 3.0 | 1.5 | 1300 | $1,600 | $1.23 | 19d | 1 | 0.80mi |
| 757 E 950 S Provo, UT | 3.0 | 1.5 | 1300 | $1,600 | $1.23 | 23d | 1 | 0.81mi |
| 35 N 300 W Provo, UT | 2.0 | 2.0 | 1004 | $2,015 | $2.01 | 2d | 1 | 0.81mi |
| 1662 S 400 W Provo, UT | 3.0 | 2.0 | 1205 | $1,775 | $1.47 | 2d | 1 | 0.83mi |
| 1075 S 810 E Provo, UT | 2.0 | 1.5 | 1068 | $1,550 | $1.45 | 14d | 1 | 0.89mi |
| 268 S 900 W Unit 2 Provo, UT | 2.0 | 1.0 | 806 | $1,025 | $1.27 | 11d | 1 | 0.89mi |
| 490 S State St Provo, UT | 1.0–2.0 | 1.0–2.0 | 1054 | $1,719 | $1.63 | 2d | 1 | 0.89mi |
| 950 W 200 S Unit 6 Provo, UT | 2.0 | 1.0 | 790 | $1,100 | $1.39 | 23d | 1 | 0.95mi |
| 389 S State St Provo, UT | 2.0–3.0 | 1.5–2.0 | 1134 | $1,550 | $1.37 | 11d | 1 | 0.98mi |
| 353 E 200 N Unit 15 Provo, UT | 2.0 | 1.0 | 720 | $1,175 | $1.63 | 14d | 1 | 1.05mi |
| 266 N 300 E Apt 27 Provo, UT | 2.0 | 1.0 | 720 | $1,175 | $1.63 | 23d | 1 | 1.07mi |
| 809 E 50 S Provo, UT | 3.0 | 1.0 | 926 | $1,450 | $1.57 | 23d | 1 | 1.10mi |
| 255 400 N Provo, UT | 2.0 | 1.0 | 910 | $1,250 | $1.37 | 23d | 1 | 1.10mi |
| 480 N Freedom Blvd Provo, UT | 2.0 | 1.0–2.0 | 860 | $1,999 | $2.32 | 2d | 6 | 1.18mi |
| 1125 E 960 S Unit 7 Provo, UT | 2.0 | 1.0 | 837 | $1,195 | $1.43 | 23d | 1 | 1.20mi |
| 280 N 900 W Provo, UT | 4.0 | 4.0 | 1234 | $450 | $0.36 | 23d | 1 | 1.22mi |
| 111 S 1000 E Provo, UT | 3.0 | 1.0 | 1059 | $1,549 | $1.46 | 14d | 1 | 1.24mi |
| 424 N 300 E Provo, UT | 2.0 | 1.0 | 662 | $1,499 | $2.26 | 23d | 5 | 1.24mi |
| 360 N 900 W Provo, UT | 2.0 | 1.0 | 700 | $1,325 | $1.89 | 23d | 1 | 1.28mi |
| 747 Freedom Boulevard 200 W #3 Provo, UT | 3.0 | 2.0 | 1300 | $487 | $0.37 | 19d | 1 | 1.41mi |
| 401 N 900 E Provo, UT | 2.0 | 1.0 | 850 | $1,100 | $1.29 | 19d | 8 | 1.44mi |
Listing history 22 events
-
2026-06-08days on market $370,000 Active 25 DOM
-
2026-06-07days on market $370,000 Active 24 DOM
-
2026-06-03days on market $370,000 Active 20 DOM
-
2026-06-02days on market $370,000 Active 19 DOM
-
2026-06-01days on market $370,000 Active 18 DOM
-
2026-05-31days on market $370,000 Active 17 DOM
-
2026-05-31pricedays on market $370,000 Active 16 DOM
-
2026-05-19status Active
-
2026-05-12status Under Contract
-
2026-05-08$375,000 Active
-
2018-11-21soldstatus Sold 31-char remark
Show marketing remark (31 chars)
There are no remarks available.
-
2018-11-21soldstatus
Show marketing remark (31 chars)
There are no remarks available.
-
2018-10-19status Under Contract 31-char remark
Show marketing remark (31 chars)
There are no remarks available.
-
2018-10-11$210,000 Active 31-char remark
Show marketing remark (31 chars)
There are no remarks available.
-
2018-04-05soldstatus Sold 31-char remark
Show marketing remark (31 chars)
There are no remarks available.
-
2018-04-05soldstatus
Show marketing remark (31 chars)
There are no remarks available.
-
2018-03-05status Under Contract 31-char remark
Show marketing remark (31 chars)
There are no remarks available.
-
2018-03-01$195,000 Active 31-char remark
Show marketing remark (31 chars)
There are no remarks available.
-
2015-07-14soldstatus
-
2015-07-13soldstatus
-
2014-11-11$120,000
-
1991-05-31soldstatus
ⓘ Source: listings_history table (triggers on properties + properties_extension) + one-shot
backfill from property_details.listing_events for pre-trigger history.
Tax reassessment forecast UT · Resets to sale price
- Current annual tax
- $1,869 · $156/mo
- Projected year-2 tax
- $2,442 · $204/mo
- Expected delta
- +$573/yr (+$48/mo · 30.7%)
ⓘ Screening estimate from a state-policy table — verify with the county assessor before closing.
Climate risk First Street
- Flood 1/10 Low FEMA zone X (unshaded) · 0% chance over 30 yrs
- Wildfire 6/10 Major
- Heat 5/10 Major 7 d/yr ≥95°F today · 21 d/yr by 30 yrs out
- Wind 1/10 Low
- Air quality 5/10 Major 7 unhealthy d/yr today · 8 by 30 yrs out
Nearby sold comps map
Loading sold comps map…
Walkable amenities ~0.75 mi
Loading nearby amenities…
Taxation est. · year 1
- Rental income
- $38,904
- − Mortgage interest
- −$20,726
- − Property taxes
- −$1,869
- − Insurance
- −$1,850
- − Repairs & maintenance
- −$3,112
- − Management
- −$3,112
- − Depreciation
- −$10,764
- Taxable loss
- −$2,529
- Est. tax savings @ 24.0%
- +$607
- After-tax cash flow
- $4,339/yr
For passive investors: Depreciation is non-cash, so a rental often shows a tax loss while cash-flowing — sheltering income. Rental losses are passive: they offset passive income freely, and up to $25,000/yr can offset ordinary (W-2) income if you actively participate and your MAGI is under $100k (phasing out to $0 by $150k); unused losses carry forward. On sale, claimed depreciation is recaptured at up to 25%, and gains may owe capital-gains tax (a 1031 exchange can defer both). Figures are a year-1 estimate at your 24.0% rate — not tax advice; consult a CPA.
Schools (NCES district)
- District
- Provo District
- NCES district ID
- 4900810
- Math proficiency
- 38% ▼ -10.00%
- Reading proficiency
- 46% ▼ -6.00%
- Median HH income
- $40,698
- Composite
- 35.24/100
- National rank
- #4980
- State rank
- #44 of 80 in UT
Livability — Provo
- Score
- 85/100
- State rank
- #15
- US rank
- #602
Category grades
Schools grade is shown separately in the Schools card above.
Census & demographics
- Census place
- Provo, UT
- County
- Utah County · 661,754 people
- City population
- 112,727
- Metro
- Provo-Orem, UT
- Population (ZIP)
- 32,330
- Household income
- $67,207
- Rent vs Own
- Severe rent burden
- 1332.0
Population outlook (Utah County) Hauer SSP2
- Today (2025)
- 693,420 people
- By 2030
- 757,324 · +9.2%
- By 2040
- 893,178 · +28.8%
- By 2050
- 1,035,842 · +49.4%
- By 2075
- 1,376,733 · +98.5%
- By 2100
- 1,609,388 · +132.1%
Race, ethnicity, and origin ACS 2023
- Neighborhood character
- Majority White (59%)
- Race & ethnicity
- White 59% Hispanic / Latino 33% Two or more races 12% Asian 2% Native American 2% Pacific Islander 1%
- Hispanic origin (detail)
- Mexican 23%
- Common ancestry
- Slovak 3% Italian 2% Scottish 2%
- Foreign-born
- 19% · Canada, Dominican Republic
- Languages at home
- 67% English-only · Spanish 27% Other Indo-European 2% Other Asian/Pacific 1%
Political lean MEDSL · Utah
- 2024 margin
- Solid R (+39.8) · D 28.5% · R 68.3% · Other 3.2%
- 2008→2024 swing
- +19.1pp toward D · 2008: -58.9pp · 2024: -39.8pp
- All cycles
- 2024: R+39.8 2020: R+41.0 2016: R+37.3 2012: R+78.5 2008: R+58.9
Not yet ingested
- Civics
- —
Market trends
- HPI YoY
- ▼ -254.42%
- Current HPI
- 315.3963
- Rent YoY
- ▲ 5.82%
- Metro
- Provo-Orem, UT
- State GDP YoY
- ▲ 3.54%
- F500 in state
- 2
Industry mix (Fortune 500 HQ in UT)
| Industry | F500 HQs | Revenue |
|---|---|---|
| Financial Services | 1 | $3B |
|
||
Price history
+212.5% since first listed15 events — show timeline
- 2026-05-19 Relisted — WFRMLS
- 2026-05-12 Pending — WFRMLS
- 2026-05-08 Listed $375,000 WFRMLS
- 2018-11-21 Sold (Public Records) — Public Records
- 2018-11-21 Sold (MLS) — WFRMLS
- 2018-10-19 Pending — WFRMLS
- 2018-10-11 Listed $210,000 WFRMLS
- 2018-04-05 Sold (Public Records) — Public Records
- 2018-04-05 Sold (MLS) — WFRMLS
- 2018-03-05 Pending — WFRMLS
- 2018-03-01 Listed $195,000 WFRMLS
- 2015-07-14 Sold (Public Records) — Public Records
- 2015-07-13 Sold (MLS) — WFRMLS
- 2014-11-11 Listed $120,000 WFRMLS
- 1991-05-31 Sold (Public Records) — Public Records
Property tax history
+9.5%/yrLatest (2025): $1,869 · -5.5% YoY. Source: county tax records.
Cash-flow waterfall
monthlySold comps — $/sqft
last 12 mo · ≤1 miLoading sold comps…