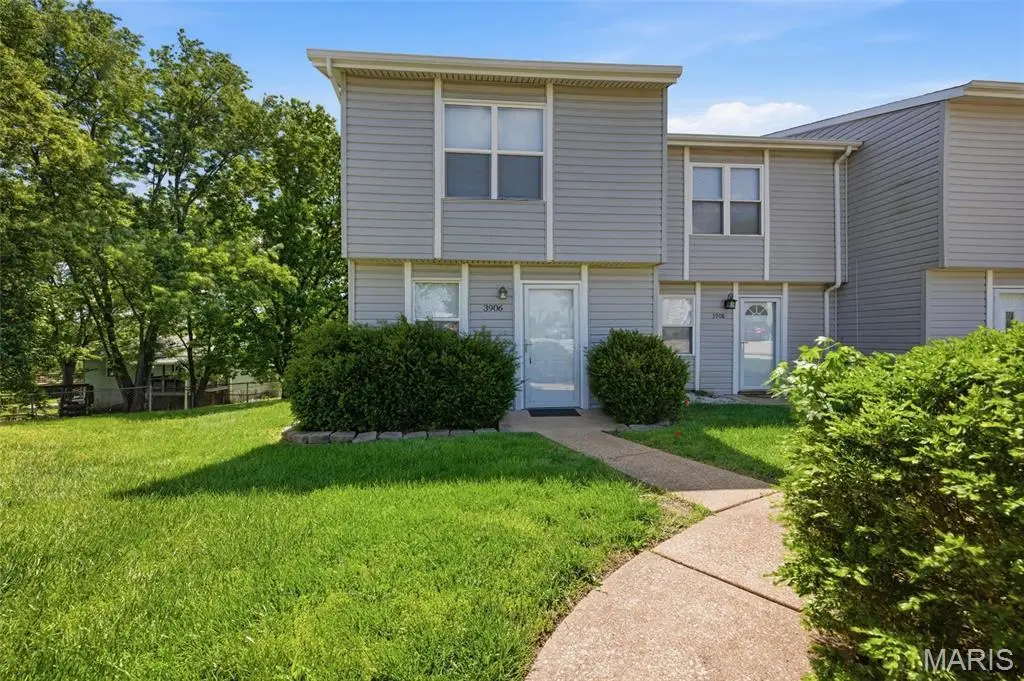
3906 Cherry Brook Dr · Arnold, MO
Flood risk 1/10 · Minimal
- FEMA flood zone
- X (unshaded)
- Chance of flooding over 30 yrs
- 0.0%
- Est. flood insurance / yr
- $507 – $1,088
Fire risk 3/10 · Minor
- Est. fire insurance / yr
- $1,054 – $1,958
Heat risk 5/10 · Moderate
- Hot days now (above 108°F)
- 7 days/yr
- Hot days in 30 yrs
- 21 days/yr
Wind risk 2/10 · Minimal
- Chance of severe wind over 30 yrs
- 1.0%
Air-quality risk 2/10 · Minimal
- Unhealthy air days now
- 0 days/yr
- Unhealthy air days in 30 yrs
- 3 days/yr
Risk factors via First Street. Map © Google.
Why this score? — see what drove the F grade
The composite is a weighted blend of 9 inputs, each scored 0–100. Each bar is that input's sub-score; the figure is the points it added to the 100-point composite (weight × sub-score).
- Cash flow +8.9/30.0
- ARV discount +7.5/15.0
- Schools +3.8/10.0
- 1% rule +3.2/10.0
- Livability +3.1/5.0
- DSCR +2.5/10.0
- Rent growth +2.5/5.0
- Condition / age +2.5/5.0
- Appreciation +0.0/10.0
$149,000
🖨 Deal sheet (PDF) 📄 Offer letter ✓ Due diligence
Listing remarks
Discover the affordability and charm of townhouse living at 3906 Cherry Brook DR, Arnold MO 63010. This is a 2 bedroom, 1-1/2 bath, 1024 SF townhouse that is remodeled and move in ready. Although built in 1985, this townhouse is like new after completing a major remodel in April of this year. The remodel work completed includes a new roof, new gutters, some new vinyl siding and fascia, new vinyl replacement windows, patio door, front door, all new interior doors, luxury vinyl plank flooring throughout the whole house, new 5" base board, wire shelving in all closets, new stair balusters and railing, updated bathrooms with new toilets, vanities, and fixtures, new light fixtures, and new
Key facts
- New patio door
- New gutters
- New front door
Tags
Property features AI
Finance
- Other: Home warranty available; Seller may consider concessions
- HOA & community: Cherry Brook Farms Townhouse association; Monthly association fee of $152; HOA covers grounds maintenance, management, snow removal and trash; Association management available; Community of 15 units
Exterior
- Parking: Assigned and guest parking; Off-street, paved parking; Total of 2 parking spaces
- Security: Smoke detector(s)
- Utilities: Public water; Public sewer; Ameren electric service; Cable available; Electricity connected; Sewer connected; Water connected
- Home design: Attached townhouse; Two levels; Updated/remodeled condition; Private ownership
- Construction: Vinyl siding; Asphalt shingle roof; Slab foundation; Built (year per public records)
- Exterior features: Back yard; Patio; Storm door(s)
Interior
- Kitchen: Dishwasher; Microwave; Electric range; Refrigerator; Pantry
- Bedrooms: Two bedrooms, both on the upper level
- Bathrooms: One full bathroom (upper level); One half bathroom (main level)
- Heating & cooling: Electric forced air heating; Central air conditioning; Ceiling fans; Exhaust fan
- Interior features: Ceiling fans; Pantry; Walk-in closet(s); Blinds; Double-pane windows; Low emissivity windows; Tilt-in windows; Smoke detector(s)
- Laundry & utility: Laundry closet on the 2nd floor with washer and electric dryer hookups; Electric water heater
Neighborhood map
What this means for you Summary
Snapshot
- This is a 2-bed/1.5-bath condo listed at $149k.
Deal economics
- At list price, monthly cash flow is $-120 ($-1k/yr) — negative.
- To cash-flow at today's rent, offer at most $128k (14.2% below list).
- To meet the 1% rule (rent ≥ 1% of price), the offer needs to be $122k (18.2% below list).
- Recommended offer: $122k (18.2% below list) — sets the bar for 1% rule.
- Cap rate 5.3% vs local median 3.8% in Arnold — top-decile yield for the area; either an underpriced asset or a hidden risk that comps aren't pricing in. Stress-test before assuming the spread holds.
Location & tenants
- Location reads 62/100 on livability (#396 in MO) — a middle-class / working-renter tenant base. Strengths: cost of living A+, housing A+, employment B; Watch: crime D+, amenities F, commute F.
- Fox C-6 (suburban): math 35% / reading 50% proficiency, ranked #103 of 324 in MO (top 32%) — families likely to look elsewhere, expect single-tenant / working-renter base with shorter leases.
- Zoned schools: Raymond Nancy Hodge Elem. (math 47% / reading 52%, grade D, #284 of 1,115 statewide, top 30%, 322 students, 30% FRL); Seckman Sr. High (math 22% / reading 64%, grade F, #211 of 521 statewide, top 41%, 1,793 students, 18% FRL) — zoned schools at 24% FRL track the district average.
- Market conditions: 152 active listings in the ZIP; solid renter incomes; 807 units permitted in Jefferson County in 2024 (104 in 5+ unit buildings).
Forward outlook
- Local home prices are declining (-3.0%/yr); year-one equity from $1k of loan paydown is wiped out by about $4k of value loss. Plan a longer hold.
Negotiation context
- Only 2 days on market — expect competitive offers; lowballing is unlikely to land.
- Current owner paid $65k; list at $149k implies a 129% gain — meaningful room to come down on a strong offer.
Risks & watch-outs
- Climate carrying-cost: extreme-heat days projected 7→21/yr by 2055 (HVAC capex compounding) — expect insurance premiums to compound above CPI over the hold.
Questions for the listing agent
- What do current leases actually rent for vs. the listed asking? Can we see a recent rent roll and the last 12 months of T-12 income?
- What does the HOA fee cover, when was the last increase, and are there any pending special assessments or reserve-fund shortfalls?
- Any open or pending special assessments — roof, HVAC, plumbing, elevator, façade? What's the per-unit balance and payoff schedule, and is the seller paying it off at close or rolling it to the buyer?
- Is there a deadline driving the sale (1031 exchange, divorce, estate, relocation)? That informs how much negotiation room exists.
- Schools are D-rated, which usually means shorter tenancies and higher turnover. Who's the typical renter profile here, and what's been the actual vacancy rate?
- Crime grade is D in this area — have there been break-ins, vandalism, or insurance claims at this property in the last 3 years? What carrier currently insures it and at what premium?
- The area grade is low — what's the realistic commute time and amenity access for the typical tenant pool here? Any planned neighborhood developments (good or bad) we should know about?
- What's the average days-on-market for RENTAL listings here right now (not sales)? A rising rental-DOM trend means longer vacancies and softer asking-rent achievability than the comps imply.
- What's the recent tenant-quality profile in this submarket — average credit score on applications, eviction rate, late-payment / NSF rate, and stable-employment percentage? A property-management company in the area should have these aggregated.
- How much new apartment / multifamily construction is in the pipeline within 1–3 miles? Heavy new supply (>2% of stock underway) typically softens rents 12–24 months out; light construction supports rent growth.
Investment metrics
- 1% rule
- 0.82% ✗
- Cap rate
- 5.33%
- Cash-on-cash
- -3.45%
- DSCR
- 0.85
- GRM
- 10.2
CMA / ARV
No comps found within radius.
Projected returns pro-forma
-3.0% appreciation · 3.0% rent growth · sell at horizon
- IRR
- -22.0%
- Equity multiple
- 0.24×
- Total profit
- $-31,743
- Equity at exit
- $22,216
- IRR
- -15.9%
- Equity multiple
- 0.11×
- Total profit
- $-37,284
- Equity at exit
- $12,883
Cash invested: $41,720 (down + closing). Projections, not guarantees.
Landlord ↔ Tenant lean methodology
- Overall (STATE)
- 81 Strongly Landlord-Friendly
- State Missouri
- 81 Strongly Landlord-Friendly · R+10
- County
- — inherits STATE
- City
- — inherits STATE
ZIP-level market 63010
- Active inventory
- 152
- Price-to-rent
- 10.2×
Monthly cashflow live
- Estimated rent
- $1,218 medium interval (Pro) →
- Mortgage (P&I)
- −$781
- Tax from tax record
- −$87 /mo · $1,044/yr
- Insurance
- −$62
- HOA
- −$152
- Lot rent
- −$0
- Vacancy / Maint / Mgmt
- −$256
- Net cashflow
- $-120
Break-even live
Sensitivity live
| Price | -10% $-36 | -5% $-78 | +0% $-120 | +5% $-162 | +10% $-204 |
|---|---|---|---|---|---|
| Rent | -10% $-216 | -5% $-168 | +0% $-120 | +5% $-72 | +10% $-24 |
| Rate | -1.0pp $-45 | -0.5pp $-82 | base $-120 | +0.5pp $-159 | +1.0pp $-198 |
UW: 25.0% down · 7.5% · 30yr · 1.5% tax · 5.0% vac · 8.0% maint · 8.0% mgmt
Financing live
Cash to close
- Down payment
- $37,250
- Closing costs
- $4,470
- Reserves months
- —
- Total cash needed
- —
Loan-product check · same deal, 3 products live
Conventional
25% down · 7.5% · 30yr
- Down + closing
- —
- Monthly P&I
- —
- Monthly cashflow
- —
- DSCR
- —
- Eligible?
- —
Personal DTI + credit; lowest rate.
DSCR
20% down · 8.5% · 30yr
- Down + closing
- —
- Monthly P&I
- —
- Monthly cashflow
- —
- DSCR
- —
- Eligible?
- —
No personal income docs; deal must DSCR.
Hard money
10% down · 12.0% · 12mo
- Down + closing
- —
- Monthly P&I
- —
- Monthly cashflow
- —
- DSCR
- —
- Eligible?
- —
Short-term bridge; refi at stabilization.
HOA detail condo
- Monthly dues
- $152 · $1,824/yr
- Assessments
- None detected in remarks — confirm with the listing agent.
Listing history 5 events
-
2026-05-06status Pending
-
2026-05-04$149,000 Active
-
2017-12-27soldstatus
-
2001-03-15soldstatus $65,000
-
1999-05-14soldstatus $49,000
ⓘ Source: listings_history table (triggers on properties + properties_extension) + one-shot
backfill from property_details.listing_events for pre-trigger history.
Tax reassessment forecast MO · Resets to sale price
- Current annual tax
- $1,044 · $87/mo
- Projected year-2 tax
- $1,445 · $120/mo
- Expected delta
- +$402/yr (+$33/mo · 38.5%)
ⓘ Screening estimate from a state-policy table — verify with the county assessor before closing.
Climate risk First Street
- Flood 1/10 Low FEMA zone X (unshaded) · 0% chance over 30 yrs
- Wildfire 3/10 Moderate
- Heat 5/10 Major 7 d/yr ≥108°F today · 21 d/yr by 30 yrs out
- Wind 2/10 Low 100% chance of damaging wind over 30 yrs
- Air quality 2/10 Low 0 unhealthy d/yr today · 3 by 30 yrs out
Nearby sold comps map
Loading sold comps map…
Walkable amenities ~0.75 mi
Loading nearby amenities…
Taxation est. · year 1
- Rental income
- $14,618
- − Mortgage interest
- −$8,346
- − Property taxes
- −$1,044
- − Insurance
- −$745
- − Repairs & maintenance
- −$1,169
- − Management
- −$1,169
- − HOA
- −$1,824
- − Depreciation
- −$4,335
- Taxable loss
- −$4,015
- Est. tax savings @ 24.0%
- +$964
- After-tax cash flow
- $-478/yr
For passive investors: Depreciation is non-cash, so a rental often shows a tax loss while cash-flowing — sheltering income. Rental losses are passive: they offset passive income freely, and up to $25,000/yr can offset ordinary (W-2) income if you actively participate and your MAGI is under $100k (phasing out to $0 by $150k); unused losses carry forward. On sale, claimed depreciation is recaptured at up to 25%, and gains may owe capital-gains tax (a 1031 exchange can defer both). Figures are a year-1 estimate at your 24.0% rate — not tax advice; consult a CPA.
Schools (NCES district)
- District
- Fox C-6
- NCES district ID
- 2912300
- Math proficiency
- 35% ▼ -11.00%
- Reading proficiency
- 50% ▼ -4.00%
- Median HH income
- $60,849
- Composite
- 37.54/100
- National rank
- #4392
- State rank
- #103 of 324 in MO
Livability — Arnold
- Score
- 62/100
- State rank
- #396
- US rank
- #17082
Category grades
Schools grade is shown separately in the Schools card above.
Census & demographics
- County
- Jefferson County · 108,544 people
- City population
- 34,478
- Metro
- St. Louis, MO-IL
- Population (ZIP)
- 34,478
- Household income
- $79,784
- Rent vs Own
- Severe rent burden
- 422.0
Population outlook (Jefferson County) Hauer SSP2
- Today (2025)
- 235,088 people
- By 2030
- 238,365 · +1.4%
- By 2040
- 240,156 · +2.2%
- By 2050
- 234,651 · -0.2%
- By 2075
- 214,569 · -8.7%
- By 2100
- 179,697 · -23.6%
Race, ethnicity, and origin ACS 2023
- Neighborhood character
- Predominantly White (90%)
- Race & ethnicity
- White 90% Two or more races 6% Hispanic / Latino 2% Asian 1%
- Common ancestry
- Lithuanian 4% American 3% Romanian 2%
- Foreign-born
- 5% · Canada, China
- Languages at home
- 93% English-only · Russian/Polish/Slavic 3% Spanish 1% Chinese 1%
Political lean MEDSL · Jefferson
- 2024 margin
- Solid R (+36.7) · D 31.0% · R 67.7% · Other 1.3%
- 2008→2024 swing
- -39.3pp toward R · 2008: 2.5pp · 2024: -36.7pp
- All cycles
- 2024: R+36.7 2020: R+33.9 2016: R+35.3 2012: R+12.7 2008: D+2.5
Not yet ingested
- Civics
- —
Market trends
- HPI YoY
- ▼ -258.53%
- Current HPI
- 190.586
- Rent YoY
- —
- Metro
- St. Louis, MO-IL
- State GDP YoY
- ▲ 1.84%
- F500 in state
- 20
Industry mix (Fortune 500 HQ in MO)
| Industry | F500 HQs | Revenue |
|---|---|---|
| Healthcare | 1 | $163B |
|
||
| Insurance | 1 | $21B |
|
||
| Industrial Technology | 1 | $17B |
|
||
| Retail | 1 | $16B |
|
||
| Industrial Distribution | 1 | $10B |
|
||
| Utilities | 1 | $9B |
|
||
Price history
+204.1% since first listed5 events — show timeline
- 2026-05-06 Pending — MARIS as Distributed by MLS Grid
- 2026-05-04 Listed $149,000 MARIS as Distributed by MLS Grid
- 2017-12-27 Sold (Public Records) — Public Records
- 2001-03-15 Sold (Public Records) $65,000 Public Records
- 1999-05-14 Sold (Public Records) $49,000 Public Records
Property tax history
+3.3%/yrLatest (2025): $1,044 · +6.7% YoY. Source: county tax records.
Cash-flow waterfall
monthlySold comps — $/sqft
last 12 mo · ≤1 miLoading sold comps…