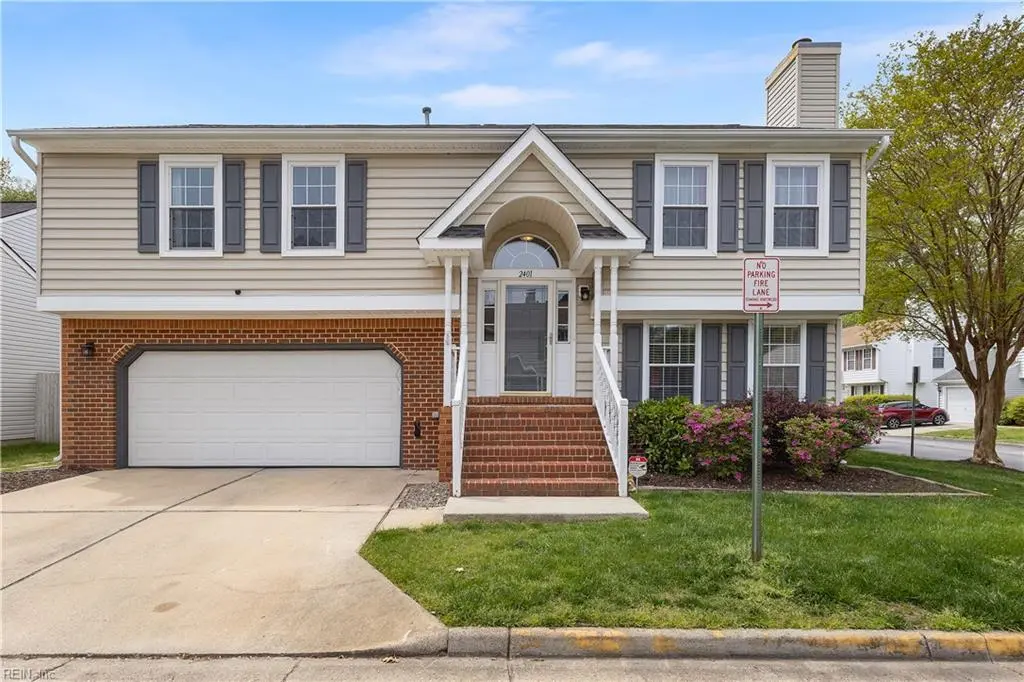
2401 Timber Run · Virginia Beach, VA
Flood risk 3/10 · Minor
- FEMA flood zone
- X (unshaded)
- Chance of flooding over 30 yrs
- 0.2%
- Est. flood insurance / yr
- $507 – $1,088
Fire risk 4/10 · Minor
- Est. fire insurance / yr
- $666 – $1,236
Heat risk 9/10 · Severe
- Hot days now (above 105°F)
- 7 days/yr
- Hot days in 30 yrs
- 16 days/yr
Wind risk 8/10 · Major
- Chance of severe wind over 30 yrs
- 94.0%
Air-quality risk 2/10 · Minimal
- Unhealthy air days now
- 0 days/yr
- Unhealthy air days in 30 yrs
- 2 days/yr
Risk factors via First Street. Map © Google.
Why this score? — see what drove the D grade
The composite is a weighted blend of 9 inputs, each scored 0–100. Each bar is that input's sub-score; the figure is the points it added to the 100-point composite (weight × sub-score).
- Cash flow +11.7/30.0
- ARV discount +7.5/15.0
- Schools +6.4/10.0
- Livability +4.2/5.0
- DSCR +3.5/10.0
- Rent growth +3.4/5.0
- 1% rule +3.3/10.0
- Condition / age +2.5/5.0
- Appreciation +0.0/10.0
$435,000
🖨 Deal sheet (PDF) 📄 Offer letter ✓ Due diligence
Listing remarks
Beautifully maintained 4-bedroom, 3 full bath home on a desirable corner lot offering nearly 2,000 sqft of accommodating living space! This home features two primary suites, including a highly sought-after first-floor bedroom with full bath—ideal for guests or flexible living needs. & #160; Enjoy a functional layout with a wet bar and direct access to the backyard, perfect for entertaining. Outdoor living shines with two gazebos equipped with ceiling fans and lighting, a storage shed, and a 220-volt outlet ready for additional outdoor enhancements. Oversized 2-car garage. & #160; This move-in ready home is conveniently located near shopping, dining, and major routes. Don&rsquo
Key facts
- $180 HOA
- 3 garage spots
- Built 1996
Property features AI
Finance
- HOA & community: COURTHOUSE WOODS CONDO ASSOCIATION; Managed by Sentry Management; Association dues $180 monthly; No separate condo fee listed
Exterior
- Parking: Attached garage for 3+ cars; 2 additional parking spaces; Off-street parking; Street parking
- Utilities: City/County water; City/County sewer; Electric power
- Home design: Detached condo; Contemporary style; Two stories; Slab foundation
- Construction: Vinyl siding; Asphalt shingle roof
- Exterior features: Corner lot; Deck; Wooded view; Back privacy wood fence
Interior
- Kitchen: Dishwasher; Disposal; Microwave; Electric range; Refrigerator; Breakfast area
- Bedrooms: Two bedrooms with ensuite; Bedroom and full bathroom on first floor; Master bedroom with bath; In-law suite
- Flooring: Carpet; Concrete; Laminate; Vinyl; Wood
- Bathrooms: Three full bathrooms
- Heating & cooling: Central air conditioning; Electric heating; Natural gas heating; Gas water heater
- Interior features: Cathedral ceiling; Gas fireplace; Cable hookup; Ceiling fan; Garage door opener; Walk-in closet
- Laundry & utility: Washer/dryer hookups (laundry details not specified)
Neighborhood map
What this means for you Summary
Snapshot
- This is a 4-bed/3.0-bath condo listed at $435k.
Deal economics
- At list price, monthly cash flow is $-124 ($-1k/yr) — negative.
- To cash-flow at today's rent, offer at most $413k (5.0% below list).
- To meet the 1% rule (rent ≥ 1% of price), the offer needs to be $359k (17.4% below list).
- Recommended offer: $359k (17.4% below list) — sets the bar for 1% rule.
- Cap rate 6.0% vs local median 3.5% in Virginia Beach — top-decile yield for the area; either an underpriced asset or a hidden risk that comps aren't pricing in. Stress-test before assuming the spread holds.
Location & tenants
- Location reads 83/100 on livability (#38 in VA, #880 nationally) — a professional / high-income tenant draw. Strengths: amenities A+, employment A+, housing A+; Watch: cost of living C-, commute F.
- Va Beach City Public School District (urban): math 69% / reading 78% proficiency, ranked #10 of 131 in VA (top 8%) — strong family-tenant draw, lease renewals of 3-5y typical.
- Zoned schools: North Landing Elementary (math 87% / reading 92%, grade A+, #19 of 1,108 statewide, top 2%, 455 students, 16% FRL); Landstown Middle (math 64% / reading 81%, grade A, #61 of 342 statewide, top 18%, 1,278 students, 41% FRL); Floyd Kellam High (math 83% / reading 93%, grade A, #13 of 319 statewide, top 4%, 1,882 students, 14% FRL) — zoned schools at 23% FRL track the district average.
- Market conditions: Rents rising (+3.8%/yr); 367 active listings in the ZIP; 3 comparable units currently listed for rent nearby; rentals at typical pace (median 14d on market — plan ~3-4 weeks tenant-placement turnaround); high-income renter base; 666 units permitted in Virginia Beach city in 2024 (347 in 5+ unit buildings).
- This rent runs 33% of the median local income ($131k/yr) — at the standard rent-burdened threshold; future hikes will face affordability resistance.
Forward outlook
- Local home prices are declining (-3.0%/yr); year-one equity from $3k of loan paydown is wiped out by about $13k of value loss. Plan a longer hold.
- Virginia Beach County population projected at +6% by 2050 — modest demand growth; plan on rents tracking national, not racing it.
Negotiation context
- It's been on market 40 days — a 3% lower offer ($422k) is reasonable based on typical stale-listing flexibility.
- 5 sale attempts since 7y ago with the ask held roughly flat each time — persistent listings suggest the price (not the market) is what's stuck; bring a comps-based counter.
- Current owner paid $293k; 48% above their basis — modest negotiation headroom, anchor on the comps not their cost.
Risks & watch-outs
- Climate carrying-cost: severe wind risk, 94% chance of damaging wind over 30y; extreme-heat days projected 7→16/yr by 2055 (HVAC capex compounding) — expect insurance premiums to compound above CPI over the hold.
Questions for the listing agent
- What do current leases actually rent for vs. the listed asking? Can we see a recent rent roll and the last 12 months of T-12 income?
- It's been on market 40 days. Have you received any prior offers? Is the seller open to a 17% concession, seller financing, or rate buy-down credit?
- What does the HOA fee cover, when was the last increase, and are there any pending special assessments or reserve-fund shortfalls?
- Any open or pending special assessments — roof, HVAC, plumbing, elevator, façade? What's the per-unit balance and payoff schedule, and is the seller paying it off at close or rolling it to the buyer?
- Is there a deadline driving the sale (1031 exchange, divorce, estate, relocation)? That informs how much negotiation room exists.
- Schools are A-rated — typically a magnet for longer-tenancy family renters. What's the average tenant stay here, and is there a school-zone premium baked into asking?
- The area grade is low — what's the realistic commute time and amenity access for the typical tenant pool here? Any planned neighborhood developments (good or bad) we should know about?
- What's the average days-on-market for RENTAL listings here right now (not sales)? A rising rental-DOM trend means longer vacancies and softer asking-rent achievability than the comps imply.
- What's the recent tenant-quality profile in this submarket — average credit score on applications, eviction rate, late-payment / NSF rate, and stable-employment percentage? A property-management company in the area should have these aggregated.
- How much new apartment / multifamily construction is in the pipeline within 1–3 miles? Heavy new supply (>2% of stock underway) typically softens rents 12–24 months out; light construction supports rent growth.
Investment metrics
- 1% rule
- 0.83% ✗
- Cap rate
- 5.95%
- Cash-on-cash
- -1.22%
- DSCR
- 0.95
- GRM
- 10.1
CMA / ARV
No comps found within radius.
Projected returns pro-forma
-3.0% appreciation · 3.78% rent growth · sell at horizon
- IRR
- -17.4%
- Equity multiple
- 0.38×
- Total profit
- $-75,494
- Equity at exit
- $64,860
- IRR
- -8.1%
- Equity multiple
- 0.48×
- Total profit
- $-63,922
- Equity at exit
- $37,611
Cash invested: $121,800 (down + closing). Projections, not guarantees.
Landlord ↔ Tenant lean methodology
- Overall (STATE)
- 55 Moderately Landlord-Leaning
- State Virginia
- 55 Moderately Landlord-Leaning · D+2
- County
- — inherits STATE
- City
- — inherits STATE
ZIP-level market 23456
- Rents YoY
- 3.8%
- Active inventory
- 367
- Price-to-rent
- 10.1×
Monthly cashflow live
- Estimated rent
- $3,593 medium interval (Pro) →
- Mortgage (P&I)
- −$2,281
- Tax from tax record
- −$320 /mo · $3,834/yr
- Insurance
- −$181
- HOA
- −$180
- Vacancy / Maint / Mgmt
- −$754
- Net cashflow
- $-124
Break-even live
Sensitivity live
| Price | -10% $123 | -5% $-1 | +0% $-124 | +5% $-247 | +10% $-370 |
|---|---|---|---|---|---|
| Rent | -10% $-407 | -5% $-266 | +0% $-124 | +5% $18 | +10% $160 |
| Rate | -1.0pp $95 | -0.5pp $-13 | base $-124 | +0.5pp $-236 | +1.0pp $-351 |
UW: 25.0% down · 7.5% · 30yr · 1.5% tax · 5.0% vac · 8.0% maint · 8.0% mgmt
Financing live
Cash to close
- Down payment
- $108,750
- Closing costs
- $13,050
- Reserves months
- —
- Total cash needed
- —
Loan-product check · same deal, 3 products live
Conventional
25% down · 7.5% · 30yr
- Down + closing
- —
- Monthly P&I
- —
- Monthly cashflow
- —
- DSCR
- —
- Eligible?
- —
Personal DTI + credit; lowest rate.
DSCR
20% down · 8.5% · 30yr
- Down + closing
- —
- Monthly P&I
- —
- Monthly cashflow
- —
- DSCR
- —
- Eligible?
- —
No personal income docs; deal must DSCR.
Hard money
10% down · 12.0% · 12mo
- Down + closing
- —
- Monthly P&I
- —
- Monthly cashflow
- —
- DSCR
- —
- Eligible?
- —
Short-term bridge; refi at stabilization.
Rent comps 3 comps
| Address | Beds | Baths | Sqft | Rent | $/sqft | DOM | Units | Dist |
|---|---|---|---|---|---|---|---|---|
| 3305 Fayette Dr Virginia Beach, VA | 5.0 | 2.5 | 2510 | $3,595 | $1.43 | 9d | 1 | 0.70mi |
| 3016 Beaden Dr Virginia Beach, VA | 4.0 | 2.5 | 2350 | $3,150 | $1.34 | 14d | 1 | 0.81mi |
| 2925 Beaden Dr Virginia Beach, VA | 4.0 | 2.5 | 2175 | $3,400 | $1.56 | 25d | 1 | 0.81mi |
HOA detail condo
- Monthly dues
- $180 · $2,160/yr
- Assessments
- None detected in remarks — confirm with the listing agent.
Listing history 15 events
-
2026-05-18status Under Contract
-
2026-05-11historical Active Under Contract
-
2026-05-06price $435,000
-
2026-05-06status Active
-
2026-04-20historical Active Under Contract
-
2026-04-07$440,000 Active
-
2019-09-13soldstatus $293,000
-
2019-07-07status Under Contract
-
2019-06-19price $293,000
-
2019-05-16status Active
-
2019-05-07status Under Contract
-
2019-04-29price $295,000
-
2019-04-16status Active
-
2019-04-03status Under Contract
-
2019-03-22$297,000 Active
ⓘ Source: listings_history table (triggers on properties + properties_extension) + one-shot
backfill from property_details.listing_events for pre-trigger history.
Tax reassessment forecast VA · Resets to sale price
- Current annual tax
- $3,834 · $320/mo
- Projected year-2 tax
- $3,834 · $320/mo
- Expected delta
- $0/yr ($0/mo · 0.0%)
ⓘ Screening estimate from a state-policy table — verify with the county assessor before closing.
Climate risk First Street
- Flood 3/10 Moderate FEMA zone X (unshaded) · 20% chance over 30 yrs
- Wildfire 4/10 Moderate
- Heat 9/10 Extreme 7 d/yr ≥105°F today · 16 d/yr by 30 yrs out
- Wind 8/10 Severe 94% chance of damaging wind over 30 yrs
- Air quality 2/10 Low 0 unhealthy d/yr today · 2 by 30 yrs out
Nearby sold comps map
Loading sold comps map…
Walkable amenities ~0.75 mi
Loading nearby amenities…
Taxation est. · year 1
- Rental income
- $43,114
- − Mortgage interest
- −$24,367
- − Property taxes
- −$3,834
- − Insurance
- −$2,175
- − Repairs & maintenance
- −$3,449
- − Management
- −$3,449
- − HOA
- −$2,160
- − Depreciation
- −$12,655
- Taxable loss
- −$8,975
- Est. tax savings @ 24.0%
- +$2,154
- After-tax cash flow
- $670/yr
For passive investors: Depreciation is non-cash, so a rental often shows a tax loss while cash-flowing — sheltering income. Rental losses are passive: they offset passive income freely, and up to $25,000/yr can offset ordinary (W-2) income if you actively participate and your MAGI is under $100k (phasing out to $0 by $150k); unused losses carry forward. On sale, claimed depreciation is recaptured at up to 25%, and gains may owe capital-gains tax (a 1031 exchange can defer both). Figures are a year-1 estimate at your 24.0% rate — not tax advice; consult a CPA.
Schools (NCES district)
- District
- Va Beach City Public School District
- NCES district ID
- 5103840
- Math proficiency
- 69% ▼ -19.00%
- Reading proficiency
- 78% ▼ -7.00%
- Median HH income
- $66,452
- Composite
- 63.81/100
- National rank
- #594
- State rank
- #10 of 131 in VA
Livability — Virginia Beach
- Score
- 83/100
- State rank
- #38
- US rank
- #880
Category grades
Schools grade is shown separately in the Schools card above.
Census & demographics
- Census place
- Virginia Beach, VA
- County
- Virginia Beach City · 448,227 people
- City population
- 448,227
- Metro
- Virginia Beach-Norfolk-Newport News, VA-NC
- Population (ZIP)
- 61,911
- Household income
- $130,533
- Rent vs Own
- Severe rent burden
- 390.0
Population outlook (Virginia Beach County) Hauer SSP2
- Today (2025)
- 480,401 people
- By 2030
- 491,221 · +2.3%
- By 2040
- 504,882 · +5.1%
- By 2050
- 508,847 · +5.9%
- By 2075
- 504,831 · +5.1%
- By 2100
- 465,867 · -3.0%
Race, ethnicity, and origin ACS 2023
- Neighborhood character
- Diverse neighborhood (Simpson 0.60)
- Race & ethnicity
- White 60% Black 13% Asian 12% Two or more races 10% Hispanic / Latino 9%
- Hispanic origin (detail)
- Mexican 3% Puerto Rican 2%
- Common ancestry
- Romanian 2% Slovak 2% Lithuanian 2%
- Foreign-born
- 12% · Canada, China, Vietnam
- Languages at home
- 85% English-only · Tagalog/Filipino 4% Spanish 4% Other Indo-European 2%
Political lean MEDSL · Virginia Beach
- 2024 margin
- Toss-up / Even · D 50.7% · R 48.0% · Other 1.3%
- 2008→2024 swing
- +3.4pp toward D · 2008: -0.7pp · 2024: 2.6pp
- All cycles
- 2024: D+2.6 2020: D+5.4 2016: R+4.5 2012: R+2.5 2008: R+0.7
Not yet ingested
- Civics
- —
Market trends
- HPI YoY
- ▼ -328.17%
- Current HPI
- 318.3094
- Rent YoY
- ▲ 3.78%
- Metro
- Virginia Beach-Norfolk-Newport News, VA-NC
- State GDP YoY
- ▲ 2.40%
- F500 in state
- 50
Industry mix (Fortune 500 HQ in VA)
| Industry | F500 HQs | Revenue |
|---|---|---|
| Aerospace / Defense | 4 | $236B |
|
||
| Technology / Defense | 3 | $32B |
|
||
| Financial Services | 2 | $176B |
|
||
| Utilities | 2 | $27B |
|
||
| Insurance | 2 | $25B |
|
||
| Technology | 2 | $15B |
|
||
Price history
+46.5% since first listed15 events — show timeline
- 2026-05-18 Pending — REINMLS
- 2026-05-11 Contingent — REINMLS
- 2026-05-06 Price Changed $435,000 REINMLS
- 2026-05-06 Relisted — REINMLS
- 2026-04-20 Contingent — REINMLS
- 2026-04-07 Listed $440,000 REINMLS
- 2019-09-13 Sold (Public Records) $293,000 Public Records
- 2019-07-07 Pending — REINMLS
- 2019-06-19 Price Changed $293,000 REINMLS
- 2019-05-16 Relisted — REINMLS
- 2019-05-07 Pending — REINMLS
- 2019-04-29 Price Changed $295,000 REINMLS
- 2019-04-16 Relisted — REINMLS
- 2019-04-03 Pending — REINMLS
- 2019-03-22 Listed $297,000 REINMLS
Property tax history
+4.0%/yrLatest (2025): $3,834 · +3.9% YoY. Source: county tax records.
Cash-flow waterfall
monthlySold comps — $/sqft
last 12 mo · ≤1 miLoading sold comps…