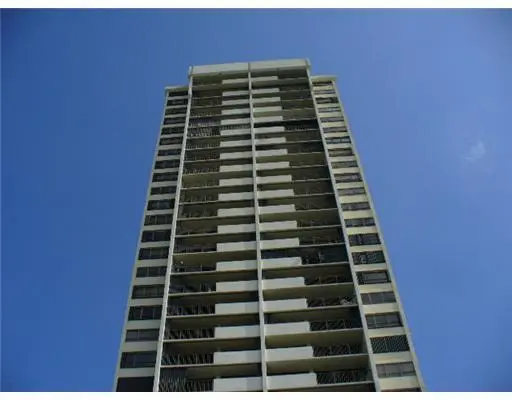
5600 N Flagler Dr Ph 103 · West Palm Beach, FL
Flood risk 9/10 · Severe
- FEMA flood zone
- C
- Chance of flooding over 30 yrs
- 0.99%
- Est. flood insurance / yr
- $591 – $1,051
Fire risk 1/10 · Minimal
- Est. fire insurance / yr
- $947 – $1,759
Heat risk 9/10 · Severe
- Hot days now (above 105°F)
- 5 days/yr
- Hot days in 30 yrs
- 17 days/yr
Wind risk 10/10 · Severe
- Chance of severe wind over 30 yrs
- 99.0%
Air-quality risk 2/10 · Minimal
- Unhealthy air days now
- 0 days/yr
- Unhealthy air days in 30 yrs
- 1 days/yr
Risk factors via First Street. Map © Google.
Why this score? — see what drove the D+ grade
The composite is a weighted blend of 9 inputs, each scored 0–100. Each bar is that input's sub-score; the figure is the points it added to the 100-point composite (weight × sub-score).
- Cash flow +11.1/30.0
- 1% rule +10.0/10.0
- ARV discount +7.5/15.0
- Schools +4.3/10.0
- Livability +4.1/5.0
- Rent growth +3.3/5.0
- DSCR +3.2/10.0
- Condition / age +2.5/5.0
- Appreciation +0.0/10.0
$245,000
🖨 Deal sheet (PDF) 📄 Offer letter ✓ Due diligence
Listing remarks
Penthouse 2-bedroom, 2-bath condo offering sweeping west city sunset views from a spacious private balcony. This well-appointed residence features an upgraded kitchen with premium appliances, tile flooring throughout the main living areas, and wood laminate flooring in the bedrooms. Bright, open living spaces make the home ideal for both relaxing and entertaining. Residents enjoy resort-style amenities including private beach access, a saltwater pool, cabanas, grilling areas, a fishing dock, and a shared boat dock with mooring available. Exceptional waterfront living with outstanding amenities just steps from your door.
Key facts
- Private balcony
- Upgraded kitchen
- Premium appliances
Tags
Property features AI
Finance
- Financial info: Community contains 281 units; Pets not allowed
- HOA & community: Association with monthly fee; Amenities include elevator(s), fitness center, pool, tennis courts, shuffleboard court, game room, community room, library, lobby, picnic area, management, on-site manager, trash chute; HOA fees include cable TV, insurance, grounds maintenance, pest control, security, sewer, water, common areas, and common real estate tax
Exterior
- Parking: Assigned parking; Guest parking; 1 open parking space
- Security: Closed-circuit cameras; Gated with guard; Smoke detectors; Security system; Entry phone/intercom; Attended lobby
- Utilities: Public water; Public sewer; Three-phase electric; Cable available
- Home design: Condominium; Resale property; 30-story building; Faces west; Road frontage east of US-1
- Construction: Concrete/CBS construction
- Exterior features: Deck; Patio; Cabana; Intracoastal waterfront
Interior
- Kitchen: Electric range; Dishwasher; Microwave; Refrigerator; Garbage disposal; Electric water heater
- Bedrooms: 2 bedrooms on the main level
- Flooring: Laminate flooring
- Bathrooms: 2 full bathrooms on the main level
- Heating & cooling: Electric central heating (individual unit); Electric central cooling (individual unit)
- Interior features: Walk-in closets; Split bedroom layout
- Laundry & utility: Laundry inside unit
Neighborhood map
What this means for you Summary
Snapshot
- This is a 2-bed/2.0-bath condo listed at $245k.
Deal economics
- At list price, monthly cash flow is $-167 ($-2k/yr) — negative.
- To cash-flow at today's rent, offer at most $216k (12.0% below list).
- Meets the 1% rule at list price ($4k rent vs $245k).
- Recommended offer: $216k (12.0% below list) — sets the bar for cash-flow.
- Cap rate 5.8% vs local median 3.8% in West Palm Beach — top-decile yield for the area; either an underpriced asset or a hidden risk that comps aren't pricing in. Stress-test before assuming the spread holds.
Location & tenants
- Location reads 82/100 on livability (#75 in FL, #1,255 nationally) — a professional / high-income tenant draw. Strengths: commute A+, housing A+, health & safety A+; Watch: employment C-, crime F.
- Palm Beach (suburban): math 46% / reading 53% proficiency, ranked #34 of 73 in FL (top 47%) — families likely to look elsewhere, expect single-tenant / working-renter base with shorter leases.
- Zoned schools: Northmore Elementary School (math 34% / reading 29%, grade F, #1,841 of 2,144 statewide, top 86%, 628 students, 73% FRL); John F. Kennedy Middle School (math 28% / reading 29%, grade F, #482 of 571 statewide, top 85%, 826 students, 78% FRL); Palm Beach Lakes High School (math 17% / reading 26%, grade F, #546 of 667 statewide, top 82%, 2,688 students, 70% FRL) — zoned schools average 74% FRL vs 52% district-wide (22 pts higher); higher-poverty schools than district average — tighter screening recommended.
- Zoned-school proficiency averages 27% at this address vs 50% district-wide (-22 pts) — the specific schools serving this property underperform the Palm Beach average; the district grade overstates school quality for this exact location.
- Market conditions: Rents rising (+3.1%/yr); 306 active listings in the ZIP; 38 comparable units currently listed for rent nearby; rentals at typical pace (median 27d on market — plan ~3-4 weeks tenant-placement turnaround); 3,974 units permitted in Palm Beach County in 2024 (1,012 in 5+ unit buildings).
Forward outlook
- Local home prices are declining (-3.0%/yr); year-one equity from $2k of loan paydown is wiped out by about $7k of value loss. Plan a longer hold.
- Palm Beach County population projected at +30% by 2050 — long-run rental-demand tailwind backs the buy-and-hold thesis.
Negotiation context
- It's been on market 85 days — a 6% lower offer ($230k) is reasonable based on typical stale-listing flexibility.
- 8 sale attempts since 20y ago; this cycle's ask is 10789% above the opening price — seller raised mid-cycle; expect resistance to lowballs.
- Current owner paid $74k; list at $245k implies a 229% gain — meaningful room to come down on a strong offer.
Risks & watch-outs
- Watch-outs: flood insurance adds $68/mo; HOA is 36% of rent.
- Climate carrying-cost: severe flood risk; severe wind risk, 99% chance of damaging wind over 30y; extreme-heat days projected 5→17/yr by 2055 (HVAC capex compounding) — expect insurance premiums to compound above CPI over the hold.
Questions for the listing agent
- What do current leases actually rent for vs. the listed asking? Can we see a recent rent roll and the last 12 months of T-12 income?
- It's been on market 85 days. Have you received any prior offers? Is the seller open to a 12% concession, seller financing, or rate buy-down credit?
- Built in 1978 — when were the roof, HVAC, electrical panel, plumbing, and water heater last replaced?
- What's the actual annual flood-insurance premium (NFIP or private), and is the property in a SFHA with mandatory coverage?
- What does the HOA fee cover, when was the last increase, and are there any pending special assessments or reserve-fund shortfalls?
- Any open or pending special assessments — roof, HVAC, plumbing, elevator, façade? What's the per-unit balance and payoff schedule, and is the seller paying it off at close or rolling it to the buyer?
- Why hasn't it sold? Are there any deal-killer items the seller is aware of (foundation, flood, title, zoning, code violations)?
- Is there a deadline driving the sale (1031 exchange, divorce, estate, relocation)? That informs how much negotiation room exists.
- Crime grade is F in this area — have there been break-ins, vandalism, or insurance claims at this property in the last 3 years? What carrier currently insures it and at what premium?
- The area grade is low — what's the realistic commute time and amenity access for the typical tenant pool here? Any planned neighborhood developments (good or bad) we should know about?
- What's the average days-on-market for RENTAL listings here right now (not sales)? A rising rental-DOM trend means longer vacancies and softer asking-rent achievability than the comps imply.
- What's the recent tenant-quality profile in this submarket — average credit score on applications, eviction rate, late-payment / NSF rate, and stable-employment percentage? A property-management company in the area should have these aggregated.
- How much new apartment / multifamily construction is in the pipeline within 1–3 miles? Heavy new supply (>2% of stock underway) typically softens rents 12–24 months out; light construction supports rent growth.
Investment metrics
- 1% rule
- 1.55% ✓
- Cap rate
- 5.81%
- Cash-on-cash
- -1.72%
- DSCR
- 0.92
- GRM
- 5.4
CMA / ARV
No comps found within radius.
Projected returns pro-forma
-3.0% appreciation · 3.08% rent growth · sell at horizon
- IRR
- -20.4%
- Equity multiple
- 0.28×
- Total profit
- $-49,064
- Equity at exit
- $36,530
- IRR
- -12.3%
- Equity multiple
- 0.25×
- Total profit
- $-51,247
- Equity at exit
- $21,183
Cash invested: $68,600 (down + closing). Projections, not guarantees.
Landlord ↔ Tenant lean methodology
- Overall (STATE)
- 87 Strongly Landlord-Friendly
- State Florida
- 87 Strongly Landlord-Friendly · R+3
- County
- — inherits STATE
- City
- — inherits STATE
ZIP-level market 33407
- Rents YoY
- 3.1%
- Active inventory
- 306
- Price-to-rent
- 5.4×
Monthly cashflow live
- Estimated rent
- $3,796 high interval (Pro) →
- Mortgage (P&I)
- −$1,285
- Tax from tax record
- −$355 /mo · $4,262/yr
- Insurance
- −$102
- Flood insurance flood zone
- −$68 /mo · $821/yr
- HOA
- −$1,355
- Vacancy / Maint / Mgmt
- −$797
- Net cashflow
- $-167
Break-even live
Sensitivity live
| Price | -10% $-28 | -5% $-98 | +0% $-167 | +5% $-236 | +10% $-306 |
|---|---|---|---|---|---|
| Rent | -10% $-467 | -5% $-317 | +0% $-167 | +5% $-17 | +10% $133 |
| Rate | -1.0pp $-44 | -0.5pp $-105 | base $-167 | +0.5pp $-230 | +1.0pp $-295 |
UW: 25.0% down · 7.5% · 30yr · 1.5% tax · 5.0% vac · 8.0% maint · 8.0% mgmt
Financing live
Cash to close
- Down payment
- $61,250
- Closing costs
- $7,350
- Reserves months
- —
- Total cash needed
- —
Loan-product check · same deal, 3 products live
Conventional
25% down · 7.5% · 30yr
- Down + closing
- —
- Monthly P&I
- —
- Monthly cashflow
- —
- DSCR
- —
- Eligible?
- —
Personal DTI + credit; lowest rate.
DSCR
20% down · 8.5% · 30yr
- Down + closing
- —
- Monthly P&I
- —
- Monthly cashflow
- —
- DSCR
- —
- Eligible?
- —
No personal income docs; deal must DSCR.
Hard money
10% down · 12.0% · 12mo
- Down + closing
- —
- Monthly P&I
- —
- Monthly cashflow
- —
- DSCR
- —
- Eligible?
- —
Short-term bridge; refi at stabilization.
Rent comps 38 comps
| Address | Beds | Baths | Sqft | Rent | $/sqft | DOM | Units | Dist |
|---|---|---|---|---|---|---|---|---|
| 5600 N Flagler Dr West Palm Beach, FL | 1.0–3.0 | 2.0 | 1192 | $4,500 | $3.77 | 23d | 8 | 0.04mi |
| 5600 N Flagler Dr West Palm Beach, FL | 1.0–3.0 | 2.0 | 1192 | $4,600 | $3.86 | 1d | 7 | 0.04mi |
| 5200 N Flagler Dr #2004 West Palm Beach, FL | 2.0 | 2.0 | 1235 | $3,800 | $3.08 | 10d | 1 | 0.20mi |
| 5200 N Flagler Dr West Palm Beach, FL | 2.0 | 2.0 | 1233 | $3,375 | $2.74 | 26d | 2 | 0.20mi |
| 5203 N Flagler Dr West Palm Beach, FL | 3.0 | 1.5 | 1458 | $6,000 | $4.12 | 26d | 1 | 0.21mi |
| 510 56th St West Palm Beach, FL | 2.0 | 1.0 | 1152 | $3,800 | $3.30 | 24d | 1 | 0.23mi |
| 517 55th St West Palm Beach, FL | 2.0 | 2.0 | 1238 | $4,550 | $3.68 | 26d | 1 | 0.23mi |
| 424 51st St Unit 426 West Palm Beach, FL | 3.0 | 2.0 | 1230 | $3,500 | $2.85 | 13d | 1 | 0.26mi |
| 436 51st St West Palm Beach, FL | 2.0 | 1.0 | 968 | $3,750 | $3.87 | 26d | 1 | 0.27mi |
| 5101 Spruce Ave West Palm Beach, FL | 3.0 | 3.0 | 1151 | $3,100 | $2.69 | 26d | 1 | 0.30mi |
| 4444 N Flagler Dr West Palm Beach, FL | 2.0 | 2.0 | 1300 | $4,579 | $3.52 | 26d | 1 | 0.57mi |
| 4444 N Flagler Dr West Palm Beach, FL | 1.0 | 1.0 | 765 | $4,613 | $6.03 | 5d | 1 | 0.57mi |
| 4444 N Flagler Dr West Palm Beach, FL | 1.0 | 1.0 | 765 | $5,263 | $6.88 | 19d | 1 | 0.57mi |
| 4444 N Flagler Dr Unit 4444-306 West Palm Beach, FL | 1.0 | 1.0 | 925 | $3,395 | $3.67 | 26d | 1 | 0.58mi |
| 4444 N Flagler Dr Unit 4334-2008 West Palm Beach, FL | 1.0 | 1.0 | 885 | $4,150 | $4.69 | 26d | 1 | 0.58mi |
| 401 42nd St West Palm Beach, FL | 3.0 | 1.0 | 1400 | $4,950 | $3.54 | 17d | 1 | 0.65mi |
| 401 42nd St West Palm Beach, FL | 3.0 | 1.0 | 1100 | $4,950 | $4.50 | 26d | 1 | 0.65mi |
| 522 W 2nd St Riviera Beach, FL | 3.0 | 1.0 | 900 | $2,895 | $3.22 | 26d | 1 | 0.70mi |
| 3940 N Flagler Dr #206 West Palm Beach, FL | 1.0 | 1.0 | 1078 | $3,950 | $3.66 | 6d | 1 | 0.89mi |
| 3940 N Flagler Dr #206 West Palm Beach, FL | 1.0 | 1.0 | 1078 | $3,950 | $3.66 | 6d | 1 | 0.89mi |
| 3940 N Flagler Dr #206 West Palm Beach, FL | 1.0 | 1.0 | 1078 | $4,950 | $4.59 | 26d | 1 | 0.89mi |
| 230 Colonial Ln Palm Beach, FL | 2.0 | 2.0 | 1436 | $20,000 | $13.93 | 26d | 1 | 0.93mi |
| 619 37th St West Palm Beach, FL | 3.0 | 2.0 | 1414 | $3,350 | $2.37 | 26d | 1 | 0.98mi |
| 701 37th St West Palm Beach, FL | 3.0 | 2.0 | 1426 | $3,600 | $2.52 | 26d | 1 | 1.01mi |
| 306 34th St West Palm Beach, FL | 2.0 | 1.0 | 1443 | $4,650 | $3.22 | 26d | 1 | 1.09mi |
| 3415 N Flagler Dr West Palm Beach, FL | 2.0 | 2.0 | 1174 | $9,950 | $8.48 | 10d | 1 | 1.10mi |
| 3410 Poinsettia Ave West Palm Beach, FL | 2.0 | 1.0 | 1257 | $3,350 | $2.67 | 14d | 1 | 1.12mi |
| 636 35th St West Palm Beach, FL | 3.0 | 2.0 | 1133 | $3,500 | $3.09 | 26d | 1 | 1.13mi |
| 415 32nd St Unit 1 West Palm Beach, FL | 1.0 | 1.0 | 700 | $3,600 | $5.14 | 26d | 1 | 1.20mi |
| 517 31st St West Palm Beach, FL | 2.0 | 1.5 | 1406 | $3,150 | $2.24 | 26d | 1 | 1.28mi |
| 300 Inlet Way #2 Palm Beach Shores, FL | 1.0 | 1.0 | 729 | $4,000 | $5.49 | 26d | 1 | 1.29mi |
| 245 30th St West Palm Beach, FL | 2.0 | 2.0 | 1271 | $9,000 | $7.08 | 26d | 1 | 1.31mi |
| 120 Inlet Way #204 Palm Beach Shores, FL | 2.0 | 2.0 | 1345 | $10,000 | $7.43 | 26d | 1 | 1.43mi |
| 932 31st St West Palm Beach, FL | 3.0 | 2.0 | 850 | $3,000 | $3.53 | 26d | 1 | 1.43mi |
| 933 30th Ct West Palm Beach, FL | 3.0 | 1.5 | 1085 | $3,100 | $2.86 | 26d | 1 | 1.45mi |
| 158 E 23rd St Riviera Beach, FL | 2.0 | 2.0 | 1110 | $2,900 | $2.61 | 24d | 1 | 1.49mi |
| 158 E 23rd St Riviera Beach, FL | 2.0 | 2.0 | 1110 | $2,900 | $2.61 | 26d | 1 | 1.49mi |
| 106 Linda Ln #4 Palm Beach Shores, FL | 2.0 | 2.5 | 1118 | $3,500 | $3.13 | 26d | 1 | 1.49mi |
HOA detail condo
- Monthly dues
- $1,355 · $16,260/yr
- Likely covers
- waterpool
- Assessments
- None detected in remarks — confirm with the listing agent.
Listing history 21 events
-
2026-06-01days on market $245,000 Active 85 DOM
-
2026-05-31days on market $245,000 Active 84 DOM
-
2026-05-14historical $2,250
-
2026-04-30price $245,000
-
2026-04-22$2,250
-
2026-03-08$255,000 Active
-
2018-10-27historical
-
2018-04-26$149,000 Active
-
2013-09-21historical
-
2013-09-21historical
-
2011-03-29soldstatus $74,500
-
2011-03-21historical
-
2011-02-23$74,900
-
2010-01-25historical
-
2009-04-01$199,000
-
2008-01-31historical
-
2007-01-28$250,000
-
2006-07-26$395,000
-
2006-01-16$395,000
-
2004-10-26soldstatus $156,500
-
1995-05-04soldstatus $63,000
ⓘ Source: listings_history table (triggers on properties + properties_extension) + one-shot
backfill from property_details.listing_events for pre-trigger history.
Tax reassessment forecast FL · Resets to sale price
- Current annual tax
- $4,262 · $355/mo
- Projected year-2 tax
- $4,262 · $355/mo
- Expected delta
- $0/yr ($0/mo · 0.0%)
ⓘ Screening estimate from a state-policy table — verify with the county assessor before closing.
Climate risk First Street
- Flood 9/10 Extreme FEMA zone C · 99% chance over 30 yrs
- Wildfire 1/10 Low
- Heat 9/10 Extreme 5 d/yr ≥105°F today · 17 d/yr by 30 yrs out
- Wind 10/10 Extreme 99% chance of damaging wind over 30 yrs
- Air quality 2/10 Low 0 unhealthy d/yr today · 1 by 30 yrs out
Nearby sold comps map
Loading sold comps map…
Walkable amenities ~0.75 mi
Loading nearby amenities…
Taxation est. · year 1
- Rental income
- $45,548
- − Mortgage interest
- −$13,724
- − Property taxes
- −$4,262
- − Insurance
- −$2,046
- − Repairs & maintenance
- −$3,644
- − Management
- −$3,644
- − HOA
- −$16,260
- − Depreciation
- −$7,127
- Taxable loss
- −$5,159
- Est. tax savings @ 24.0%
- +$1,238
- After-tax cash flow
- $-765/yr
For passive investors: Depreciation is non-cash, so a rental often shows a tax loss while cash-flowing — sheltering income. Rental losses are passive: they offset passive income freely, and up to $25,000/yr can offset ordinary (W-2) income if you actively participate and your MAGI is under $100k (phasing out to $0 by $150k); unused losses carry forward. On sale, claimed depreciation is recaptured at up to 25%, and gains may owe capital-gains tax (a 1031 exchange can defer both). Figures are a year-1 estimate at your 24.0% rate — not tax advice; consult a CPA.
Schools (NCES district)
- District
- Palm Beach
- NCES district ID
- 1201500
- Math proficiency
- 46% ▼ -16.00%
- Reading proficiency
- 53% ▼ -4.00%
- Median HH income
- $53,943
- Composite
- 42.72/100
- National rank
- #3160
- State rank
- #34 of 73 in FL
Livability — West Palm Beach
- Score
- 82/100
- State rank
- #75
- US rank
- #1255
Category grades
Schools grade is shown separately in the Schools card above.
Census & demographics
- Census place
- West Palm Beach, FL
- County
- Palm Beach County · 1,438,312 people
- City population
- 222,012
- Metro
- Miami-Fort Lauderdale-Pompano Beach, FL
- Population (ZIP)
- 34,851
- Household income
- $59,993
- Rent vs Own
- Severe rent burden
- 2157.0
Population outlook (Palm Beach County) Hauer SSP2
- Today (2025)
- 1,637,487 people
- By 2030
- 1,743,255 · +6.5%
- By 2040
- 1,948,712 · +19.0%
- By 2050
- 2,132,979 · +30.3%
- By 2075
- 2,530,027 · +54.5%
- By 2100
- 2,706,979 · +65.3%
Race, ethnicity, and origin ACS 2023
- Neighborhood character
- Diverse neighborhood (Simpson 0.62)
- Race & ethnicity
- Black 54% White 21% Hispanic / Latino 20% Two or more races 13% Asian 2%
- Hispanic origin (detail)
- Mexican 2% Puerto Rican 2% Cuban 2%
- Common ancestry
- Hispanic 8% Lithuanian 1% Romanian 1%
- Foreign-born
- 26% · Canada, Vietnam, Jamaica
- Languages at home
- 72% English-only · Spanish 17% French/Haitian/Cajun 8% Other Indo-European 1%
Political lean MEDSL · Palm Beach
- 2024 margin
- Toss-up / Even · D 50.0% · R 49.2%
- 2008→2024 swing
- -22.1pp toward R · 2008: 22.9pp · 2024: 0.8pp
- All cycles
- 2024: D+0.8 2020: D+12.8 2016: D+15.3 2012: D+17.0 2008: D+22.9
Not yet ingested
- Civics
- —
Market trends
- HPI YoY
- ▼ -299.26%
- Current HPI
- 363.3995
- Rent YoY
- ▲ 3.08%
- Metro
- Miami-Fort Lauderdale-Pompano Beach, FL
- State GDP YoY
- ▲ 3.28%
- F500 in state
- 36
Industry mix (Fortune 500 HQ in FL)
| Industry | F500 HQs | Revenue |
|---|---|---|
| Industrial Technology | 2 | $29B |
|
||
| Insurance | 2 | $17B |
|
||
| Retail | 1 | $60B |
|
||
| Technology Distribution | 1 | $58B |
|
||
| Homebuilding | 1 | $35B |
|
||
| Technology Manufacturing | 1 | $35B |
|
||
Price history
-96.4% since first listed19 events — show timeline
- 2026-05-14 Rental Removed $2,250 GFLMLS
- 2026-04-30 Price Changed $245,000 Beaches MLS
- 2026-04-22 Listed for Rent $2,250 GFLMLS
- 2026-03-08 Listed $255,000 Beaches MLS
- 2018-10-27 Listing Removed — Beaches MLS
- 2018-04-26 Listed $149,000 Beaches MLS
- 2013-09-21 Listing Removed — Beaches MLS
- 2013-09-21 Listing Removed — Beaches MLS
- 2011-03-29 Sold (MLS) $74,500 Beaches MLS
- 2011-03-21 Listing Removed — Beaches MLS
- 2011-02-23 Listed $74,900 Beaches MLS
- 2010-01-25 Listing Removed — Beaches MLS
- 2009-04-01 Listed $199,000 Beaches MLS
- 2008-01-31 Listing Removed — Beaches MLS
- 2007-01-28 Listed $250,000 Beaches MLS
- 2006-07-26 Listed $395,000 Beaches MLS
- 2006-01-16 Listed $395,000 Beaches MLS
- 2004-10-26 Sold (Public Records) $156,500 Public Records
- 1995-05-04 Sold (Public Records) $63,000 Public Records
Property tax history
+6.5%/yrLatest (2025): $4,262 · -15.0% YoY. Source: county tax records.
Cash-flow waterfall
monthlySold comps — $/sqft
last 12 mo · ≤1 miLoading sold comps…