350 Honeymoon Rd · Glassboro, NJ
Flood risk No data
- FEMA flood zone
- —
- Chance of flooding over 30 yrs
- —
- Est. flood insurance / yr
- —
Fire risk No data
- Est. fire insurance / yr
- —
Heat risk No data
- Hot days now (above threshold)
- —
- Hot days in 30 yrs
- —
Wind risk No data
- Chance of severe wind over 30 yrs
- —
Air-quality risk No data
- Unhealthy air days now
- —
- Unhealthy air days in 30 yrs
- —
Risk factors via First Street. Map © Google.
Why this score? — see what drove the F grade
The composite is a weighted blend of 9 inputs, each scored 0–100. Each bar is that input's sub-score; the figure is the points it added to the 100-point composite (weight × sub-score).
- ARV discount +7.5/15.0
- Cash flow +6.6/30.0
- Livability +4.0/5.0
- Rent growth +3.7/5.0
- Condition / age +2.5/5.0
- Schools +2.0/10.0
- DSCR +0.8/10.0
- 1% rule +0.3/10.0
- Appreciation +0.0/10.0
$539,900
🖨 Deal sheet 📄 Offer letter ✓ Due diligence
Listing remarks
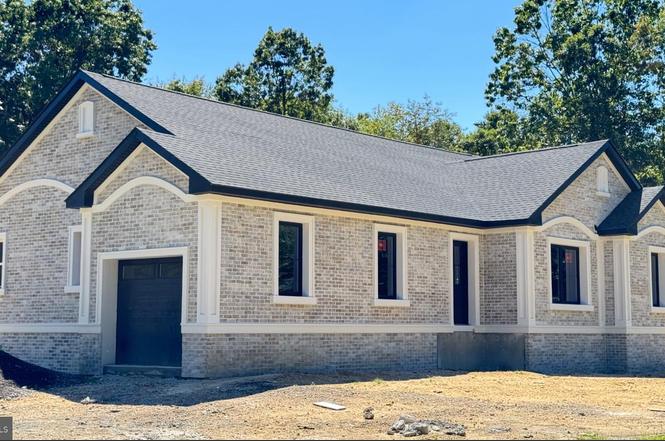
* * * * House is currently UNDER CONSTRUCTION * * * * Completion expected end of summer/early fall 2026 NEW CONSTRUCTION 2026! A true one of a kind. Arguably a hurricane proof house built almost entirely out of Superior Walls. Their panels were used for the basement and main level of the house. It’s a wide rancher layout with 3 Beds, 2 Full Baths + unfinished basement with superior walls ready for sheetrock whenever buyers want to finish it to double their square footage of the house. After walking through the oversized foyer, you will immediately enter the open concept great room and kitchen with a 14.5 foot ceiling height to the center of the vault and a 12 foot ceiling heigh
Key facts
- Tile dog shower
- Wide rancher layout
- Superior walls
Tags
Property features AI
Exterior
- Parking: Attached front-entry garage (1 garage space); Driveway and off-street parking (total 1 garage/parking space listed)
- Utilities: Public water; Public sewer
- Home design: Detached property; Property listed in excellent condition; Ownership: Fee simple; Year built source: Assessor
- Construction: Construction materials: Concrete, masonry, and frame; Concrete perimeter foundation; Above-grade structures present; Construction completion flagged as not completed
- Exterior features: Lot approximately 75 x 150 (estimated); No tidal water
Interior
- Bedrooms: 4 bedrooms on the main level
- Bathrooms: 3 full bathrooms (3 full on main level)
- Heating & cooling: Central heating (natural gas); Central air conditioning (electric); Natural gas hot water
- Interior features: Basement present (other type); 2+ access exits; Living area reported as estimated
Neighborhood map
What this means for you Summary
Snapshot
- This is a 3-bed/2.0-bath land listed at $540k.
Deal economics
- At list price, monthly cash flow is $-897 ($-11k/yr) — negative.
- To cash-flow at today's rent, offer at most $381k (29.4% below list).
- To meet the 1% rule (rent ≥ 1% of price), the offer needs to be $288k (46.7% below list).
- Recommended offer: $288k (46.7% below list) — sets the bar for 1% rule.
Location & tenants
- Location reads 81/100 on livability (#57 in NJ, #1,498 nationally) — a professional / high-income tenant draw. Strengths: commute A+, housing A+, health & safety A+; Watch: schools D+, cost of living D-.
- Glassboro School District (suburban): math 10% / reading 33% proficiency, ranked #412 of 472 in NJ (top 87%) — low school quality limits family demand, transient renter base, plan for 1-2y turnover.
- Market conditions: Rents rising fast (+4.6%/yr); 75 active listings in the ZIP; 4 comparable units currently listed for rent nearby; rentals leasing fast (median 10d on market — plan ~1-2 weeks tenant-placement turnaround); solid renter incomes; 1,047 units permitted in Gloucester County in 2024 (183 in 5+ unit buildings).
- This rent runs 39% of the median local income ($89k/yr) — at the standard rent-burdened threshold; future hikes will face affordability resistance.
Forward outlook
- Local home prices are declining (-3.0%/yr); year-one equity from $4k of loan paydown is wiped out by about $16k of value loss. Plan a longer hold.
- Gloucester County population projected to shrink 5% by 2050 — rents likely to lag national; underwrite the cash flow, not the appreciation.
Negotiation context
- It's been on market 284 days — a 12% lower offer ($475k) is reasonable based on typical stale-listing flexibility.
Questions for the listing agent
- What do current leases actually rent for vs. the listed asking? Can we see a recent rent roll and the last 12 months of T-12 income?
- It's been on market 284 days. Have you received any prior offers? Is the seller open to a 47% concession, seller financing, or rate buy-down credit?
- Why hasn't it sold? Are there any deal-killer items the seller is aware of (foundation, flood, title, zoning, code violations)?
- Is there a deadline driving the sale (1031 exchange, divorce, estate, relocation)? That informs how much negotiation room exists.
- Schools are D-rated, which usually means shorter tenancies and higher turnover. Who's the typical renter profile here, and what's been the actual vacancy rate?
- The area grade is low — what's the realistic commute time and amenity access for the typical tenant pool here? Any planned neighborhood developments (good or bad) we should know about?
- What's the average days-on-market for RENTAL listings here right now (not sales)? A rising rental-DOM trend means longer vacancies and softer asking-rent achievability than the comps imply.
- What's the recent tenant-quality profile in this submarket — average credit score on applications, eviction rate, late-payment / NSF rate, and stable-employment percentage? A property-management company in the area should have these aggregated.
- How much new for-sale + rental construction is in the pipeline within 1–3 miles? Heavy new supply typically softens prices + rents 12–24 months out; constrained supply supports both.
Investment metrics
- 1% rule
- 0.53% ✗
- Cap rate
- 4.30%
- Cash-on-cash
- -7.12%
- DSCR
- 0.68
- GRM
- 15.6
CMA / ARV
No comps found within radius.
Projected returns pro-forma
-3.0% appreciation · 4.64% rent growth · sell at horizon
- IRR
- -27.3%
- Equity multiple
- 0.07×
- Total profit
- $-140,119
- Equity at exit
- $80,501
- IRR
- -21.4%
- Equity multiple
- -0.17×
- Total profit
- $-176,357
- Equity at exit
- $46,681
Cash invested: $151,172 (down + closing). Projections, not guarantees.
Landlord ↔ Tenant lean methodology
- Overall (STATE)
- 21 Tenant-Leaning
- State New Jersey
- 21 Tenant-Leaning · D+6
- County
- — inherits STATE
- City
- — inherits STATE
ZIP-level market 08028
- Home prices YoY
- -21.2%
- Rents YoY
- 4.6%
- Active inventory
- 75
- Price-to-rent
- 15.6×
Monthly cashflow live
- Estimated rent
- $2,878 medium interval (Pro) →
- Mortgage (P&I)
- −$2,831
- Tax from tax record
- −$115 /mo · $1,375/yr
- Insurance
- −$225
- HOA
- −$0
- Vacancy / Maint / Mgmt
- −$604
- Net cashflow
- $-897
Break-even live
UW: 25.0% down · 7.5% · 30yr · 1.5% tax · 5.0% vac · 8.0% maint · 8.0% mgmt
Financing live
Cash to close
- Down payment
- $134,975
- Closing costs
- $16,197
- Reserves months
- —
- Total cash needed
- —
Loan-product check · same deal, 3 products live
Conventional
25% down · 7.5% · 30yr
- Down + closing
- —
- Monthly P&I
- —
- Monthly cashflow
- —
- DSCR
- —
- Eligible?
- —
Personal DTI + credit; lowest rate.
DSCR
20% down · 8.5% · 30yr
- Down + closing
- —
- Monthly P&I
- —
- Monthly cashflow
- —
- DSCR
- —
- Eligible?
- —
No personal income docs; deal must DSCR.
Hard money
10% down · 12.0% · 12mo
- Down + closing
- —
- Monthly P&I
- —
- Monthly cashflow
- —
- DSCR
- —
- Eligible?
- —
Short-term bridge; refi at stabilization.
Rent comps 4 comps
| Address | Beds | Baths | Sqft | Rent | $/sqft | DOM | Units | Dist |
|---|---|---|---|---|---|---|---|---|
| 278 Macoun Way Glassboro, NJ | 3.0 | 2.5 | 1969 | $3,200 | $1.63 | 1d | 1 | 0.95mi |
| 32 Beau Rivage Dr Glassboro, NJ | 3.0 | 1.5 | 1152 | $1,725 | $1.50 | 10d | 1 | 1.08mi |
| 310 Ellis St Glassboro, NJ | 4.0 | 2.0 | 1424 | $2,550 | $1.79 | 1d | 1 | 1.38mi |
| 303 Ellis St Glassboro, NJ | 4.0 | 2.0 | 1440 | $2,500 | $1.74 | 18d | 1 | 1.39mi |
Listing history 27 events
-
2026-06-18days on market $539,900 Active 284 DOM
-
2026-06-17days on market $539,900 Active 283 DOM
-
2026-06-16days on market $539,900 Active 282 DOM
-
2026-06-15days on market $539,900 Active 281 DOM
-
2026-06-13days on market $539,900 Active 279 DOM
-
2026-06-13days on market $539,900 Active 278 DOM
-
2026-06-09days on market $539,900 Active 275 DOM
-
2026-06-08days on market $539,900 Active 274 DOM
-
2026-06-07days on market $539,900 Active 273 DOM
-
2026-06-04days on market $539,900 Active 270 DOM
-
2026-06-03days on market $539,900 Active 269 DOM
-
2026-06-02days on market $539,900 Active 268 DOM
-
2026-06-01days on market $539,900 Active 267 DOM
-
2026-05-31days on market $539,900 Active 266 DOM
-
2026-02-15price $335,900
-
2026-02-12price $336,100
-
2026-01-16price $337,100
-
2026-01-07price $337,200
-
2026-01-06price $337,300
-
2026-01-03price $337,400
-
2026-01-02price $337,600
-
2025-12-28price $337,900
-
2025-12-26price $338,200
-
2025-12-23price $338,900
-
2025-12-18price $339,900
-
2025-12-12price $340,000
-
2025-09-07$639,990 Active
ⓘ Source: listings_history table (triggers on properties + properties_extension) + one-shot
backfill from property_details.listing_events for pre-trigger history.
Tax reassessment forecast NJ · Partial reset (capped growth)
- Current annual tax
- $1,375 · $115/mo
- Projected year-2 tax
- $7,409 · $617/mo
- Expected delta
- +$6,034/yr (+$503/mo · 438.9%)
ⓘ Screening estimate from a state-policy table — verify with the county assessor before closing.
Nearby sold comps map
Loading sold comps map…
Walkable amenities ~0.75 mi
Loading nearby amenities…
Taxation est. · year 1
- Rental income
- $34,533
- − Mortgage interest
- −$30,243
- − Property taxes
- −$1,375
- − Insurance
- −$2,700
- − Repairs & maintenance
- −$2,763
- − Management
- −$2,763
- − Depreciation
- −$15,706
- Taxable loss
- −$21,016
- Est. tax savings @ 24.0%
- +$5,044
- After-tax cash flow
- $-5,725/yr
For passive investors: Depreciation is non-cash, so a rental often shows a tax loss while cash-flowing — sheltering income. Rental losses are passive: they offset passive income freely, and up to $25,000/yr can offset ordinary (W-2) income if you actively participate and your MAGI is under $100k (phasing out to $0 by $150k); unused losses carry forward. On sale, claimed depreciation is recaptured at up to 25%, and gains may owe capital-gains tax (a 1031 exchange can defer both). Figures are a year-1 estimate at your 24.0% rate — not tax advice; consult a CPA.
Schools (NCES district)
- District
- Glassboro School District
- NCES district ID
- 3405880
- Math proficiency
- 10% ▼ -20.00%
- Reading proficiency
- 33% ▼ -3.00%
- Median HH income
- $61,819
- Composite
- 20.19/100
- National rank
- #8631
- State rank
- #412 of 472 in NJ
Livability — Glassboro
- Score
- 81/100
- State rank
- #57
- US rank
- #1498
Category grades
Schools grade is shown separately in the Schools card above.
Census & demographics
- Census place
- Glassboro, NJ
- County
- Gloucester County · 160,422 people
- City population
- 25,098
- Metro
- Philadelphia-Camden-Wilmington, PA-NJ-DE-MD
- Population (ZIP)
- 25,098
- Household income
- $89,130
- Rent vs Own
- Severe rent burden
- 775.0
Population outlook (Gloucester County) Hauer SSP2
- Today (2025)
- 298,895 people
- By 2030
- 299,031 · +0.0%
- By 2040
- 294,020 · -1.6%
- By 2050
- 284,188 · -4.9%
- By 2075
- 260,720 · -12.8%
- By 2100
- 229,565 · -23.2%
Race, ethnicity, and origin ACS 2023
- Neighborhood character
- Diverse neighborhood (Simpson 0.58)
- Race & ethnicity
- White 61% Black 18% Hispanic / Latino 10% Asian 7% Two or more races 6%
- Hispanic origin (detail)
- Mexican 1% Puerto Rican 6%
- Common ancestry
- Romanian 3% Italian 1% Slovak 1%
- Foreign-born
- 9% · Canada, Jamaica, China
- Languages at home
- 85% English-only · Spanish 7% Other Indo-European 3% Other Asian/Pacific 1%
Political lean MEDSL · Gloucester
- 2024 margin
- Toss-up / Even · D 47.8% · R 50.6% · Other 1.6%
- 2008→2024 swing
- -15.0pp toward R · 2008: 12.2pp · 2024: -2.8pp
- All cycles
- 2024: R+2.8 2020: D+1.9 2016: R+0.4 2012: D+10.5 2008: D+12.2
Not yet ingested
- Civics
- —
Market trends
- HPI YoY
- ▼ -79.06%
- Current HPI
- 293.7251
- Rent YoY
- ▲ 4.64%
- Metro
- Philadelphia-Camden-Wilmington, PA-NJ-DE-MD
- State GDP YoY
- ▲ 2.05%
- F500 in state
- 34
Industry mix (Fortune 500 HQ in NJ)
| Industry | F500 HQs | Revenue |
|---|---|---|
| Consumer Goods | 3 | $31B |
|
||
| Pharmaceuticals | 2 | $153B |
|
||
| Technology | 2 | $21B |
|
||
| Insurance | 2 | $20B |
|
||
| Healthcare | 2 | $19B |
|
||
| Financial Services | 1 | $70B |
|
||
Price history
-47.5% since first listed13 events — show timeline
- 2026-02-15 Price Changed $335,900 BRIGHT MLS
- 2026-02-12 Price Changed $336,100 BRIGHT MLS
- 2026-01-16 Price Changed $337,100 BRIGHT MLS
- 2026-01-07 Price Changed $337,200 BRIGHT MLS
- 2026-01-06 Price Changed $337,300 BRIGHT MLS
- 2026-01-03 Price Changed $337,400 BRIGHT MLS
- 2026-01-02 Price Changed $337,600 BRIGHT MLS
- 2025-12-28 Price Changed $337,900 BRIGHT MLS
- 2025-12-26 Price Changed $338,200 BRIGHT MLS
- 2025-12-23 Price Changed $338,900 BRIGHT MLS
- 2025-12-18 Price Changed $339,900 BRIGHT MLS
- 2025-12-12 Price Changed $340,000 BRIGHT MLS
- 2025-09-07 Listed $639,990 BRIGHT MLS
Cash-flow waterfall
monthlySold comps — $/sqft
last 12 mo · ≤1 miLoading sold comps…