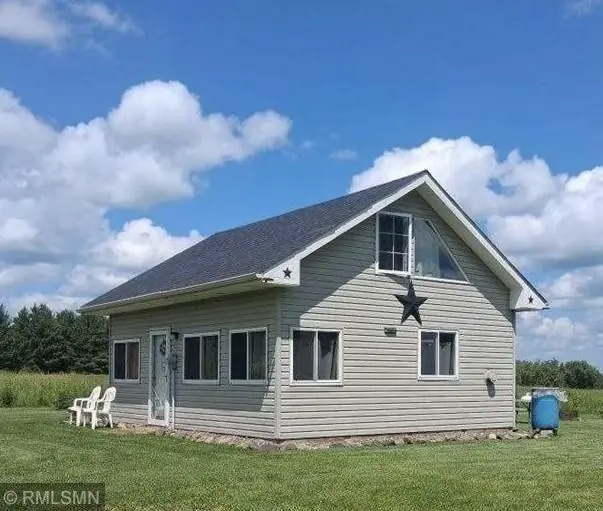
27048 Hawthorn Rd N · Pine City, MN
Flood risk 1/10 · Minimal
- FEMA flood zone
- X (unshaded)
- Chance of flooding over 30 yrs
- 0.0%
- Est. flood insurance / yr
- $507 – $1,088
Fire risk 4/10 · Minor
- Est. fire insurance / yr
- $888 – $1,650
Heat risk 1/10 · Minimal
- Hot days now (above 96°F)
- 7 days/yr
- Hot days in 30 yrs
- 13 days/yr
Wind risk 1/10 · Minimal
- Chance of severe wind over 30 yrs
- —
Air-quality risk 2/10 · Minimal
- Unhealthy air days now
- 1 days/yr
- Unhealthy air days in 30 yrs
- 1 days/yr
Risk factors via First Street. Map © Google.
Why this score? — see what drove the C- grade
The composite is a weighted blend of 9 inputs, each scored 0–100. Each bar is that input's sub-score; the figure is the points it added to the 100-point composite (weight × sub-score).
- Cash flow +15.4/30.0
- Appreciation +10.0/10.0
- ARV discount +7.5/15.0
- DSCR +4.7/10.0
- 1% rule +4.2/10.0
- Schools +3.5/10.0
- Livability +3.5/5.0
- Rent growth +2.5/5.0
- Condition / age +2.2/5.0
$129,999
🖨 Deal sheet 📄 Offer letter ✓ Due diligence
Listing remarks MLS
A great deal - quiet country cabin - on 7 acres plus additional 5 acre to north - take a closer look
Key facts
- Pond
- Trails
- Mix of land
Tags
Neighborhood map
What this means for you Summary
Snapshot
- This is a 1-bed/?-bath single-family listed at $130k. Condition is rated fair.
Deal economics
- At list price, monthly cash flow is $51 ($611/yr) — positive.
- The deal already cash-flows at list — no discount required.
- To meet the 1% rule (rent ≥ 1% of price), the offer needs to be $120k (7.6% below list).
- Recommended offer: $120k (7.6% below list) — sets the bar for 1% rule.
- Cap rate 6.8% vs local median 1.5% in Pine City — top-decile yield for the area; either an underpriced asset or a hidden risk that comps aren't pricing in. Stress-test before assuming the spread holds.
Location & tenants
- Location reads 69/100 on livability (#370 in MN) — a middle-class / working-renter tenant base. Strengths: cost of living A+, housing A+, health & safety A+; Watch: schools D+, amenities F, commute F.
- Pine City Public School District (town): math 34% / reading 47% proficiency, ranked #222 of 301 in MN (top 74%) — families likely to look elsewhere, expect single-tenant / working-renter base with shorter leases.
- Market conditions: 51 active listings in the ZIP; 116 units permitted in Pine County in 2024 (0 in 5+ unit buildings).
Forward outlook
- In year one you build about $14k of equity ($899 loan paydown + $13k appreciation (10.0% local appreciation)).
- Pine County population projected at -24% by 2050 — secular population decline; favor cash flow + early exit over multi-decade hold.
- At projected returns (10.0% appreciation + 3.0% rent growth), your $36k cash investment doubles in ~3 years — after that, you're playing with house money.
- By year 3, paydown + projected appreciation supports a ~$35k cash-out refi (75% LTV) — recoverable capital for the next deal without selling this one.
Negotiation context
- It's been on market 71 days — a 6% lower offer ($122k) is reasonable based on typical stale-listing flexibility.
- 4 sale attempts; this cycle's ask has dropped $46k (26%) from the opening price — seller is motivated, your offer sets the floor, not the list.
Questions for the listing agent
- It's been on market 71 days. Have you received any prior offers? Is the seller open to a 8% concession, seller financing, or rate buy-down credit?
- Have any recent inspections been done? Can we get a copy of the seller's disclosures and any deferred-maintenance estimates?
- Why hasn't it sold? Are there any deal-killer items the seller is aware of (foundation, flood, title, zoning, code violations)?
- Is there a deadline driving the sale (1031 exchange, divorce, estate, relocation)? That informs how much negotiation room exists.
- Schools are D-rated, which usually means shorter tenancies and higher turnover. Who's the typical renter profile here, and what's been the actual vacancy rate?
- What's the average days-on-market for RENTAL listings here right now (not sales)? A rising rental-DOM trend means longer vacancies and softer asking-rent achievability than the comps imply.
- What's the recent tenant-quality profile in this submarket — average credit score on applications, eviction rate, late-payment / NSF rate, and stable-employment percentage? A property-management company in the area should have these aggregated.
- How much new for-sale + rental construction is in the pipeline within 1–3 miles? Heavy new supply typically softens prices + rents 12–24 months out; constrained supply supports both.
Investment metrics
- 1% rule
- 0.92% ✗
- Cap rate
- 6.76%
- Cash-on-cash
- 1.68%
- DSCR
- 1.07
- GRM
- 9.0
CMA / ARV
No comps found within radius.
Projected returns pro-forma
10.0% appreciation · 3.0% rent growth · sell at horizon
- IRR
- 25.5%
- Equity multiple
- 3.03×
- Total profit
- $74,062
- Equity at exit
- $117,113
- IRR
- 22.4%
- Equity multiple
- 6.92×
- Total profit
- $215,586
- Equity at exit
- $252,559
Cash invested: $36,400 (down + closing). Projections, not guarantees.
Landlord ↔ Tenant lean methodology
- Overall (STATE)
- 46 Balanced
- State Minnesota
- 46 Balanced · D+2
- County
- — inherits STATE
- City
- — inherits STATE
ZIP-level market 55037
- Home prices YoY
- 12.4%
- Active inventory
- 51
- Price-to-rent
- 9.0×
Monthly cashflow live
- Estimated rent
- $1,202 medium interval (Pro) →
- Mortgage (P&I)
- −$682
- Tax est. 1.5%
- −$162 /mo · $1,950/yr
- Insurance
- −$54
- HOA
- −$0
- Vacancy / Maint / Mgmt
- −$252
- Net cashflow
- $51
Break-even live
UW: 25.0% down · 7.5% · 30yr · 1.5% tax · 5.0% vac · 8.0% maint · 8.0% mgmt
Financing live
Cash to close
- Down payment
- $32,500
- Closing costs
- $3,900
- Reserves months
- —
- Total cash needed
- —
Loan-product check · same deal, 3 products live
Conventional
25% down · 7.5% · 30yr
- Down + closing
- —
- Monthly P&I
- —
- Monthly cashflow
- —
- DSCR
- —
- Eligible?
- —
Personal DTI + credit; lowest rate.
DSCR
20% down · 8.5% · 30yr
- Down + closing
- —
- Monthly P&I
- —
- Monthly cashflow
- —
- DSCR
- —
- Eligible?
- —
No personal income docs; deal must DSCR.
Hard money
10% down · 12.0% · 12mo
- Down + closing
- —
- Monthly P&I
- —
- Monthly cashflow
- —
- DSCR
- —
- Eligible?
- —
Short-term bridge; refi at stabilization.
Listing history 14 events
-
2026-04-28price $129,999 102-char remark
Show marketing remark (102 chars)
A great deal - quiet country cabin - on 7 acres plus additional 5 acre to north - take a closer look
-
2026-04-22price $149,999 102-char remark
Show marketing remark (102 chars)
A great deal - quiet country cabin - on 7 acres plus additional 5 acre to north - take a closer look
-
2026-04-03price $169,999 102-char remark
Show marketing remark (102 chars)
A great deal - quiet country cabin - on 7 acres plus additional 5 acre to north - take a closer look
-
2026-04-03price $169,000 102-char remark
Show marketing remark (102 chars)
A great deal - quiet country cabin - on 7 acres plus additional 5 acre to north - take a closer look
-
2026-03-19$176,000 Active 102-char remark
Show marketing remark (102 chars)
A great deal - quiet country cabin - on 7 acres plus additional 5 acre to north - take a closer look
-
2025-12-11historical
-
2025-12-11historical
-
2025-11-12price $133,400
-
2025-11-12price $188,000
-
2025-11-07$135,900 Active
-
2025-10-31$192,900 Active
-
2025-10-27soldstatus $125,000 Sold
-
2025-10-13status Pending
-
2025-04-21$139,900 Active
ⓘ Source: listings_history table (triggers on properties + properties_extension) + one-shot
backfill from property_details.listing_events for pre-trigger history.
Climate risk First Street
- Flood 1/10 Low FEMA zone X (unshaded) · 0% chance over 30 yrs
- Wildfire 4/10 Moderate
- Heat 1/10 Low 7 d/yr ≥96°F today · 13 d/yr by 30 yrs out
- Wind 1/10 Low
- Air quality 2/10 Low 1 unhealthy d/yr today · 1 by 30 yrs out
Nearby sold comps map
Loading sold comps map…
Walkable amenities ~0.75 mi
Loading nearby amenities…
Taxation est. · year 1
- Rental income
- $14,420
- − Mortgage interest
- −$7,282
- − Property taxes
- −$1,950
- − Insurance
- −$650
- − Repairs & maintenance
- −$1,154
- − Management
- −$1,154
- − Depreciation
- −$3,782
- Taxable loss
- −$1,551
- Est. tax savings @ 24.0%
- +$372
- After-tax cash flow
- $983/yr
For passive investors: Depreciation is non-cash, so a rental often shows a tax loss while cash-flowing — sheltering income. Rental losses are passive: they offset passive income freely, and up to $25,000/yr can offset ordinary (W-2) income if you actively participate and your MAGI is under $100k (phasing out to $0 by $150k); unused losses carry forward. On sale, claimed depreciation is recaptured at up to 25%, and gains may owe capital-gains tax (a 1031 exchange can defer both). Figures are a year-1 estimate at your 24.0% rate — not tax advice; consult a CPA.
Condition & rehab AI · 8 photos
This home requires moderate renovations to update the kitchen and bathrooms, and fresh paint to improve its curb appeal. It has a good roof and solid foundation, making it a good investment opportunity.
Repairs flagged
- Moderate kitchen cabinets — dated and in need of replacement
- Moderate kitchen appliances — small appliances need updating
- Moderate bathroom fixtures — basic fixtures need updating
Value-add opportunities
- Resale update kitchen cabinets and appliances — modernizing the kitchen will attract more buyers
- Resale update bathroom fixtures — modernizing the bathroom will attract more buyers
- Both paint interior walls — fresh paint will improve the home's curb appeal and interior aesthetics
- Both landscaping — improved landscaping will enhance the home's curb appeal and attract more buyers
Renovation cost estimate screening
| Repair item | Severity | Est. cost |
|---|---|---|
| kitchen cabinets · dated and in need of replacement | Moderate | $3,000–15,000 |
| kitchen appliances · small appliances need updating | Moderate | $3,000–15,000 |
| bathroom fixtures · basic fixtures need updating | Moderate | $3,000–15,000 |
| Total estimated repair cost · 3 items | $9,000–45,000 |
Value-add ROI direction
- Resale update kitchen cabinets and appliances — modernizing the kitchen will attract more buyers ↑
- Resale update bathroom fixtures — modernizing the bathroom will attract more buyers ↑
- Both paint interior walls — fresh paint will improve the home's curb appeal and interior aesthetics ↑
- Both landscaping — improved landscaping will enhance the home's curb appeal and attract more buyers ↑
ⓘ Cost ranges are severity-bucket heuristics (US national rule-of-thumb). Get contractor quotes + a written scope before underwriting a rehab budget.
Schools (NCES district)
- District
- Pine City Public School District
- NCES district ID
- 2728380
- Math proficiency
- 34% ▼ -15.00%
- Reading proficiency
- 47% ▼ -9.00%
- Median HH income
- $47,606
- Composite
- 34.63/100
- National rank
- #5148
- State rank
- #222 of 301 in MN
Livability — Pine City
- Score
- 69/100
- State rank
- #370
- US rank
- #8766
Category grades
Schools grade is shown separately in the Schools card above.
Census & demographics
- Population (ZIP)
- 5,077
Population outlook (Pine County) Hauer SSP2
- Today (2025)
- 27,565 people
- By 2030
- 26,567 · -3.6%
- By 2040
- 23,878 · -13.4%
- By 2050
- 20,931 · -24.1%
- By 2075
- 15,372 · -44.2%
- By 2100
- 11,032 · -60.0%
Race, ethnicity, and origin ACS 2023
- Neighborhood character
- Predominantly White (83%)
- Race & ethnicity
- White 83% Two or more races 8% Native American 7% Hispanic / Latino 4%
- Common ancestry
- Portuguese 8% Romanian 4% Lithuanian 2%
- Foreign-born
- 1% · Canada
- Languages at home
- 96% English-only · Spanish 2%
Political lean MEDSL · Pine
- 2024 margin
- Solid R (+35.2) · D 31.6% · R 66.8% · Other 1.6%
- 2008→2024 swing
- -36.7pp toward R · 2008: 1.5pp · 2024: -35.2pp
- All cycles
- 2024: R+35.2 2020: R+30.2 2016: R+26.3 2012: R+0.7 2008: D+1.5
Not yet ingested
- Civics
- —
Market trends
- HPI YoY
- ▲ 27.68%
- Current HPI
- 251.5378
- Rent YoY
- —
- Metro
- —
- State GDP YoY
- ▲ 2.41%
- F500 in state
- 34
Industry mix (Fortune 500 HQ in MN)
| Industry | F500 HQs | Revenue |
|---|---|---|
| Healthcare | 2 | $407B |
|
||
| Retail | 2 | $150B |
|
||
| Consumer Goods | 2 | $32B |
|
||
| Industrial Machinery | 2 | $6B |
|
||
| Agriculture | 1 | $40B |
|
||
| Healthcare / Medical Devices | 1 | $32B |
|
||
Price history
-7.1% since first listed14 events — show timeline
- 2026-04-28 Price Changed $129,999 NORTHSTARMLS as Distributed by MLS Grid
- 2026-04-22 Price Changed $149,999 NORTHSTARMLS as Distributed by MLS Grid
- 2026-04-03 Price Changed $169,999 NORTHSTARMLS as Distributed by MLS Grid
- 2026-04-03 Price Changed $169,000 NORTHSTARMLS as Distributed by MLS Grid
- 2026-03-19 Listed $176,000 NORTHSTARMLS as Distributed by MLS Grid
- 2025-12-11 Listing Removed — NORTHSTARMLS as Distributed by MLS Grid
- 2025-12-11 Listing Removed — NORTHSTARMLS as Distributed by MLS Grid
- 2025-11-12 Price Changed $133,400 NORTHSTARMLS as Distributed by MLS Grid
- 2025-11-12 Price Changed $188,000 NORTHSTARMLS as Distributed by MLS Grid
- 2025-11-07 Listed $135,900 NORTHSTARMLS as Distributed by MLS Grid
- 2025-10-31 Listed $192,900 NORTHSTARMLS as Distributed by MLS Grid
- 2025-10-27 Sold (MLS) $125,000 NORTHSTARMLS as Distributed by MLS Grid
- 2025-10-13 Pending — NORTHSTARMLS as Distributed by MLS Grid
- 2025-04-21 Listed $139,900 NORTHSTARMLS as Distributed by MLS Grid
Cash-flow waterfall
monthlySold comps — $/sqft
last 12 mo · ≤1 miLoading sold comps…