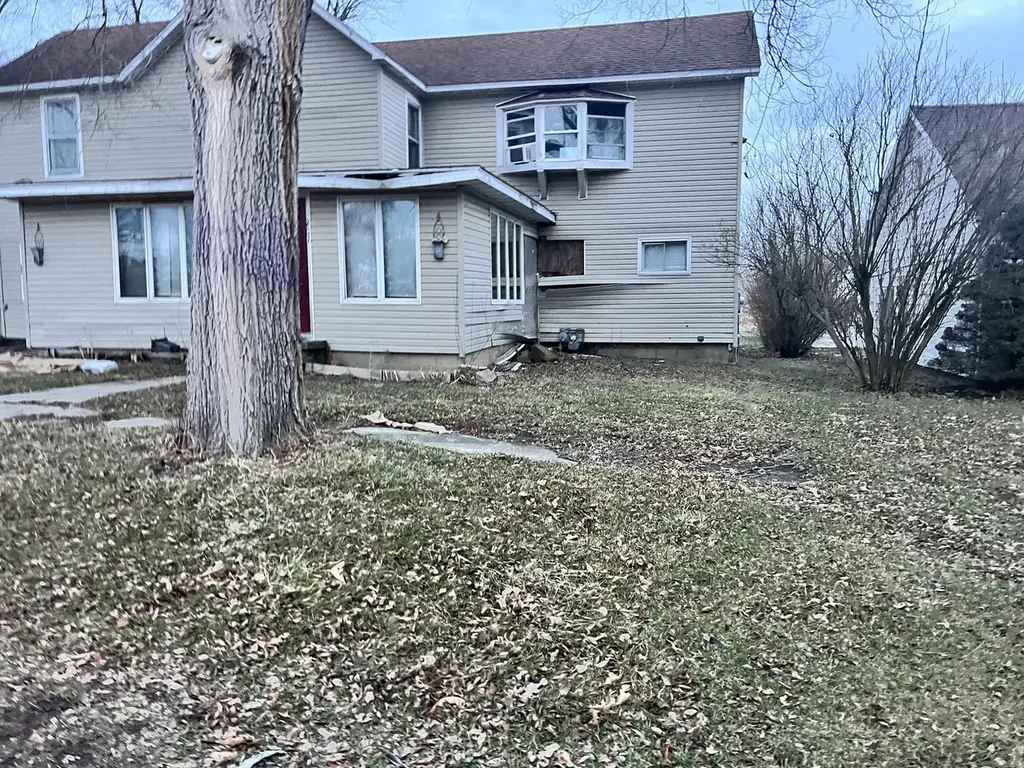
207 S Grove St · Rankin, IL
Flood risk 1/10 · Minimal
- FEMA flood zone
- X (unshaded)
- Chance of flooding over 30 yrs
- 0.0%
- Est. flood insurance / yr
- $507 – $1,088
Fire risk 1/10 · Minimal
- Est. fire insurance / yr
- $804 – $1,492
Heat risk 3/10 · Minor
- Hot days now (above 103°F)
- 7 days/yr
- Hot days in 30 yrs
- 18 days/yr
Wind risk 2/10 · Minimal
- Chance of severe wind over 30 yrs
- 2.0%
Air-quality risk 2/10 · Minimal
- Unhealthy air days now
- 1 days/yr
- Unhealthy air days in 30 yrs
- 1 days/yr
Risk factors via First Street. Map © Google.
Why this score? — see what drove the B grade
The composite is a weighted blend of 9 inputs, each scored 0–100. Each bar is that input's sub-score; the figure is the points it added to the 100-point composite (weight × sub-score).
- Cash flow +30.0/30.0
- 1% rule +10.0/10.0
- DSCR +10.0/10.0
- ARV discount +7.5/15.0
- Appreciation +5.4/10.0
- Livability +2.8/5.0
- Rent growth +2.5/5.0
- Condition / age +2.5/5.0
- Schools +1.0/10.0
$29,900
🖨 Deal sheet 📄 Offer letter ✓ Due diligence
Listing remarks MLS
A large home for the money. Located on edge of Rankin on East side. Lots of possibilities exist here. Come check this home out.
Key facts
- 2 parking spots
- Listed 170 days
Neighborhood map
What this means for you Summary
Snapshot
- This is a 4-bed/1.0-bath single-family listed at $30k.
Deal economics
- At list price, monthly cash flow is $420 ($5k/yr) — positive.
- The deal already cash-flows at list — no discount required.
- Meets the 1% rule at list price ($875 rent vs $30k).
- Recommended offer: $26k (12.0% below list) — sets the bar for market timing.
Location & tenants
- Location reads 55/100 on livability (#1,248 in IL) — a working-class tenant base; expect higher turnover. Strengths: cost of living A+, housing A-; Watch: schools F, crime F, amenities F.
- Hoopeston Area CUSD 11 (town): math 9% / reading 15% proficiency, ranked #559 of 620 in IL (top 90%) — low school quality limits family demand, transient renter base, plan for 1-2y turnover.
- Market conditions: 16 active listings in the ZIP; 1 comparable units currently listed for rent nearby; 8 units permitted in Vermilion County in 2024 (0 in 5+ unit buildings).
Forward outlook
- In year one you build about $453 of equity ($207 loan paydown + $246 appreciation (0.8% local appreciation)).
- Vermilion County population projected at -24% by 2050 — secular population decline; favor cash flow + early exit over multi-decade hold.
- At projected returns (0.8% appreciation + 3.0% rent growth), your $8k cash investment doubles in ~2 years — after that, you're playing with house money.
Negotiation context
- It's been on market 171 days — a 12% lower offer ($26k) is reasonable based on typical stale-listing flexibility.
- 4 sale attempts since 15y ago; this cycle's ask has dropped $9k (23%) from the opening price — seller is motivated, your offer sets the floor, not the list.
Risks & watch-outs
- Watch-outs: property tax is 4.1% of price.
Questions for the listing agent
- It's been on market 171 days. Have you received any prior offers? Is the seller open to a 12% concession, seller financing, or rate buy-down credit?
- Property tax is high relative to price — has the assessment been appealed recently, and will the sale trigger a re-assessment?
- Why hasn't it sold? Are there any deal-killer items the seller is aware of (foundation, flood, title, zoning, code violations)?
- Is there a deadline driving the sale (1031 exchange, divorce, estate, relocation)? That informs how much negotiation room exists.
- Schools are F-rated, which usually means shorter tenancies and higher turnover. Who's the typical renter profile here, and what's been the actual vacancy rate?
- Crime grade is F in this area — have there been break-ins, vandalism, or insurance claims at this property in the last 3 years? What carrier currently insures it and at what premium?
- What's the average days-on-market for RENTAL listings here right now (not sales)? A rising rental-DOM trend means longer vacancies and softer asking-rent achievability than the comps imply.
- What's the recent tenant-quality profile in this submarket — average credit score on applications, eviction rate, late-payment / NSF rate, and stable-employment percentage? A property-management company in the area should have these aggregated.
- How much new for-sale + rental construction is in the pipeline within 1–3 miles? Heavy new supply typically softens prices + rents 12–24 months out; constrained supply supports both.
Investment metrics
- 1% rule
- 2.93% ✓
- Cap rate
- 23.14%
- Cash-on-cash
- 60.15%
- DSCR
- 3.68
- GRM
- 2.8
CMA / ARV
- ARV (median comp)
- $100,933
- List price
- $29,900
- Delta
- -70.38%
- Verdict
- UNDERPRICED
- Comps
- 14 within 1.0 mi
Show comp detail 6 sales within ~0.75 mi
| Address | Dist | Beds/Ba | Sqft | Sold | Price | $/sf | Match |
|---|---|---|---|---|---|---|---|
| 215 N Dixon St | 0.26mi | 3/1.0 (-1) | 1,615 (+1%) | 10mo | $55,000 | $34 | 73 |
| 226 S Main St | 0.38mi | 4/1.5 | 1,656 (+4%) | 4mo | $96,000 | $58 | 70 |
| 211 E 5th Ave | 0.29mi | 3/1.0 (-1) | 1,631 (+2%) | 10mo | $137,000 | $84 | 70 |
| 315 E 4th Ave | 0.17mi | 4/1.5 | 1,507 (-6%) | 14mo | $65,000 | $43 | 68 |
| 418 S Main St | 0.48mi | 3/1.0 (-1) | 1,645 (+3%) | 4mo | $122,000 | $74 | 64 |
| 502 Johnson St | 0.54mi | 3/2.5 (-1) | 1,756 (+10%) | 1mo | $224,977 | $128 | 46 |
Match score weights: distance 35% · size 25% · config 20% · recency 20%. Top-matched comps best support the ARV.
Projected returns pro-forma
0.82% appreciation · 3.0% rent growth · sell at horizon
- IRR
- 62.8%
- Equity multiple
- 4.24×
- Total profit
- $27,084
- Equity at exit
- $9,934
- IRR
- 64.3%
- Equity multiple
- 8.59×
- Total profit
- $63,518
- Equity at exit
- $12,992
Cash invested: $8,372 (down + closing). Projections, not guarantees.
Landlord ↔ Tenant lean methodology
- Overall (STATE)
- 43 Moderately Tenant-Leaning
- State Illinois
- 43 Moderately Tenant-Leaning · D+7
- County
- — inherits STATE
- City
- — inherits STATE
ZIP-level market 60960
- Home prices YoY
- 0.5%
- Active inventory
- 16
- Price-to-rent
- 2.8×
Monthly cashflow live
- Estimated rent
- $875 medium interval (Pro) →
- Mortgage (P&I)
- −$157
- Tax from tax record
- −$102 /mo · $1,228/yr
- Insurance
- −$12
- HOA
- −$0
- Vacancy / Maint / Mgmt
- −$184
- Net cashflow
- $420
Break-even live
UW: 25.0% down · 7.5% · 30yr · 1.5% tax · 5.0% vac · 8.0% maint · 8.0% mgmt
Financing live
Cash to close
- Down payment
- $7,475
- Closing costs
- $897
- Reserves months
- —
- Total cash needed
- —
Loan-product check · same deal, 3 products live
Conventional
25% down · 7.5% · 30yr
- Down + closing
- —
- Monthly P&I
- —
- Monthly cashflow
- —
- DSCR
- —
- Eligible?
- —
Personal DTI + credit; lowest rate.
DSCR
20% down · 8.5% · 30yr
- Down + closing
- —
- Monthly P&I
- —
- Monthly cashflow
- —
- DSCR
- —
- Eligible?
- —
No personal income docs; deal must DSCR.
Hard money
10% down · 12.0% · 12mo
- Down + closing
- —
- Monthly P&I
- —
- Monthly cashflow
- —
- DSCR
- —
- Eligible?
- —
Short-term bridge; refi at stabilization.
Rent comps 1 comps
| Address | Beds | Baths | Sqft | Rent | $/sqft | DOM | Units | Dist |
|---|---|---|---|---|---|---|---|---|
| 220 N Johnson St Rankin, IL | 3.0 | 1.0 | 1600 | $875 | $0.55 | 13d | 1 | 0.47mi |
Listing history 24 events
-
2026-06-18days on market $29,900 Active 171 DOM
-
2026-06-17days on market $29,900 Active 170 DOM
-
2026-06-16days on market $29,900 Active 169 DOM
-
2026-06-15days on market $29,900 Active 168 DOM
-
2026-06-13days on market $29,900 Active 166 DOM
-
2026-06-12days on market $29,900 Active 165 DOM
-
2026-06-09days on market $29,900 Active 162 DOM
-
2026-06-08days on market $29,900 Active 161 DOM
-
2026-06-07days on market $29,900 Active 160 DOM
-
2026-06-07days on market $29,900 Active 159 DOM
-
2026-06-04days on market $29,900 Active 156 DOM
-
2026-06-02days on market $29,900 Active 155 DOM
-
2026-06-01days on market $29,900 Active 154 DOM
-
2026-05-31days on market $29,900 Active 153 DOM
-
2026-05-31days on market $29,900 Active 152 DOM
-
2026-01-21price $29,900 129-char remark
Show marketing remark (129 chars)
A large home for the money. Located on edge of Rankin on East side. Lots of possibilities exist here. Come check this home out.
-
2025-12-29$39,000 Active 129-char remark
Show marketing remark (129 chars)
A large home for the money. Located on edge of Rankin on East side. Lots of possibilities exist here. Come check this home out.
-
2024-08-21soldstatus $38,000 Closed 489-char remark
Show marketing remark (489 chars)
Find great space both inside and out this 4 bedroom, 2 bath home in quiet Rankin! The main floor boasts a spacious living room, large kitchen, bonus family room, separate laundry room with extra storage plus the first bedroom and full bath. Head upstairs to find three additional bedrooms and the second full bathroom. Enjoy all the fresh air on the enclosed back porch or in the fenced backyard. There's plenty of storage for all your tools and toys in a huge detached garage! Sold as is.
-
2024-07-29status Pending 489-char remark
Show marketing remark (489 chars)
Find great space both inside and out this 4 bedroom, 2 bath home in quiet Rankin! The main floor boasts a spacious living room, large kitchen, bonus family room, separate laundry room with extra storage plus the first bedroom and full bath. Head upstairs to find three additional bedrooms and the second full bathroom. Enjoy all the fresh air on the enclosed back porch or in the fenced backyard. There's plenty of storage for all your tools and toys in a huge detached garage! Sold as is.
-
2024-07-26$37,500 Active 489-char remark
Show marketing remark (489 chars)
Find great space both inside and out this 4 bedroom, 2 bath home in quiet Rankin! The main floor boasts a spacious living room, large kitchen, bonus family room, separate laundry room with extra storage plus the first bedroom and full bath. Head upstairs to find three additional bedrooms and the second full bathroom. Enjoy all the fresh air on the enclosed back porch or in the fenced backyard. There's plenty of storage for all your tools and toys in a huge detached garage! Sold as is.
-
2015-02-27soldstatus $35,000
-
2014-10-02$35,000
-
2011-07-14soldstatus $15,000
-
2011-03-28$26,900
ⓘ Source: listings_history table (triggers on properties + properties_extension) + one-shot
backfill from property_details.listing_events for pre-trigger history.
Tax reassessment forecast IL · Partial reset (capped growth)
- Current annual tax
- $1,228 · $102/mo
- Projected year-2 tax
- $1,228 · $102/mo
- Expected delta
- $0/yr ($0/mo · 0.0%)
ⓘ Screening estimate from a state-policy table — verify with the county assessor before closing.
Climate risk First Street
- Flood 1/10 Low FEMA zone X (unshaded) · 0% chance over 30 yrs
- Wildfire 1/10 Low
- Heat 3/10 Moderate 7 d/yr ≥103°F today · 18 d/yr by 30 yrs out
- Wind 2/10 Low 2% chance of damaging wind over 30 yrs
- Air quality 2/10 Low 1 unhealthy d/yr today · 1 by 30 yrs out
Nearby sold comps map
Loading sold comps map…
Walkable amenities ~0.75 mi
Loading nearby amenities…
Taxation est. · year 1
- Rental income
- $10,500
- − Mortgage interest
- −$1,675
- − Property taxes
- −$1,228
- − Insurance
- −$150
- − Repairs & maintenance
- −$840
- − Management
- −$840
- − Depreciation
- −$870
- Taxable income
- $4,898
- Est. tax owed @ 24.0%
- −$1,176
- After-tax cash flow
- $3,861/yr
For passive investors: Depreciation is non-cash, so a rental often shows a tax loss while cash-flowing — sheltering income. Rental losses are passive: they offset passive income freely, and up to $25,000/yr can offset ordinary (W-2) income if you actively participate and your MAGI is under $100k (phasing out to $0 by $150k); unused losses carry forward. On sale, claimed depreciation is recaptured at up to 25%, and gains may owe capital-gains tax (a 1031 exchange can defer both). Figures are a year-1 estimate at your 24.0% rate — not tax advice; consult a CPA.
Schools (NCES district)
- District
- Hoopeston Area CUSD 11
- NCES district ID
- 1719660
- Math proficiency
- 9% ▼ -7.00%
- Reading proficiency
- 15% ▼ -3.00%
- Median HH income
- $40,897
- Composite
- 10.39/100
- National rank
- #9786
- State rank
- #559 of 620 in IL
Livability — Rankin
- Score
- 55/100
- State rank
- #1248
- US rank
- #23467
Category grades
Schools grade is shown separately in the Schools card above.
Census & demographics
- Census place
- Rankin, IL
- City population
- 394
- Population (ZIP)
- 890
Population outlook (Vermilion County) Hauer SSP2
- Today (2025)
- 72,775 people
- By 2030
- 69,235 · -4.9%
- By 2040
- 62,360 · -14.3%
- By 2050
- 55,539 · -23.7%
- By 2075
- 40,606 · -44.2%
- By 2100
- 26,985 · -62.9%
Race, ethnicity, and origin ACS 2023
- Neighborhood character
- Predominantly White (95%)
- Race & ethnicity
- White 95% Hispanic / Latino 4% Two or more races 1%
- Common ancestry
- Scottish 6% Romanian 4% German 2%
Political lean MEDSL · Vermilion
- 2024 margin
- Solid R (+35.7) · D 31.4% · R 67.0% · Other 1.6%
- 2008→2024 swing
- -36.2pp toward R · 2008: 0.6pp · 2024: -35.7pp
- All cycles
- 2024: R+35.7 2020: R+32.9 2016: R+29.2 2012: R+15.7 2008: D+0.6
Not yet ingested
- Civics
- —
Market trends
- HPI YoY
- ▲ 0.82%
- Current HPI
- 164.2254
- Rent YoY
- —
- Metro
- —
- State GDP YoY
- ▲ 1.59%
- F500 in state
- 60
Industry mix (Fortune 500 HQ in IL)
| Industry | F500 HQs | Revenue |
|---|---|---|
| Insurance | 4 | $201B |
|
||
| Consumer Goods | 4 | $87B |
|
||
| Industrial Machinery | 3 | $64B |
|
||
| Healthcare | 2 | $55B |
|
||
| Retail / Pharmacy | 1 | $148B |
|
||
| Agriculture / Food | 1 | $86B |
|
||
Price history
+11.2% since first listed9 events — show timeline
- 2026-01-21 Price Changed $29,900 MRED as Distributed by MLS Grid
- 2025-12-29 Listed $39,000 MRED as Distributed by MLS Grid
- 2024-08-21 Sold (MLS) $38,000 MRED as Distributed by MLS Grid
- 2024-07-29 Pending — MRED as Distributed by MLS Grid
- 2024-07-26 Listed $37,500 MRED as Distributed by MLS Grid
- 2015-02-27 Sold (MLS) $35,000 MRED as Distributed by MLS Grid
- 2014-10-02 Listed $35,000 MRED as Distributed by MLS Grid
- 2011-07-14 Sold (MLS) $15,000 MRED as Distributed by MLS Grid
- 2011-03-28 Listed $26,900 MRED as Distributed by MLS Grid
Property tax history
+4.4%/yrLatest (2024): $1,228 · +42.3% YoY. Source: county tax records.
Cash-flow waterfall
monthlySold comps — $/sqft
last 12 mo · ≤1 miLoading sold comps…