 🏷️ Likely Rental
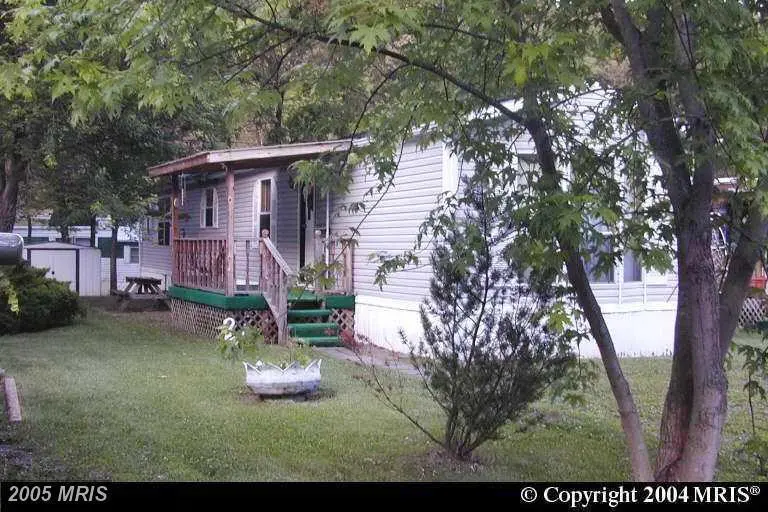
14201 Winchester Rd Lot W · Cresaptown, MD
Flood risk 10/10 · Severe
- FEMA flood zone
- X (shaded)
- Chance of flooding over 30 yrs
- 0.99%
- Est. flood insurance / yr
- $473 – $860
Fire risk 3/10 · Minor
- Est. fire insurance / yr
- $755 – $1,403
Heat risk 4/10 · Minor
- Hot days now (above 100°F)
- 7 days/yr
- Hot days in 30 yrs
- 17 days/yr
Wind risk 2/10 · Minimal
- Chance of severe wind over 30 yrs
- —
Air-quality risk 2/10 · Minimal
- Unhealthy air days now
- 0 days/yr
- Unhealthy air days in 30 yrs
- 1 days/yr
Risk factors via First Street. Map © Google.
Why this score? — see what drove the B- grade
The composite is a weighted blend of 9 inputs, each scored 0–100. Each bar is that input's sub-score; the figure is the points it added to the 100-point composite (weight × sub-score).
- Cash flow +30.0/30.0
- 1% rule +10.0/10.0
- DSCR +10.0/10.0
- ARV discount +7.5/15.0
- Rent growth +5.0/5.0
- Livability +2.8/5.0
- Condition / age +2.5/5.0
- Schools +1.9/10.0
- Appreciation +0.0/10.0
$44,900
🖨 Deal sheet 📄 Offer letter ✓ Due diligence
Listing remarks
MOBILE HOME IS FOR SALE AND NOT FOR RENT HOWEVER THE MOBILE HOME IS ON A RENTED LOT" NICE 2018 14X70 MOBILE HOME ON RENTED LOT - FEATURES 3 BEDROOMS & 2 FULL BATHS - SMALL DECK - KITCHEN/DINING ROOM COMBO - LOCATED IN TRADEWINDS MOBILE HOME PARK - CURRENT LOT RENT IS $425.00 PER MONTH PLUS $100.00 TO COVER WATER - TRASH & SEWER - BACK GROUND CHECK ON APPLICANTS UNDER 18 - MOBILE HOME ONLY NO REAL PROPERTY CONVEYS
Key facts
- Built 2018
- Listed 8 days
Neighborhood map
What this means for you Summary
Snapshot
- This is a 3-bed/2.0-bath other listed at $45k.
Deal economics
- At list price, monthly cash flow is $639 ($8k/yr) — positive.
- The deal already cash-flows at list — no discount required.
- Meets the 1% rule at list price ($1k rent vs $45k).
Location & tenants
- Location reads 56/100 on livability (#411 in MD) — a working-class tenant base; expect higher turnover. Strengths: cost of living A+, housing B+; Watch: employment C-, schools F, crime F.
- Allegany County Public Schools (other): math 15% / reading 30% proficiency, ranked #18 of 24 in MD (top 75%) — low school quality limits family demand, transient renter base, plan for 1-2y turnover.
- Market conditions: Rents rising fast (+10.9%/yr); 235 active listings in the ZIP; 24 units permitted in Allegany County in 2024 (0 in 5+ unit buildings).
Forward outlook
- Local home prices are declining (-3.0%/yr); year-one equity from $310 of loan paydown is wiped out by about $1k of value loss. Plan a longer hold.
- Allegany County population projected at -14% by 2050 — secular population decline; favor cash flow + early exit over multi-decade hold.
- At projected returns (-3.0% appreciation + 8.0% rent growth), your $13k cash investment doubles in ~2 years — after that, you're playing with house money.
Negotiation context
- Only 9 days on market — expect competitive offers; lowballing is unlikely to land.
- 11 sale attempts since 25y ago; this cycle's ask has dropped $10k (18%) from the opening price — seller is motivated, your offer sets the floor, not the list.
- Current owner paid $11k; list at $45k implies a 308% gain — meaningful room to come down on a strong offer.
Risks & watch-outs
- Watch-outs: flood insurance adds $56/mo.
- Climate carrying-cost: severe flood risk — expect insurance premiums to compound above CPI over the hold.
Questions for the listing agent
- What's the actual annual flood-insurance premium (NFIP or private), and is the property in a SFHA with mandatory coverage?
- Is there a deadline driving the sale (1031 exchange, divorce, estate, relocation)? That informs how much negotiation room exists.
- Schools are F-rated, which usually means shorter tenancies and higher turnover. Who's the typical renter profile here, and what's been the actual vacancy rate?
- Crime grade is F in this area — have there been break-ins, vandalism, or insurance claims at this property in the last 3 years? What carrier currently insures it and at what premium?
- What's the average days-on-market for RENTAL listings here right now (not sales)? A rising rental-DOM trend means longer vacancies and softer asking-rent achievability than the comps imply.
- What's the recent tenant-quality profile in this submarket — average credit score on applications, eviction rate, late-payment / NSF rate, and stable-employment percentage? A property-management company in the area should have these aggregated.
- How much new for-sale + rental construction is in the pipeline within 1–3 miles? Heavy new supply typically softens prices + rents 12–24 months out; constrained supply supports both.
Investment metrics
- 1% rule
- 2.83% ✓
- Cap rate
- 24.86%
- Cash-on-cash
- 66.31%
- DSCR
- 3.95
- GRM
- 2.9
CMA / ARV
- ARV (median comp)
- $116,458
- List price
- $44,900
- Delta
- -61.45%
- Verdict
- UNDERPRICED
- Comps
- 20 within 1.0 mi
Projected returns pro-forma
-3.0% appreciation · 8.0% rent growth · sell at horizon
- IRR
- 65.8%
- Equity multiple
- 4.20×
- Total profit
- $40,208
- Equity at exit
- $6,695
- IRR
- 71.8%
- Equity multiple
- 10.41×
- Total profit
- $118,244
- Equity at exit
- $3,882
Cash invested: $12,572 (down + closing). Projections, not guarantees.
Landlord ↔ Tenant lean methodology
- Overall (STATE)
- 27 Tenant-Leaning
- State Maryland
- 27 Tenant-Leaning · D+14
- County
- — inherits STATE
- City
- — inherits STATE
ZIP-level market 21502
- Home prices YoY
- -17.4%
- Rents YoY
- 10.9%
- Active inventory
- 235
- Price-to-rent
- 2.9×
Monthly cashflow live
- Estimated rent
- $1,272 medium interval (Pro) →
- Mortgage (P&I)
- −$235
- Tax est. 1.5%
- −$56 /mo · $674/yr
- Insurance
- −$19
- Flood insurance flood zone
- −$56 /mo · $666/yr
- HOA
- −$0
- Vacancy / Maint / Mgmt
- −$267
- Net cashflow
- $639
Break-even live
UW: 25.0% down · 7.5% · 30yr · 1.5% tax · 5.0% vac · 8.0% maint · 8.0% mgmt
Financing live
Cash to close
- Down payment
- $11,225
- Closing costs
- $1,347
- Reserves months
- —
- Total cash needed
- —
Loan-product check · same deal, 3 products live
Conventional
25% down · 7.5% · 30yr
- Down + closing
- —
- Monthly P&I
- —
- Monthly cashflow
- —
- DSCR
- —
- Eligible?
- —
Personal DTI + credit; lowest rate.
DSCR
20% down · 8.5% · 30yr
- Down + closing
- —
- Monthly P&I
- —
- Monthly cashflow
- —
- DSCR
- —
- Eligible?
- —
No personal income docs; deal must DSCR.
Hard money
10% down · 12.0% · 12mo
- Down + closing
- —
- Monthly P&I
- —
- Monthly cashflow
- —
- DSCR
- —
- Eligible?
- —
Short-term bridge; refi at stabilization.
Listing history 42 events
-
2026-06-19days on market $44,900 Active 9 DOM
-
2026-06-18days on market $44,900 Active 8 DOM
-
2026-06-17days on market $44,900 Active 7 DOM
-
2026-06-16days on market $44,900 Active 6 DOM
-
2026-06-15days on market $44,900 Active 5 DOM
-
2026-06-14days on market $44,900 Active 3 DOM
-
2026-06-12statusdays on market $44,900 Active 2 DOM
-
2026-05-08historical
-
2026-02-06price $44,900
-
2026-01-06historical
-
2025-11-17price $18,900
-
2025-11-12price $49,900
-
2025-11-07$54,900 Active
-
2025-10-28historical
-
2025-10-02historical
-
2025-09-30price $22,500
-
2025-09-26price $20,000
-
2025-09-26price $20,000
-
2025-09-26$29,900 Active
-
2025-09-26$29,900 Active
-
2025-09-24historical
-
2025-09-24historical
-
2016-06-09historical
-
2016-06-09historical
-
2015-11-12price
-
2015-08-19status Active
-
2015-07-10historical Temporarily Off-Market
-
2014-09-18Active
-
2014-09-18$799,900
-
2014-05-29historical Withdrawn
-
2013-06-21Active
-
2013-03-05historical
-
2012-07-21Active
-
2005-01-26soldstatus $11,000
-
2005-01-25historical
-
2004-06-19$12,000
-
2002-06-28soldstatus $20,000
-
2002-06-22historical
-
2002-01-11$23,900
-
2001-12-01soldstatus $12,600
-
2001-11-29historical
-
2001-10-22$13,500
ⓘ Source: listings_history table (triggers on properties + properties_extension) + one-shot
backfill from property_details.listing_events for pre-trigger history.
Climate risk First Street
- Flood 10/10 Extreme FEMA zone X (shaded) · 99% chance over 30 yrs
- Wildfire 3/10 Moderate
- Heat 4/10 Moderate 7 d/yr ≥100°F today · 17 d/yr by 30 yrs out
- Wind 2/10 Low
- Air quality 2/10 Low 0 unhealthy d/yr today · 1 by 30 yrs out
Nearby sold comps map
Loading sold comps map…
Walkable amenities ~0.75 mi
Loading nearby amenities…
Taxation est. · year 1
- Rental income
- $15,265
- − Mortgage interest
- −$2,515
- − Property taxes
- −$674
- − Insurance
- −$891
- − Repairs & maintenance
- −$1,221
- − Management
- −$1,221
- − Depreciation
- −$1,306
- Taxable income
- $7,437
- Est. tax owed @ 24.0%
- −$1,785
- After-tax cash flow
- $5,885/yr
For passive investors: Depreciation is non-cash, so a rental often shows a tax loss while cash-flowing — sheltering income. Rental losses are passive: they offset passive income freely, and up to $25,000/yr can offset ordinary (W-2) income if you actively participate and your MAGI is under $100k (phasing out to $0 by $150k); unused losses carry forward. On sale, claimed depreciation is recaptured at up to 25%, and gains may owe capital-gains tax (a 1031 exchange can defer both). Figures are a year-1 estimate at your 24.0% rate — not tax advice; consult a CPA.
Schools (NCES district)
- District
- Allegany County Public Schools
- NCES district ID
- 2400030
- Math proficiency
- 15% ▼ -26.00%
- Reading proficiency
- 30% ▼ -20.00%
- Median HH income
- $39,760
- Composite
- 18.95/100
- National rank
- #8854
- State rank
- #18 of 24 in MD
Livability — Cresaptown
- Score
- 56/100
- State rank
- #411
- US rank
- #22931
Category grades
Schools grade is shown separately in the Schools card above.
Census & demographics
- County
- Allegany County · 41,015 people
- City population
- 41,015
- Metro
- Cumberland, MD-WV
- Population (ZIP)
- 41,015
- Household income
- $60,725
- Rent vs Own
- Severe rent burden
- 824.0
Population outlook (Allegany County) Hauer SSP2
- Today (2025)
- 68,778 people
- By 2030
- 66,766 · -2.9%
- By 2040
- 62,784 · -8.7%
- By 2050
- 59,179 · -14.0%
- By 2075
- 50,732 · -26.2%
- By 2100
- 40,837 · -40.6%
Race, ethnicity, and origin ACS 2023
- Neighborhood character
- Predominantly White (83%)
- Race & ethnicity
- White 83% Black 9% Two or more races 5% Hispanic / Latino 2%
- Common ancestry
- Slovak 3% Romanian 2% Italian 1%
- Foreign-born
- 2% · Canada
- Languages at home
- 96% English-only · Spanish 2%
Political lean MEDSL · Allegany
- 2024 margin
- Solid R (+40.3) · D 28.9% · R 69.2% · Other 2.0%
- 2008→2024 swing
- -14.4pp toward R · 2008: -25.9pp · 2024: -40.3pp
- All cycles
- 2024: R+40.3 2020: R+38.3 2016: R+48.0 2012: R+32.9 2008: R+25.9
Not yet ingested
- Civics
- —
Market trends
- HPI YoY
- ▼ -54.33%
- Current HPI
- 258.6676
- Rent YoY
- ▲ 10.88%
- Metro
- Cumberland, MD-WV
- State GDP YoY
- ▲ 2.97%
- F500 in state
- 12
Industry mix (Fortune 500 HQ in MD)
| Industry | F500 HQs | Revenue |
|---|---|---|
| Aerospace / Defense | 1 | $71B |
|
||
| Utilities | 1 | $25B |
|
||
| Hotels | 1 | $24B |
|
||
| Consumer Goods | 1 | $7B |
|
||
| Real Estate | 1 | $6B |
|
||
| Chemicals | 1 | $2B |
|
||
Price history
+232.6% since first listed35 events — show timeline
- 2026-05-08 Listing Removed — BRIGHT MLS
- 2026-02-06 Price Changed $44,900 BRIGHT MLS
- 2026-01-06 Listing Removed — BRIGHT MLS
- 2025-11-17 Price Changed $18,900 BRIGHT MLS
- 2025-11-12 Price Changed $49,900 BRIGHT MLS
- 2025-11-07 Listed $54,900 BRIGHT MLS
- 2025-10-28 Listing Removed — BRIGHT MLS
- 2025-10-02 Coming Soon — BRIGHT MLS
- 2025-09-30 Price Changed $22,500 BRIGHT MLS
- 2025-09-26 Price Changed $20,000 BRIGHT MLS
- 2025-09-26 Price Changed $20,000 BRIGHT MLS
- 2025-09-26 Listed $29,900 BRIGHT MLS
- 2025-09-26 Listed $29,900 BRIGHT MLS
- 2025-09-24 Coming Soon — BRIGHT MLS
- 2025-09-24 Coming Soon — BRIGHT MLS
- 2016-06-09 Delisted — MRIS
- 2016-06-09 Listing Removed — BRIGHT MLS
- 2015-11-12 Price Changed — MRIS
- 2015-08-19 Relisted — MRIS
- 2015-07-10 Delisted — MRIS
- 2014-09-18 Listed — MRIS
- 2014-09-18 Listed $799,900 BRIGHT MLS
- 2014-05-29 Delisted — MRIS
- 2013-06-21 Listed — MRIS
- 2013-03-05 Delisted — MRIS
- 2012-07-21 Listed — MRIS
- 2005-01-26 Sold (MLS) $11,000 MRIS
- 2005-01-25 Delisted — MRIS
- 2004-06-19 Listed $12,000 MRIS
- 2002-06-28 Sold (MLS) $20,000 MRIS
- 2002-06-22 Delisted — MRIS
- 2002-01-11 Listed $23,900 MRIS
- 2001-12-01 Sold (MLS) $12,600 MRIS
- 2001-11-29 Delisted — MRIS
- 2001-10-22 Listed $13,500 MRIS
Property tax history
+0.2%/yrLatest (2025): $8,832 · +5.4% YoY. Source: county tax records.
Cash-flow waterfall
monthlySold comps — $/sqft
last 12 mo · ≤1 miLoading sold comps…