28 Partridge Ln · Shrub Oak, NY
Flood risk 1/10 · Minimal
- FEMA flood zone
- X (unshaded)
- Chance of flooding over 30 yrs
- 0.0%
- Est. flood insurance / yr
- $473 – $860
Fire risk 5/10 · Moderate
- Est. fire insurance / yr
- $691 – $1,283
Heat risk 4/10 · Minor
- Hot days now (above 98°F)
- 7 days/yr
- Hot days in 30 yrs
- 14 days/yr
Wind risk 4/10 · Minor
- Chance of severe wind over 30 yrs
- 19.0%
Air-quality risk 3/10 · Minor
- Unhealthy air days now
- 2 days/yr
- Unhealthy air days in 30 yrs
- 4 days/yr
Risk factors via First Street. Map © Google.
Why this score? — see what drove the C- grade
The composite is a weighted blend of 9 inputs, each scored 0–100. Each bar is that input's sub-score; the figure is the points it added to the 100-point composite (weight × sub-score).
- ARV discount +15.0/15.0
- Appreciation +10.0/10.0
- Cash flow +6.9/30.0
- Schools +5.9/10.0
- Livability +3.6/5.0
- 1% rule +2.7/10.0
- Rent growth +2.5/5.0
- Condition / age +2.5/5.0
- DSCR +1.1/10.0
$600,000
🖨 Deal sheet (PDF) 📄 Offer letter ✓ Due diligence
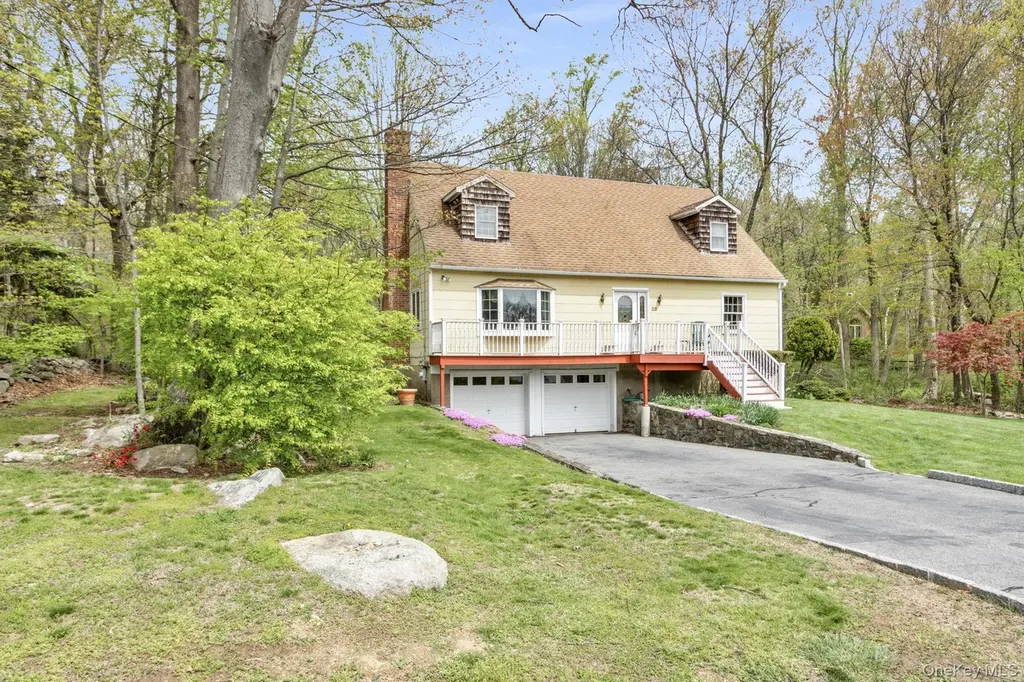
Listing remarks
Welcome home to 28 Partridge Lane, Putnam Valley. Embrace the opportunity to create lasting memories in this serene setting and neighborhood featuring Mahopac Schools. Wonderful Front deck with southern sun exposure. First floor features hardwood floors as seen, Livingroom with brick fireplace, formal dining area, Eat-In Kitchen with walkout to expansive rear deck. There are two bedrooms on this level and updated hall bath. Second floor offers spacious primary bedroom, and another bedroom with updated hall bath. Basement is finished with recreation room, and laundry room. Property is level with large back and front yard. Close to Taconic Parkway and shopping. This family home awaits your pe
Key facts
- Brick fireplace
- Recreation room
- Finished basement
Tags
Property features AI
Exterior
- Parking: 2-car garage
- Utilities: Electric service by NYSEG; Septic tank; Cable connected; Electricity connected
- Home design: Single-family residence
- Construction: Frame construction
- Exterior features: Back yard; Front yard; Level lot; Not waterfront
Interior
- Kitchen: Dishwasher; Electric range; Refrigerator
- Bedrooms: Includes a bedroom on the first floor
- Bathrooms: 2 full bathrooms
- Heating & cooling: Electric heating; Wall/window air conditioning units
- Interior features: First-floor bedroom; First-floor full bath; Ceiling fans; Chandelier; Eat-in kitchen; Partially finished basement; Crawl attic; 7 total rooms
- Laundry & utility: Laundry room; Washer; Dryer; Electric water heater
Neighborhood map
What this means for you Summary
Snapshot
- This is a 4-bed/2.0-bath single-family listed at $600k.
Deal economics
- At list price, monthly cash flow is $-920 ($-11k/yr) — negative.
- To cash-flow at today's rent, offer at most $438k (27.1% below list).
- To meet the 1% rule (rent ≥ 1% of price), the offer needs to be $460k (23.3% below list).
- Recommended offer: $438k (27.1% below list) — sets the bar for cash-flow.
Location & tenants
- Location reads 72/100 on livability (#342 in NY) — a middle-class / working-renter tenant base. Strengths: crime A+, employment A+, housing A+; Watch: amenities F, commute F, cost of living F.
- Mahopac Central School District (suburban): math 61% / reading 65% proficiency, ranked #156 of 590 in NY (top 26%) — acceptable for families but not a draw, mixed tenant base, ~2y average lease; only 8% free/reduced lunch — higher-income household profile.
- Zoned schools: Austin Road Elementary School (math 42% / reading 67%, grade C, #908 of 2,108 statewide, top 46%, 585 students, 22% FRL); Mahopac Middle School (math 56% / reading 70%, grade B+, #129 of 729 statewide, top 18%, 926 students, 24% FRL); Mahopac High School (math 97% / reading 72%, grade A, #379 of 1,100 statewide, top 36%, 1,254 students, 24% FRL) — zoned schools average 23% FRL vs 8% district-wide (16 pts higher); higher-poverty schools than district average — tighter screening recommended.
- Market conditions: 53 active listings in the ZIP; 142 units permitted in Putnam County in 2024 (75 in 5+ unit buildings).
Forward outlook
- In year one you build about $64k of equity ($4k loan paydown + $60k appreciation (10.0% local appreciation)).
- Putnam County population projected to shrink 3% by 2050 — rents likely to lag national; underwrite the cash flow, not the appreciation.
- By year 2, paydown + projected appreciation supports a ~$103k cash-out refi (75% LTV) — recoverable capital for the next deal without selling this one.
Negotiation context
- It's been on market 22 days — a 2% lower offer ($591k) is reasonable based on typical stale-listing flexibility.
- Current owner paid $81k; list at $600k implies a 641% gain — meaningful room to come down on a strong offer.
Risks & watch-outs
- Climate carrying-cost: moderate wildfire risk — expect insurance premiums to compound above CPI over the hold.
Questions for the listing agent
- What do current leases actually rent for vs. the listed asking? Can we see a recent rent roll and the last 12 months of T-12 income?
- Built in 1972 — when were the roof, HVAC, electrical panel, plumbing, and water heater last replaced?
- Is there a deadline driving the sale (1031 exchange, divorce, estate, relocation)? That informs how much negotiation room exists.
- Schools are A-rated — typically a magnet for longer-tenancy family renters. What's the average tenant stay here, and is there a school-zone premium baked into asking?
- What's the average days-on-market for RENTAL listings here right now (not sales)? A rising rental-DOM trend means longer vacancies and softer asking-rent achievability than the comps imply.
- What's the recent tenant-quality profile in this submarket — average credit score on applications, eviction rate, late-payment / NSF rate, and stable-employment percentage? A property-management company in the area should have these aggregated.
- How much new for-sale + rental construction is in the pipeline within 1–3 miles? Heavy new supply typically softens prices + rents 12–24 months out; constrained supply supports both.
Investment metrics
- 1% rule
- 0.77% ✗
- Cap rate
- 4.45%
- Cash-on-cash
- -6.57%
- DSCR
- 0.71
- GRM
- 10.9
CMA / ARV
- ARV (median comp)
- $727,801
- List price
- $600,000
- Delta
- -17.56%
- Verdict
- UNDERPRICED
- Comps
- 19 within 1.0 mi
Show comp detail 3 sales within ~0.75 mi
| Address | Dist | Beds/Ba | Sqft | Sold | Price | $/sf | Match |
|---|---|---|---|---|---|---|---|
| 20 Partridge Ln | 0.08mi | 3/3.0 (-1) | 2,204 (-0%) | 22mo | $775,000 | $352 | 68 |
| 19 Split Rock Rd | 0.61mi | 3/3.0 (-1) | 2,100 (-5%) | 13mo | $620,000 | $295 | 44 |
| 227 Barger St | 0.49mi | 3/2.5 (-1) | 2,000 (-10%) | 17mo | $645,000 | $323 | 40 |
Match score weights: distance 35% · size 25% · config 20% · recency 20%. Top-matched comps best support the ARV.
Projected returns pro-forma
10.0% appreciation · 3.0% rent growth · sell at horizon
- IRR
- 19.7%
- Equity multiple
- 2.60×
- Total profit
- $268,524
- Equity at exit
- $540,528
- IRR
- 18.1%
- Equity multiple
- 5.98×
- Total profit
- $837,459
- Equity at exit
- $1,165,668
Cash invested: $168,000 (down + closing). Projections, not guarantees.
Landlord ↔ Tenant lean methodology
- Overall (STATE)
- 15 Strongly Tenant-Friendly
- State New York
- 15 Strongly Tenant-Friendly · D+10
- County
- — inherits STATE
- City
- — inherits STATE
ZIP-level market 10579
- Home prices YoY
- 4.0%
- Active inventory
- 53
- Price-to-rent
- 10.9×
Monthly cashflow live
- Estimated rent
- $4,604 medium interval (Pro) →
- Mortgage (P&I)
- −$3,146
- Tax from tax record
- −$1,160 /mo · $13,921/yr
- Insurance
- −$250
- HOA
- −$0
- Vacancy / Maint / Mgmt
- −$967
- Net cashflow
- $-920
Break-even live
Sensitivity live
| Price | -10% $-580 | -5% $-750 | +0% $-920 | +5% $-1,089 | +10% $-1,259 |
|---|---|---|---|---|---|
| Rent | -10% $-1,283 | -5% $-1,102 | +0% $-920 | +5% $-738 | +10% $-556 |
| Rate | -1.0pp $-618 | -0.5pp $-767 | base $-920 | +0.5pp $-1,075 | +1.0pp $-1,233 |
UW: 25.0% down · 7.5% · 30yr · 1.5% tax · 5.0% vac · 8.0% maint · 8.0% mgmt
Financing live
Cash to close
- Down payment
- $150,000
- Closing costs
- $18,000
- Reserves months
- —
- Total cash needed
- —
Loan-product check · same deal, 3 products live
Conventional
25% down · 7.5% · 30yr
- Down + closing
- —
- Monthly P&I
- —
- Monthly cashflow
- —
- DSCR
- —
- Eligible?
- —
Personal DTI + credit; lowest rate.
DSCR
20% down · 8.5% · 30yr
- Down + closing
- —
- Monthly P&I
- —
- Monthly cashflow
- —
- DSCR
- —
- Eligible?
- —
No personal income docs; deal must DSCR.
Hard money
10% down · 12.0% · 12mo
- Down + closing
- —
- Monthly P&I
- —
- Monthly cashflow
- —
- DSCR
- —
- Eligible?
- —
Short-term bridge; refi at stabilization.
Listing history 3 events
-
2026-06-12status $600,000 Pending 22 DOM
-
2026-05-01$600,000 Active 757-char remark
-
1981-10-29soldstatus $81,000
ⓘ Source: listings_history table (triggers on properties + properties_extension) + one-shot
backfill from property_details.listing_events for pre-trigger history.
Tax reassessment forecast NY · Partial reset (capped growth)
- Current annual tax
- $13,921 · $1,160/mo
- Projected year-2 tax
- $13,921 · $1,160/mo
- Expected delta
- $0/yr ($0/mo · 0.0%)
ⓘ Screening estimate from a state-policy table — verify with the county assessor before closing.
Climate risk First Street
- Flood 1/10 Low FEMA zone X (unshaded) · 0% chance over 30 yrs
- Wildfire 5/10 Major
- Heat 4/10 Moderate 7 d/yr ≥98°F today · 14 d/yr by 30 yrs out
- Wind 4/10 Moderate 19% chance of damaging wind over 30 yrs
- Air quality 3/10 Moderate 2 unhealthy d/yr today · 4 by 30 yrs out
Nearby sold comps map
Loading sold comps map…
Walkable amenities ~0.75 mi
Loading nearby amenities…
Taxation est. · year 1
- Rental income
- $55,244
- − Mortgage interest
- −$33,609
- − Property taxes
- −$13,921
- − Insurance
- −$3,000
- − Repairs & maintenance
- −$4,420
- − Management
- −$4,420
- − Depreciation
- −$17,455
- Taxable loss
- −$21,580
- Est. tax savings @ 24.0%
- +$5,179
- After-tax cash flow
- $-5,857/yr
For passive investors: Depreciation is non-cash, so a rental often shows a tax loss while cash-flowing — sheltering income. Rental losses are passive: they offset passive income freely, and up to $25,000/yr can offset ordinary (W-2) income if you actively participate and your MAGI is under $100k (phasing out to $0 by $150k); unused losses carry forward. On sale, claimed depreciation is recaptured at up to 25%, and gains may owe capital-gains tax (a 1031 exchange can defer both). Figures are a year-1 estimate at your 24.0% rate — not tax advice; consult a CPA.
Schools (NCES district)
- District
- Mahopac Central School District
- NCES district ID
- 3618120
- Math proficiency
- 61% ▼ -8.00%
- Reading proficiency
- 65% ▲ 3.00%
- Median HH income
- $103,440
- Composite
- 58.66/100
- National rank
- #983
- State rank
- #156 of 590 in NY
Livability — Shrub Oak
- Score
- 72/100
- State rank
- #342
- US rank
- #5781
Category grades
Schools grade is shown separately in the Schools card above.
Census & demographics
- City population
- 3,081
- Population (ZIP)
- 8,825
Population outlook (Putnam County) Hauer SSP2
- Today (2025)
- 99,705 people
- By 2030
- 99,650 · -0.1%
- By 2040
- 98,641 · -1.1%
- By 2050
- 96,348 · -3.4%
- By 2075
- 94,412 · -5.3%
- By 2100
- 88,728 · -11.0%
Race, ethnicity, and origin ACS 2023
- Neighborhood character
- Predominantly White (77%)
- Race & ethnicity
- White 77% Hispanic / Latino 16% Two or more races 6% Asian 3% Black 2%
- Hispanic origin (detail)
- Puerto Rican 8%
- Common ancestry
- Iranian 3% Romanian 3% Italian 2%
- Foreign-born
- 10% · Canada
- Languages at home
- 83% English-only · Spanish 9% Arabic 3% Other Indo-European 2%
Political lean MEDSL · Putnam
- 2024 margin
- R (+13.7) · D 43.2% · R 56.8%
- 2008→2024 swing
- -6.2pp toward R · 2008: -7.5pp · 2024: -13.7pp
- All cycles
- 2024: R+13.7 2020: R+7.9 2016: R+17.8 2012: R+11.2 2008: R+7.5
Not yet ingested
- Civics
- —
Market trends
- HPI YoY
- ▲ 10.42%
- Current HPI
- 269.3211
- Rent YoY
- —
- Metro
- —
- State GDP YoY
- ▲ 2.60%
- F500 in state
- 92
Industry mix (Fortune 500 HQ in NY)
| Industry | F500 HQs | Revenue |
|---|---|---|
| Financial Services | 10 | $950B |
|
||
| Consumer Goods | 9 | $162B |
|
||
| Insurance | 4 | $225B |
|
||
| Telecommunications | 2 | $144B |
|
||
| Pharmaceuticals | 2 | $112B |
|
||
| Media / Entertainment | 2 | $69B |
|
||
Price history
+640.7% since first listed3 events — show timeline
- 2026-06-10 Pending — OneKey® MLS as Distributed by MLS Grid
- 2026-05-01 Listed $600,000 OneKey® MLS as Distributed by MLS Grid
- 1981-10-29 Sold (Public Records) $81,000 Public Records
Property tax history
+11.2%/yrLatest (2025): $13,921 · -3.9% YoY. Source: county tax records.
Cash-flow waterfall
monthlySold comps — $/sqft
last 12 mo · ≤1 miLoading sold comps…