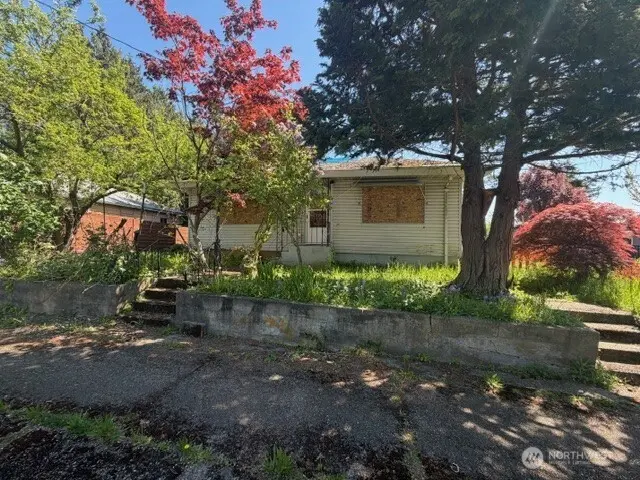
1110 N Rainier Ave · Bremerton, WA
Flood risk 1/10 · Minimal
- FEMA flood zone
- X (unshaded)
- Chance of flooding over 30 yrs
- 0.0%
- Est. flood insurance / yr
- $473 – $860
Fire risk 3/10 · Minor
- Est. fire insurance / yr
- $604 – $1,122
Heat risk 3/10 · Minor
- Hot days now (above 86°F)
- 7 days/yr
- Hot days in 30 yrs
- 14 days/yr
Wind risk 1/10 · Minimal
- Chance of severe wind over 30 yrs
- —
Air-quality risk 7/10 · Major
- Unhealthy air days now
- 10 days/yr
- Unhealthy air days in 30 yrs
- 10 days/yr
Risk factors via First Street. Map © Google.
Why this score? — see what drove the D grade
The composite is a weighted blend of 9 inputs, each scored 0–100. Each bar is that input's sub-score; the figure is the points it added to the 100-point composite (weight × sub-score).
- ARV discount +15.0/15.0
- Cash flow +10.2/30.0
- Livability +4.3/5.0
- Schools +3.9/10.0
- DSCR +2.9/10.0
- 1% rule +2.8/10.0
- Rent growth +2.6/5.0
- Condition / age +2.5/5.0
- Appreciation +0.0/10.0
$245,000
🖨 Deal sheet (PDF) 📄 Offer letter ✓ Due diligence
Listing remarks
Fully prepped heavy fixer in desirable West Bremerton—taken down to the studs and ready for your vision. A true blank slate with interior demo already complete and some updated plumbing in place, saving time and upfront costs. Property sustained collateral impact from a neighboring fire, and with insurance repairs stalled, this creates a rare opportunity to step into a ready-to-build project. No appliances remain, allowing for a clean start. Above-ground oil tank is easily removable—no underground mitigation needed. Existing oil furnace can be removed through the garage, simplifying mechanical updates. Excellent location just blocks from shops, groceries, and coffee on a charmin
Key facts
- 6,098 sq ft lot
- Garage
- Built 1932
Property features AI
Finance
- Other: Zoning: City
- Financial info: Listing terms: Cash or rehab loan
Exterior
- Parking: Attached garage (has garage) with one covered space and two uncovered spaces
- Utilities: Public water (served by City of Bremerton); Sewer connected (City of Bremerton); Electric and oil energy sources (power by PSE)
- Home design: Single-family residence, one story with daylight unfinished basement; House structure; Faces west
- Construction: Built in 1932 (effective year built); Metal/vinyl construction materials; Composition roof; Poured concrete foundation
- Exterior features: Metal/vinyl exterior; Alley access; Curbs and paved streets with sidewalks; Garden space and brush on the property; Gas available at site; Level topography
Interior
- Kitchen: Kitchen without eating space
- Bedrooms: Three bedrooms on the main level
- Flooring: See remarks
- Bathrooms: Two full bathrooms (one on main level, one on lower level)
- Heating & cooling: Forced air heating; No central cooling
- Interior features: Fireplace (wood-burning)
Neighborhood map
What this means for you Summary
Snapshot
- This is a 2-bed/1.0-bath single-family listed at $245k.
Deal economics
- At list price, monthly cash flow is $-139 ($-2k/yr) — negative.
- To cash-flow at today's rent, offer at most $220k (10.0% below list).
- To meet the 1% rule (rent ≥ 1% of price), the offer needs to be $191k (22.2% below list).
- Recommended offer: $191k (22.2% below list) — sets the bar for 1% rule.
- Cap rate 5.6% vs local median 3.5% in Bremerton — top-decile yield for the area; either an underpriced asset or a hidden risk that comps aren't pricing in. Stress-test before assuming the spread holds.
Location & tenants
- Location reads 86/100 on livability (#22 in WA, #431 nationally) — a professional / high-income tenant draw. Strengths: amenities A+, commute A+, housing A+; Watch: crime F.
- Bremerton School District (urban): math 36% / reading 51% proficiency, ranked #194 of 291 in WA (top 67%) — families likely to look elsewhere, expect single-tenant / working-renter base with shorter leases.
- Market conditions: Rents flat; 349 active listings in the ZIP; 40 comparable units currently listed for rent nearby; rentals lingering (median 45d on market — plan ~5-8 weeks vacancy on turnover, expect pricing pressure); 52% of comp listings sitting > 30 days — soft ceiling on asking rent; solid renter incomes; 1,294 units permitted in Kitsap County in 2024 (302 in 5+ unit buildings).
Forward outlook
- Local home prices are declining (-3.0%/yr); year-one equity from $2k of loan paydown is wiped out by about $7k of value loss. Plan a longer hold.
- Kitsap County population projected at +8% by 2050 — modest demand growth; plan on rents tracking national, not racing it.
Negotiation context
- Only 4 days on market — expect competitive offers; lowballing is unlikely to land.
- 5 sale attempts since 23y ago with the ask held roughly flat each time — persistent listings suggest the price (not the market) is what's stuck; bring a comps-based counter.
Risks & watch-outs
- Watch-outs: built in 1932 — expect roof / HVAC / electrical / plumbing capex.
Questions for the listing agent
- What do current leases actually rent for vs. the listed asking? Can we see a recent rent roll and the last 12 months of T-12 income?
- Built in 1932 — when were the roof, HVAC, electrical panel, plumbing, and water heater last replaced?
- Is there a deadline driving the sale (1031 exchange, divorce, estate, relocation)? That informs how much negotiation room exists.
- Schools are B-rated — typically a magnet for longer-tenancy family renters. What's the average tenant stay here, and is there a school-zone premium baked into asking?
- Crime grade is F in this area — have there been break-ins, vandalism, or insurance claims at this property in the last 3 years? What carrier currently insures it and at what premium?
- The area grade is low — what's the realistic commute time and amenity access for the typical tenant pool here? Any planned neighborhood developments (good or bad) we should know about?
- What's the average days-on-market for RENTAL listings here right now (not sales)? A rising rental-DOM trend means longer vacancies and softer asking-rent achievability than the comps imply.
- What's the recent tenant-quality profile in this submarket — average credit score on applications, eviction rate, late-payment / NSF rate, and stable-employment percentage? A property-management company in the area should have these aggregated.
- How much new for-sale + rental construction is in the pipeline within 1–3 miles? Heavy new supply typically softens prices + rents 12–24 months out; constrained supply supports both.
Investment metrics
- 1% rule
- 0.78% ✗
- Cap rate
- 5.61%
- Cash-on-cash
- -2.44%
- DSCR
- 0.89
- GRM
- 10.7
CMA / ARV
- ARV (median comp)
- $395,471
- List price
- $245,000
- Delta
- -38.05%
- Verdict
- UNDERPRICED
- Comps
- 20 within 1.0 mi
Show comp detail 12 sales within ~0.75 mi
| Address | Dist | Beds/Ba | Sqft | Sold | Price | $/sf | Match |
|---|---|---|---|---|---|---|---|
| 1146 N Callow Ave | 0.13mi | 2/1.0 | 1,026 (+1%) | 7mo | $315,000 | $307 | 86 |
| 2013 8th St | 0.31mi | 2/1.0 | 1,017 (+0%) | 5mo | $357,000 | $351 | 81 |
| 1134 N Callow Ave | 0.11mi | 2/1.0 | 1,072 (+6%) | 6mo | $390,000 | $364 | 81 |
| 1329 N Cambrian Ave | 0.28mi | 2/1.0 | 954 (-6%) | 0mo | $350,000 | $367 | 77 |
| 340 Bryan Ave | 0.32mi | 2/1.0 | 1,045 (+3%) | 10mo | $350,000 | $335 | 72 |
| 1522 N Cambrian Ave | 0.35mi | 3/1.0 (+1) | 1,048 (+3%) | 4mo | $325,000 | $310 | 70 |
| 1314 N Callow Ave | 0.16mi | 2/1.0 | 1,118 (+10%) | 10mo | $380,000 | $340 | 68 |
| 1612 Arvon Ave | 0.36mi | 3/2.0 (+1) | 1,036 (+2%) | 9mo | $415,000 | $401 | 64 |
| 1727 6th St | 0.50mi | 2/1.0 | 1,098 (+8%) | 10mo | $355,000 | $323 | 55 |
| 1515 9th St | 0.55mi | 2/1.0 | 896 (-12%) | 5mo | $286,000 | $319 | 50 |
| 1546 Marguerite Ave | 0.46mi | 3/1.5 (+1) | 1,138 (+12%) | 9mo | $365,000 | $321 | 44 |
| 1543 High Ave | 0.55mi | 2/2.0 | 1,146 (+13%) | 7mo | $399,000 | $348 | 43 |
Match score weights: distance 35% · size 25% · config 20% · recency 20%. Top-matched comps best support the ARV.
Projected returns pro-forma
-3.0% appreciation · 0.28% rent growth · sell at horizon
- IRR
- -23.3%
- Equity multiple
- 0.22×
- Total profit
- $-53,653
- Equity at exit
- $36,530
- IRR
- -27.2%
- Equity multiple
- -0.14×
- Total profit
- $-77,883
- Equity at exit
- $21,183
Cash invested: $68,600 (down + closing). Projections, not guarantees.
Landlord ↔ Tenant lean methodology
- Overall (STATE)
- 28 Tenant-Leaning
- State Washington
- 28 Tenant-Leaning · D+8
- County
- — inherits STATE
- City
- — inherits STATE
ZIP-level market 98312
- Rents YoY
- 0.3%
- Active inventory
- 349
- Price-to-rent
- 10.7×
Monthly cashflow live
- Estimated rent
- $1,906 high interval (Pro) →
- Mortgage (P&I)
- −$1,285
- Tax from tax record
- −$258 /mo · $3,096/yr
- Insurance
- −$102
- HOA
- −$0
- Vacancy / Maint / Mgmt
- −$400
- Net cashflow
- $-139
Break-even live
Sensitivity live
| Price | -10% $-1 | -5% $-70 | +0% $-139 | +5% $-209 | +10% $-278 |
|---|---|---|---|---|---|
| Rent | -10% $-290 | -5% $-215 | +0% $-139 | +5% $-64 | +10% $11 |
| Rate | -1.0pp $-16 | -0.5pp $-77 | base $-139 | +0.5pp $-203 | +1.0pp $-267 |
UW: 25.0% down · 7.5% · 30yr · 1.5% tax · 5.0% vac · 8.0% maint · 8.0% mgmt
Financing live
Cash to close
- Down payment
- $61,250
- Closing costs
- $7,350
- Reserves months
- —
- Total cash needed
- —
Loan-product check · same deal, 3 products live
Conventional
25% down · 7.5% · 30yr
- Down + closing
- —
- Monthly P&I
- —
- Monthly cashflow
- —
- DSCR
- —
- Eligible?
- —
Personal DTI + credit; lowest rate.
DSCR
20% down · 8.5% · 30yr
- Down + closing
- —
- Monthly P&I
- —
- Monthly cashflow
- —
- DSCR
- —
- Eligible?
- —
No personal income docs; deal must DSCR.
Hard money
10% down · 12.0% · 12mo
- Down + closing
- —
- Monthly P&I
- —
- Monthly cashflow
- —
- DSCR
- —
- Eligible?
- —
Short-term bridge; refi at stabilization.
Rent comps 40 comps
| Address | Beds | Baths | Sqft | Rent | $/sqft | DOM | Units | Dist |
|---|---|---|---|---|---|---|---|---|
| 1134 Rainier Ave Bremerton, WA | 2.0 | 1.0 | 1175 | $2,000 | $1.70 | 44d | 1 | 0.09mi |
| 2127 12th St Unit C207 Bremerton, WA | 2.0 | 1.0 | 800 | $1,495 | $1.87 | 14d | 1 | 0.16mi |
| 2127 12th St Bremerton, WA | 2.0 | 1.0 | 800 | $1,595 | $1.99 | 44d | 1 | 0.16mi |
| 2127 12th St Unit A208 Bremerton, WA | 2.0 | 1.0 | 800 | $1,450 | $1.81 | 22d | 1 | 0.16mi |
| 2127 12th St Bremerton, WA | 2.0 | 1.0 | 800 | $1,500 | $1.88 | 22d | 1 | 0.16mi |
| 2106 7th St Bremerton, WA | 2.0 | 2.0 | 1040 | $2,450 | $2.36 | 44d | 1 | 0.27mi |
| 1117 Marguerite Ave Bremerton, WA | 3.0 | 2.5 | 1404 | $2,875 | $2.05 | 44d | 1 | 0.31mi |
| 1708 Houston Ave Bremerton, WA | 3.0 | 1.0 | 854 | $1,750 | $2.05 | 14d | 1 | 0.40mi |
| 1720 N Wycoff Ave Bremerton, WA | 3.0 | 2.0 | 1300 | $2,400 | $1.85 | 44d | 1 | 0.45mi |
| 1720 N Wycoff Ave Unit 2 Bremerton, WA | 3.0 | 2.0 | 1100 | $2,100 | $1.91 | 14d | 1 | 0.45mi |
| 1720 Olympic Ave Bremerton, WA | 3.0 | 1.0 | 855 | $2,100 | $2.46 | 44d | 1 | 0.48mi |
| 1742 Anderson St Bremerton, WA | 3.0 | 1.0 | 855 | $1,899 | $2.22 | 44d | 1 | 0.50mi |
| 1736 4th St Bremerton, WA | 2.0 | 1.0 | 1035 | $1,700 | $1.64 | 44d | 1 | 0.51mi |
| 1604 Naval Ave Bremerton, WA | 2.0 | 2.0 | 1065 | $1,850 | $1.74 | 22d | 2 | 0.51mi |
| 1588 Naval Ave #10 Bremerton, WA | 2.0 | 2.0 | 972 | $1,450 | $1.49 | 44d | 1 | 0.52mi |
| 1903 Burwell St Unit 2 Bremerton, WA | 2.0 | 1.0 | 858 | $1,895 | $2.21 | 22d | 1 | 0.54mi |
| 629 Adele Ave Unit B Bremerton, WA | 2.0 | 1.0 | 960 | $1,750 | $1.82 | 44d | 1 | 0.60mi |
| 1222 9th St Bremerton, WA | 3.0 | 1.0 | 1072 | $2,000 | $1.87 | 44d | 1 | 0.67mi |
| 1208 10th St Bremerton, WA | 2.0 | 1.0 | 950 | $1,850 | $1.95 | 44d | 1 | 0.70mi |
| 814 Chester Ave Unit B Bremerton, WA | 1.0 | 1.0 | 782 | $1,400 | $1.79 | 22d | 1 | 0.74mi |
| 500 N National Ave Bremerton, WA | 1.0–2.0 | 2.0–3.0 | 1095 | $2,150 | $1.96 | 44d | 2 | 0.80mi |
| 1225 Gregory Way Unit 1/2 Bremerton, WA | 2.0 | 1.0 | 1500 | $3,500 | $2.33 | 44d | 1 | 0.82mi |
| 317 S Hartford Ave Bremerton, WA | 2.0 | 1.0 | 1333 | $1,900 | $1.43 | 14d | 1 | 0.88mi |
| 3106 Farragut St Bremerton, WA | 2.0 | 1.0 | 944 | $2,000 | $2.12 | 44d | 1 | 0.88mi |
| 3202 Farragut Ave Unit 2 Bremerton, WA | 3.0 | 2.0 | 1226 | $2,450 | $2.00 | 44d | 1 | 0.90mi |
| 3202 Farragut Ave Unit 2 Bremerton, WA | 3.0 | 2.0 | 1226 | $2,450 | $2.00 | 22d | 1 | 0.90mi |
| 1010 Burwell St Bremerton, WA | 1.0–2.0 | 1.0 | 719 | $2,100 | $2.92 | 44d | 4 | 0.91mi |
| 1729 Rocky Point Rd NW Bremerton, WA | 2.0 | 1.5 | 968 | $2,200 | $2.27 | 22d | 1 | 0.92mi |
| 500 Lebo Blvd Apt 305 Bremerton, WA | 1.0 | 1.0 | 733 | $1,450 | $1.98 | 14d | 1 | 1.13mi |
| 500 Lebo Blvd Apt 205 Bremerton, WA | 1.0 | 1.0 | 733 | $1,425 | $1.94 | 22d | 1 | 1.13mi |
| 500 Lebo Blvd Apt 301 Bremerton, WA | 1.0 | 1.0 | 733 | $1,475 | $2.01 | 14d | 1 | 1.13mi |
| 500 Lebo Blvd Apt 205 Bremerton, WA | 1.0 | 1.0 | 733 | $1,450 | $1.98 | 44d | 1 | 1.13mi |
| 500 Lebo Blvd Unit 105 Bremerton, WA | 1.0 | 1.0 | 733 | $1,375 | $1.88 | 45d | 1 | 1.13mi |
| 500 Lebo Blvd Unit 102 Bremerton, WA | 1.0 | 1.0 | 733 | $1,400 | $1.91 | 44d | 1 | 1.13mi |
| 500 Lebo Blvd Unit 304 Bremerton, WA | 2.0 | 1.0 | 917 | $1,600 | $1.74 | 22d | 1 | 1.13mi |
| 2733 Hefner Ave Unit 2733 Bremerton, WA | 3.0 | 1.0 | 874 | $1,900 | $2.17 | 14d | 1 | 1.15mi |
| 550 Lebo Blvd Bremerton, WA | 1.0 | 1.0 | 1000 | $1,550 | $1.55 | 14d | 1 | 1.16mi |
| 500 S National Ave #28 Bremerton, WA | 1.0 | 2.5 | 1108 | $1,950 | $1.76 | 14d | 1 | 1.19mi |
| 657 Highland Ave Bremerton, WA | 3.0 | 1.0 | 1014 | $2,200 | $2.17 | 44d | 1 | 1.22mi |
| 4520 Bay Vista Blvd Bremerton, WA | 1.0–3.0 | 1.0–2.0 | 927 | $2,362 | $2.55 | 14d | 9 | 1.23mi |
Listing history 19 events
-
2026-05-08status Pending
-
2026-05-05status Active
-
2026-04-30status Pending
-
2026-04-29$245,000 Active
-
2008-01-11historical
-
2008-01-10soldstatus $225,000 Sold
-
2008-01-09soldstatus $225,000
-
2008-01-04historical
-
2007-11-02price $229,000
-
2007-10-04price $235,000
-
2007-09-11$240,000
-
2006-07-05soldstatus $206,500
-
2006-07-05soldstatus $206,500
-
2006-05-22$206,000
-
2003-05-29soldstatus $121,000
-
2003-05-29soldstatus $121,000
-
2003-03-17$119,000
-
1997-03-10soldstatus $87,550
-
1996-05-01soldstatus $71,500
ⓘ Source: listings_history table (triggers on properties + properties_extension) + one-shot
backfill from property_details.listing_events for pre-trigger history.
Tax reassessment forecast WA · Resets to sale price
- Current annual tax
- $3,096 · $258/mo
- Projected year-2 tax
- $3,096 · $258/mo
- Expected delta
- $0/yr ($0/mo · 0.0%)
ⓘ Screening estimate from a state-policy table — verify with the county assessor before closing.
Climate risk First Street
- Flood 1/10 Low FEMA zone X (unshaded) · 0% chance over 30 yrs
- Wildfire 3/10 Moderate
- Heat 3/10 Moderate 7 d/yr ≥86°F today · 14 d/yr by 30 yrs out
- Wind 1/10 Low
- Air quality 7/10 Severe 10 unhealthy d/yr today · 10 by 30 yrs out
Nearby sold comps map
Loading sold comps map…
Walkable amenities ~0.75 mi
Loading nearby amenities…
Taxation est. · year 1
- Rental income
- $22,870
- − Mortgage interest
- −$13,724
- − Property taxes
- −$3,096
- − Insurance
- −$1,225
- − Repairs & maintenance
- −$1,830
- − Management
- −$1,830
- − Depreciation
- −$7,127
- Taxable loss
- −$5,962
- Est. tax savings @ 24.0%
- +$1,431
- After-tax cash flow
- $-241/yr
For passive investors: Depreciation is non-cash, so a rental often shows a tax loss while cash-flowing — sheltering income. Rental losses are passive: they offset passive income freely, and up to $25,000/yr can offset ordinary (W-2) income if you actively participate and your MAGI is under $100k (phasing out to $0 by $150k); unused losses carry forward. On sale, claimed depreciation is recaptured at up to 25%, and gains may owe capital-gains tax (a 1031 exchange can defer both). Figures are a year-1 estimate at your 24.0% rate — not tax advice; consult a CPA.
Schools (NCES district)
- District
- Bremerton School District
- NCES district ID
- 5300660
- Math proficiency
- 36% ▼ -3.00%
- Reading proficiency
- 51% ▲ 1.00%
- Median HH income
- $46,765
- Composite
- 39.34/100
- National rank
- #8163
- State rank
- #194 of 291 in WA
Livability — Bremerton
- Score
- 86/100
- State rank
- #22
- US rank
- #431
Category grades
Schools grade is shown separately in the Schools card above.
Census & demographics
- Census place
- Bremerton, WA
- County
- Kitsap County · 243,099 people
- City population
- 94,488
- Metro
- Bremerton-Silverdale-Port Orchard, WA
- Population (ZIP)
- 36,307
- Household income
- $90,449
- Rent vs Own
- Severe rent burden
- 993.0
Population outlook (Kitsap County) Hauer SSP2
- Today (2025)
- 277,525 people
- By 2030
- 285,040 · +2.7%
- By 2040
- 294,957 · +6.3%
- By 2050
- 300,622 · +8.3%
- By 2075
- 315,580 · +13.7%
- By 2100
- 304,340 · +9.7%
Race, ethnicity, and origin ACS 2023
- Neighborhood character
- Predominantly White (68%)
- Race & ethnicity
- White 68% Two or more races 13% Hispanic / Latino 12% Asian 4% Black 4% Native American 1%
- Hispanic origin (detail)
- Mexican 6% Puerto Rican 1%
- Common ancestry
- Italian 7% Portuguese 5% Slovak 4%
- Foreign-born
- 6% · Canada, China
- Languages at home
- 91% English-only · Spanish 4% Tagalog/Filipino 2% Other Asian/Pacific 1%
Political lean MEDSL · Kitsap
- 2024 margin
- Strong D (+20.9) · D 58.8% · R 37.9% · Other 3.3%
- 2008→2024 swing
- +8.6pp toward D · 2008: 12.3pp · 2024: 20.9pp
- All cycles
- 2024: D+20.9 2020: D+18.1 2016: D+11.6 2012: D+11.1 2008: D+12.3
Not yet ingested
- Civics
- —
Market trends
- HPI YoY
- ▼ -436.68%
- Current HPI
- 379.2342
- Rent YoY
- ▲ 0.28%
- Metro
- Bremerton-Silverdale-Port Orchard, WA
- State GDP YoY
- ▲ 4.65%
- F500 in state
- 22
Industry mix (Fortune 500 HQ in WA)
| Industry | F500 HQs | Revenue |
|---|---|---|
| Retail | 2 | $269B |
|
||
| Technology / Retail | 1 | $638B |
|
||
| Technology | 1 | $245B |
|
||
| Telecommunications | 1 | $38B |
|
||
| Food / Beverage | 1 | $36B |
|
||
| Automotive / Trucks | 1 | $34B |
|
||
Price history
+348.0% since first listed21 events — show timeline
- 2026-06-05 Sold (Public Records) $320,312 Public Records
- 2026-06-05 Sold (MLS) $245,000 NWMLS as Distributed by MLS Grid
- 2026-05-08 Pending — NWMLS as Distributed by MLS Grid
- 2026-05-05 Relisted — NWMLS as Distributed by MLS Grid
- 2026-04-30 Pending — NWMLS as Distributed by MLS Grid
- 2026-04-29 Listed $245,000 NWMLS as Distributed by MLS Grid
- 2008-01-11 Delisted — NWMLS as Distributed by MLS Grid
- 2008-01-10 Sold (MLS) $225,000 NWMLS as Distributed by MLS Grid
- 2008-01-09 Sold (Public Records) $225,000 Public Records
- 2008-01-04 Contingent — NWMLS as Distributed by MLS Grid
- 2007-11-02 Price Changed $229,000 NWMLS as Distributed by MLS Grid
- 2007-10-04 Price Changed $235,000 NWMLS as Distributed by MLS Grid
- 2007-09-11 Listed $240,000 NWMLS as Distributed by MLS Grid
- 2006-07-05 Sold (Public Records) $206,500 Public Records
- 2006-07-05 Sold (MLS) $206,500 NWMLS as Distributed by MLS Grid
- 2006-05-22 Listed $206,000 NWMLS as Distributed by MLS Grid
- 2003-05-29 Sold (Public Records) $121,000 Public Records
- 2003-05-29 Sold (MLS) $121,000 NWMLS as Distributed by MLS Grid
- 2003-03-17 Listed $119,000 NWMLS as Distributed by MLS Grid
- 1997-03-10 Sold (Public Records) $87,550 Public Records
- 1996-05-01 Sold (Public Records) $71,500 Public Records
Property tax history
+3.4%/yrLatest (2026): $3,096 · +0.5% YoY. Source: county tax records.
Cash-flow waterfall
monthlySold comps — $/sqft
last 12 mo · ≤1 miLoading sold comps…