1805 Manor Cir · Rosenberg, TX
Flood risk 1/10 · Minimal
- FEMA flood zone
- X (unshaded)
- Chance of flooding over 30 yrs
- 0.0%
- Est. flood insurance / yr
- $507 – $1,088
Fire risk 3/10 · Minor
- Est. fire insurance / yr
- $1,222 – $2,270
Heat risk 9/10 · Severe
- Hot days now (above 110°F)
- 7 days/yr
- Hot days in 30 yrs
- 23 days/yr
Wind risk 9/10 · Severe
- Chance of severe wind over 30 yrs
- 99.0%
Air-quality risk 2/10 · Minimal
- Unhealthy air days now
- 1 days/yr
- Unhealthy air days in 30 yrs
- 1 days/yr
Risk factors via First Street. Map © Google.
Why this score? — see what drove the D+ grade
The composite is a weighted blend of 9 inputs, each scored 0–100. Each bar is that input's sub-score; the figure is the points it added to the 100-point composite (weight × sub-score).
- ARV discount +15.0/15.0
- Cash flow +11.2/30.0
- 1% rule +4.8/10.0
- Schools +4.6/10.0
- DSCR +3.3/10.0
- Livability +3.1/5.0
- Condition / age +2.5/5.0
- Rent growth +2.3/5.0
- Appreciation +0.0/10.0
$234,900
🖨 Deal sheet 📄 Offer letter ✓ Due diligence
Listing remarks
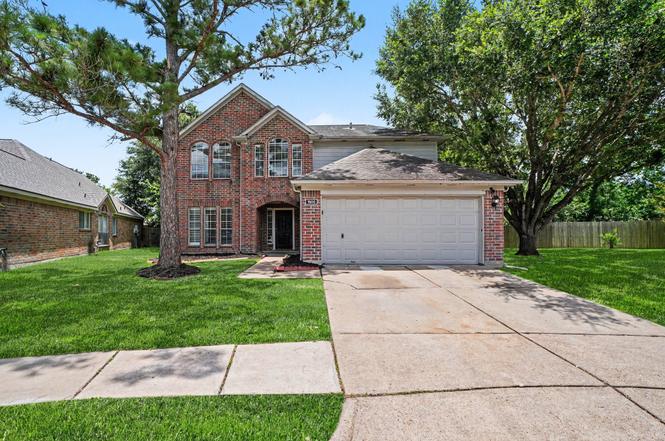
This 5-bedroom, 3.5-bathroom two-story home is situated on a quiet cul-de-sac and features a durable brick and Hardie Plank exterior, an attached 2-car garage, and a rear patio pad. Being sold as-is and needing some TLC, this property represents a fantastic equity-building opportunity with a highly desirable multi-generational layout. The first floor opens to a foyer with a convenient laundry mudroom and a rare main-floor guest bedroom featuring a full en-suite bath. The rear of the main level boasts a spacious open-concept design where the kitchen, equipped with laminate countertops and a mix of stainless and black appliances, flows seamlessly into the dining area and a family room anchore
Key facts
- Rear patio pad
- Open-concept design
- Laminate countertops
Tags
Property features AI
Finance
- Other: Municipal Utility District disclosure available
- HOA & community: Part of Villages of Town Center Owners Association; Annual association fee of $595
Exterior
- Parking: Attached 2-car garage
- Utilities: Public water; Public sewer; Asphalt road access
- Home design: Residential property; Faces west; Entry on slab foundation
- Construction: Brick construction; Composition roof; Built in 1997; Slab foundation
- Exterior features: Private yard; Subdivision lot
Interior
- Kitchen: Convection oven; Gas oven; Gas range; Microwave; Dishwasher; Refrigerator
- Flooring: Carpet; Tile; Vinyl
- Bathrooms: 3 full bathrooms; 1 half bathroom
- Heating & cooling: Central heating (gas); Central air conditioning (electric)
- Interior features: Double vanity; Laminate countertops; Separate shower; One fireplace; 8 total rooms
Neighborhood map
What this means for you Summary
Snapshot
- This is a 4-bed/3.0-bath single-family listed at $235k.
Deal economics
- At list price, monthly cash flow is $-90 ($-1k/yr) — negative.
- To cash-flow at today's rent, offer at most $219k (6.7% below list).
- To meet the 1% rule (rent ≥ 1% of price), the offer needs to be $230k (2.2% below list).
- Recommended offer: $219k (6.7% below list) — sets the bar for cash-flow.
- Cap rate 5.8% vs local median 3.4% in Rosenberg — top-decile yield for the area; either an underpriced asset or a hidden risk that comps aren't pricing in. Stress-test before assuming the spread holds.
Location & tenants
- Location reads 62/100 on livability (#922 in TX) — a middle-class / working-renter tenant base. Strengths: cost of living A+, housing A+, crime B; Watch: schools D-, amenities F, commute F.
- Lamar CISD (suburban): math 50% / reading 53% proficiency, ranked #116 of 826 in TX (top 14%) — acceptable for families but not a draw, mixed tenant base, ~2y average lease.
- Market conditions: Rents soft (-1.0%/yr); 716 active listings in the ZIP; 7 comparable units currently listed for rent nearby; rentals at typical pace (median 24d on market — plan ~3-4 weeks tenant-placement turnaround); 43% of comp listings sitting > 30 days — soft ceiling on asking rent; 12,093 units permitted in Fort Bend County in 2024 (815 in 5+ unit buildings).
- This rent runs 38% of the median local income ($73k/yr) — at the standard rent-burdened threshold; future hikes will face affordability resistance.
Forward outlook
- Local home prices are declining (-3.0%/yr); year-one equity from $2k of loan paydown is wiped out by about $7k of value loss. Plan a longer hold.
- Fort Bend County population projected at +75% by 2050 — long-run rental-demand tailwind backs the buy-and-hold thesis.
Negotiation context
- Only 3 days on market — expect competitive offers; lowballing is unlikely to land.
Risks & watch-outs
- Watch-outs: property tax is 2.7% of price.
- Climate carrying-cost: severe wind risk, 99% chance of damaging wind over 30y; extreme-heat days projected 7→23/yr by 2055 (HVAC capex compounding) — expect insurance premiums to compound above CPI over the hold.
Questions for the listing agent
- What do current leases actually rent for vs. the listed asking? Can we see a recent rent roll and the last 12 months of T-12 income?
- Property tax is high relative to price — has the assessment been appealed recently, and will the sale trigger a re-assessment?
- What does the HOA fee cover, when was the last increase, and are there any pending special assessments or reserve-fund shortfalls?
- Is there a deadline driving the sale (1031 exchange, divorce, estate, relocation)? That informs how much negotiation room exists.
- Schools are D-rated, which usually means shorter tenancies and higher turnover. Who's the typical renter profile here, and what's been the actual vacancy rate?
- The area grade is low — what's the realistic commute time and amenity access for the typical tenant pool here? Any planned neighborhood developments (good or bad) we should know about?
- What's the average days-on-market for RENTAL listings here right now (not sales)? A rising rental-DOM trend means longer vacancies and softer asking-rent achievability than the comps imply.
- What's the recent tenant-quality profile in this submarket — average credit score on applications, eviction rate, late-payment / NSF rate, and stable-employment percentage? A property-management company in the area should have these aggregated.
- How much new for-sale + rental construction is in the pipeline within 1–3 miles? Heavy new supply typically softens prices + rents 12–24 months out; constrained supply supports both.
Investment metrics
- 1% rule
- 0.98% ✗
- Cap rate
- 5.83%
- Cash-on-cash
- -1.64%
- DSCR
- 0.93
- GRM
- 8.5
CMA / ARV
- ARV (on-the-fly)
- $295,446
- Comps found
- 12
Show comp detail 12 sales within ~0.75 mi
| Address | Dist | Beds/Ba | Sqft | Sold | Price | $/sf | Match |
|---|---|---|---|---|---|---|---|
| 1205 Moray Dr | 0.38mi | 4/2.5 | 2,442 (+2%) | 3mo | $270,000 | $111 | 75 |
| 4801 E Columbary Dr | 0.25mi | 5/2.5 (+1) | 2,502 (+4%) | 2mo | $309,900 | $124 | 72 |
| 5121 Alderney Ct | 0.45mi | 3/2.5 (-1) | 2,442 (+2%) | 2mo | $275,000 | $113 | 67 |
| 1606 Caslyn Dr | 0.13mi | 4/2.0 | 2,112 (-12%) | 8mo | $299,000 | $142 | 63 |
| 1711 Village Court Ln | 0.10mi | 5/2.5 (+1) | 2,669 (+11%) | 10mo | $300,000 | $112 | 62 |
| 5013 Cotter Ln | 0.25mi | 4/2.0 | 2,210 (-8%) | 13mo | $298,000 | $135 | 61 |
| 4707 E Parma Dr | 0.40mi | 5/3.0 (+1) | 2,594 (+8%) | 4mo | $295,000 | $114 | 60 |
| 1230 Law Ct | 0.58mi | 4/2.0 | 2,317 (-4%) | 6mo | $285,000 | $123 | 58 |
| 3433 Avenue P | 0.71mi | 4/2.0 | 2,478 (+3%) | 6mo | $288,000 | $116 | 52 |
| 2123 Moss Bluff Lane Ln | 0.74mi | 4/2.5 | 2,491 (+4%) | 7mo | $313,000 | $126 | 51 |
| 1317 Tobola St | 0.75mi | 4/2.0 | 2,568 (+7%) | 5mo | $160,000 | $62 | 45 |
| 1402 Divin Dr | 0.47mi | 3/2.5 (-1) | 2,074 (-14%) | 14mo | $289,500 | $140 | 37 |
Match score weights: distance 35% · size 25% · config 20% · recency 20%. Top-matched comps best support the ARV.
Projected returns pro-forma
-3.0% appreciation · 0.0% rent growth · sell at horizon
- IRR
- -23.0%
- Equity multiple
- 0.24×
- Total profit
- $-50,299
- Equity at exit
- $35,024
- IRR
- -30.8%
- Equity multiple
- -0.16×
- Total profit
- $-76,330
- Equity at exit
- $20,310
Cash invested: $65,772 (down + closing). Projections, not guarantees.
Landlord ↔ Tenant lean methodology
- Overall (STATE)
- 87 Strongly Landlord-Friendly
- State Texas
- 87 Strongly Landlord-Friendly · R+5
- County
- — inherits STATE
- City
- — inherits STATE
ZIP-level market 77471
- Home prices YoY
- -19.3%
- Rents YoY
- -1.0%
- Active inventory
- 716
- Price-to-rent
- 8.5×
Monthly cashflow live
- Estimated rent
- $2,298 high interval (Pro) →
- Mortgage (P&I)
- −$1,232
- Tax from tax record
- −$525 /mo · $6,301/yr
- Insurance
- −$98
- HOA
- −$50
- Vacancy / Maint / Mgmt
- −$483
- Net cashflow
- $-90
Break-even live
UW: 25.0% down · 7.5% · 30yr · 1.5% tax · 5.0% vac · 8.0% maint · 8.0% mgmt
Financing live
Cash to close
- Down payment
- $58,725
- Closing costs
- $7,047
- Reserves months
- —
- Total cash needed
- —
Loan-product check · same deal, 3 products live
Conventional
25% down · 7.5% · 30yr
- Down + closing
- —
- Monthly P&I
- —
- Monthly cashflow
- —
- DSCR
- —
- Eligible?
- —
Personal DTI + credit; lowest rate.
DSCR
20% down · 8.5% · 30yr
- Down + closing
- —
- Monthly P&I
- —
- Monthly cashflow
- —
- DSCR
- —
- Eligible?
- —
No personal income docs; deal must DSCR.
Hard money
10% down · 12.0% · 12mo
- Down + closing
- —
- Monthly P&I
- —
- Monthly cashflow
- —
- DSCR
- —
- Eligible?
- —
Short-term bridge; refi at stabilization.
Rent comps 7 comps
| Address | Beds | Baths | Sqft | Rent | $/sqft | DOM | Units | Dist |
|---|---|---|---|---|---|---|---|---|
| 5003 E Parma Dr Rosenberg, TX | 4.0 | 3.0 | 2442 | $2,250 | $0.92 | 43d | 1 | 0.45mi |
| 1317 Tobola St Rosenberg, TX | 4.0 | 3.0 | 2568 | $2,995 | $1.17 | 5d | 1 | 0.76mi |
| 2122 Hackberry Bank Ln Rosenberg, TX | 3.0 | 2.0 | 1620 | $1,799 | $1.11 | 3d | 1 | 0.87mi |
| 1803 Cypress Dr Richmond, TX | 3.0 | 2.0 | 1601 | $1,875 | $1.17 | 24d | 1 | 1.11mi |
| 2020 Ward St Rosenberg, TX | 3.0 | 2.0 | 1748 | $1,850 | $1.06 | 43d | 1 | 1.16mi |
| 1308 Wilson Dr Rosenberg, TX | 3.0 | 2.0 | 1835 | $2,171 | $1.18 | 43d | 1 | 1.44mi |
| 7404 Town Center Blvd Rosenberg, TX | 3.0 | 1.0–2.0 | 1078 | $1,989 | $1.85 | 3d | 24 | 1.48mi |
HOA detail
- Monthly dues
- $50 · $600/yr
Listing history 4 events
-
2026-06-18days on market $234,900 Active 3 DOM
-
2026-06-17days on market $234,900 Active 2 DOM
-
2026-06-15remarks 699-char remark
-
2026-06-15$234,900 Active 1 DOM
ⓘ Source: listings_history table (triggers on properties + properties_extension) + one-shot
backfill from property_details.listing_events for pre-trigger history.
Tax reassessment forecast TX · Resets to sale price
- Current annual tax
- $6,301 · $525/mo
- Projected year-2 tax
- $6,301 · $525/mo
- Expected delta
- $0/yr ($0/mo · 0.0%)
ⓘ Screening estimate from a state-policy table — verify with the county assessor before closing.
Climate risk First Street
- Flood 1/10 Low FEMA zone X (unshaded) · 0% chance over 30 yrs
- Wildfire 3/10 Moderate
- Heat 9/10 Extreme 7 d/yr ≥110°F today · 23 d/yr by 30 yrs out
- Wind 9/10 Extreme 99% chance of damaging wind over 30 yrs
- Air quality 2/10 Low 1 unhealthy d/yr today · 1 by 30 yrs out
Nearby sold comps map
Loading sold comps map…
Walkable amenities ~0.75 mi
Loading nearby amenities…
Taxation est. · year 1
- Rental income
- $27,572
- − Mortgage interest
- −$13,158
- − Property taxes
- −$6,301
- − Insurance
- −$1,174
- − Repairs & maintenance
- −$2,206
- − Management
- −$2,206
- − HOA
- −$600
- − Depreciation
- −$6,833
- Taxable loss
- −$4,907
- Est. tax savings @ 24.0%
- +$1,178
- After-tax cash flow
- $102/yr
For passive investors: Depreciation is non-cash, so a rental often shows a tax loss while cash-flowing — sheltering income. Rental losses are passive: they offset passive income freely, and up to $25,000/yr can offset ordinary (W-2) income if you actively participate and your MAGI is under $100k (phasing out to $0 by $150k); unused losses carry forward. On sale, claimed depreciation is recaptured at up to 25%, and gains may owe capital-gains tax (a 1031 exchange can defer both). Figures are a year-1 estimate at your 24.0% rate — not tax advice; consult a CPA.
Schools (NCES district)
- District
- Lamar CISD
- NCES district ID
- 4826580
- Math proficiency
- 50% ▼ -12.00%
- Reading proficiency
- 53% ▼ -4.00%
- Median HH income
- $75,213
- Composite
- 46.43/100
- National rank
- #2452
- State rank
- #116 of 826 in TX
Livability — Rosenberg
- Score
- 62/100
- State rank
- #922
- US rank
- #16414
Category grades
Schools grade is shown separately in the Schools card above.
Census & demographics
- Census place
- Rosenberg, TX
- County
- Fort Bend County · 836,777 people
- City population
- 115,151
- Metro
- Houston-The Woodlands-Sugar Land, TX
- Population (ZIP)
- 45,325
- Household income
- $73,186
- Rent vs Own
- Severe rent burden
- 1688.0
Population outlook (Fort Bend County) Hauer SSP2
- Today (2025)
- 1,004,526 people
- By 2030
- 1,153,104 · +14.8%
- By 2040
- 1,453,718 · +44.7%
- By 2050
- 1,753,781 · +74.6%
- By 2075
- 2,455,772 · +144.5%
- By 2100
- 2,930,528 · +191.7%
Race, ethnicity, and origin ACS 2023
- Neighborhood character
- Diverse neighborhood (Simpson 0.61)
- Race & ethnicity
- Hispanic / Latino 56% White 23% Two or more races 21% Black 12% Asian 7%
- Hispanic origin (detail)
- Mexican 46%
- Common ancestry
- Romanian 1% Lithuanian 1% Slovak 1%
- Foreign-born
- 18% · Canada, China, Vietnam
- Languages at home
- 57% English-only · Spanish 35% Tagalog/Filipino 2% Other Indo-European 1%
Political lean MEDSL · Fort Bend
- 2024 margin
- Toss-up / Even · D 49.5% · R 47.9% · Other 2.6%
- 2008→2024 swing
- +4.0pp toward D · 2008: -2.4pp · 2024: 1.6pp
- All cycles
- 2024: D+1.6 2020: D+10.6 2016: D+6.6 2012: R+6.8 2008: R+2.4
Not yet ingested
- Civics
- —
Market trends
- HPI YoY
- ▼ -74.06%
- Current HPI
- 309.5425
- Rent YoY
- ▼ -0.97%
- Metro
- Houston-The Woodlands-Sugar Land, TX
- State GDP YoY
- ▲ 3.95%
- F500 in state
- 110
Industry mix (Fortune 500 HQ in TX)
| Industry | F500 HQs | Revenue |
|---|---|---|
| Energy | 16 | $1,198B |
|
||
| Technology | 5 | $198B |
|
||
| Engineering / Construction | 4 | $72B |
|
||
| Energy Services | 3 | $60B |
|
||
| Utilities | 3 | $41B |
|
||
| Healthcare | 2 | $330B |
|
||
Price history
1 event — show timeline
- 2026-06-15 Listed $234,900 HARMLS
Property tax history
+3.2%/yrLatest (2025): $6,301 · -6.8% YoY. Source: county tax records.
Cash-flow waterfall
monthlySold comps — $/sqft
last 12 mo · ≤1 miLoading sold comps…