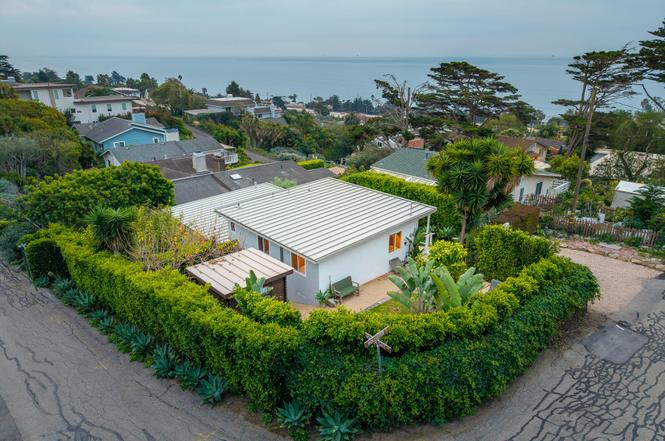
2305 Golden Gate Ave · Summerland, CA
Flood risk 1/10 · Minimal
- FEMA flood zone
- X (unshaded)
- Chance of flooding over 30 yrs
- 0.0%
- Est. flood insurance / yr
- $507 – $1,088
Fire risk 4/10 · Minor
- Est. fire insurance / yr
- $659 – $1,223
Heat risk 6/10 · Moderate
- Hot days now (above 86°F)
- 7 days/yr
- Hot days in 30 yrs
- 17 days/yr
Wind risk 1/10 · Minimal
- Chance of severe wind over 30 yrs
- —
Air-quality risk 8/10 · Major
- Unhealthy air days now
- 13 days/yr
- Unhealthy air days in 30 yrs
- 13 days/yr
Risk factors via First Street. Map © Google.
Why this score? — see what drove the C- grade
The composite is a weighted blend of 9 inputs, each scored 0–100. Each bar is that input's sub-score; the figure is the points it added to the 100-point composite (weight × sub-score).
- Cash flow +16.8/30.0
- ARV discount +7.5/15.0
- Appreciation +5.6/10.0
- DSCR +5.2/10.0
- 1% rule +3.6/10.0
- Livability +3.3/5.0
- Schools +3.2/10.0
- Rent growth +2.5/5.0
- Condition / age +2.5/5.0
$2,450,000
🖨 Deal sheet 📄 Offer letter ✓ Due diligence
Listing remarks MLS
This recently renovated Summerland duplex features granite countertops, new appliances, newer floors and washers/dryers. With both units leased great investment opportunity. Alternatively with unit B being leased under market and month to month a buyer could occupy unit B, get owner occupied financing and minimize their loan payment with strong income from unit A which just leased at market. Please call Listing Agents for additional information.
Key facts
- Income potential
- Detached office
- Artist's studio
Tags
Property features AI
Finance
- Other: Pets allowed
- Financial info: Two-unit property; Monthly total reported: $8,333; Reported rent (unit 1): $100,000
Exterior
- Utilities: Heating available; Cooling available; Cooling type: Other; Heating type: Other
- Exterior features: Mixed foundation; Pier & post foundation; Raised foundation; Property in excellent condition; Zoned: Other
Interior
- Bedrooms: Unit 1: 2 bedrooms; Unit 2: 2 bedrooms
- Flooring: Wood/laminate
- Bathrooms: Unit 1: 1 bath; Unit 2: 1 bath
- Interior features: In-unit laundry room; Wood/laminate flooring
- Laundry & utility: Laundry room inside the unit
Neighborhood map
What this means for you Summary
Snapshot
- This is a 4-bed/2.0-bath single-family listed at $2.45M.
Deal economics
- At list price, monthly cash flow is $2k ($19k/yr) — positive.
- The deal already cash-flows at list — no discount required.
- To meet the 1% rule (rent ≥ 1% of price), the offer needs to be $2.11M (13.7% below list).
- Recommended offer: $2.11M (13.7% below list) — sets the bar for 1% rule.
Location & tenants
- Location reads 66/100 on livability (#339 in CA) — a middle-class / working-renter tenant base. Strengths: employment A+, crime A-, housing B; Watch: commute C-, amenities F, cost of living F.
- Carpinteria Unified (suburban): math 27% / reading 43% proficiency, ranked #255 of 517 in CA (top 49%) — families likely to look elsewhere, expect single-tenant / working-renter base with shorter leases.
- Zoned schools: Summerland Elementary (math 50% / reading 50%, grade D, #410 of 1,571 statewide, top 28%, 50 students, 46% FRL) — zoned schools at 46% FRL track the district average.
- Zoned-school proficiency averages 50% at this address vs 35% district-wide (+14 pts) — the actual schools serving this property are materially stronger than the Carpinteria Unified average implies; a family-tenant draw the district grade alone would hide.
- Market conditions: 9 active listings in the ZIP; 11 comparable units currently listed for rent nearby; rentals at typical pace (median 24d on market — plan ~3-4 weeks tenant-placement turnaround); 719 units permitted in Santa Barbara County in 2024 (217 in 5+ unit buildings).
Forward outlook
- In year one you build about $45k of equity ($17k loan paydown + $28k appreciation (1.1% local appreciation)).
- Santa Barbara County population projected at +20% by 2050 — long-run rental-demand tailwind backs the buy-and-hold thesis.
- At projected returns (1.1% appreciation + 3.0% rent growth), your $686k cash investment doubles in ~8 years — after that, you're playing with house money.
- By year 4, paydown + projected appreciation supports a ~$161k cash-out refi (75% LTV) — recoverable capital for the next deal without selling this one.
Negotiation context
- Only 2 days on market — expect competitive offers; lowballing is unlikely to land.
- 6 sale attempts since 16y ago with the ask held roughly flat each time — persistent listings suggest the price (not the market) is what's stuck; bring a comps-based counter.
- Current owner paid $1.10M; list at $2.45M implies a 122% gain — meaningful room to come down on a strong offer.
Risks & watch-outs
- Watch-outs: built in 1958 — expect roof / HVAC / electrical / plumbing capex.
Questions for the listing agent
- Built in 1958 — when were the roof, HVAC, electrical panel, plumbing, and water heater last replaced?
- Is there a deadline driving the sale (1031 exchange, divorce, estate, relocation)? That informs how much negotiation room exists.
- Schools are A-rated — typically a magnet for longer-tenancy family renters. What's the average tenant stay here, and is there a school-zone premium baked into asking?
- What's the average days-on-market for RENTAL listings here right now (not sales)? A rising rental-DOM trend means longer vacancies and softer asking-rent achievability than the comps imply.
- What's the recent tenant-quality profile in this submarket — average credit score on applications, eviction rate, late-payment / NSF rate, and stable-employment percentage? A property-management company in the area should have these aggregated.
- How much new for-sale + rental construction is in the pipeline within 1–3 miles? Heavy new supply typically softens prices + rents 12–24 months out; constrained supply supports both.
Investment metrics
- 1% rule
- 0.86% ✗
- Cap rate
- 7.06%
- Cash-on-cash
- 2.74%
- DSCR
- 1.12
- GRM
- 9.7
CMA / ARV
No comps found within radius.
Show comp detail 12 sales within ~0.75 mi
| Address | Dist | Beds/Ba | Sqft | Sold | Price | $/sf | Match |
|---|---|---|---|---|---|---|---|
| 2335 Whitney Ave | 0.07mi | 3/2.5 (-1) | 1,792 | 7mo | $2,675,000 | $1,493 | 71 |
| 2365 Whitney Ave | 0.12mi | 3/3.0 (-1) | 1,535 | 11mo | $2,362,230 | $1,539 | 64 |
| 2402 Shelby St | 0.17mi | 3/3.5 (-1) | 994 | 7mo | $1,890,000 | $1,901 | 63 |
| 2525 Emerson St | 0.38mi | 3/2.5 (-1) | 2,074 | 0mo | $3,195,000 | $1,541 | 62 |
| 2211 Lillie Ave | 0.22mi | 4/4.5 | 1,590 | 6mo | $2,700,000 | $1,698 | 62 |
| 2176 Ortega Hill Rd #A&B | 0.30mi | 5/2.0 (+1) | 1,176 | 8mo | $2,040,000 | $1,735 | 62 |
| 2240 Ortega Ranch Rd | 0.30mi | 5/4.5 (+1) | 6,076 | 0mo | $9,725,000 | $1,601 | 59 |
| 2631 Freesia Dr | 0.66mi | 3/2.5 (-1) | 2,595 | 1mo | $3,900,000 | $1,503 | 49 |
| 480 Ortega Ridge Rd | 0.62mi | 3/3.0 (-1) | 3,681 | 5mo | $7,500,000 | $2,037 | 45 |
| 2155 Birnam Wood Dr | 0.71mi | 3/3.0 (-1) | 3,350 | 1mo | $5,700,000 | $1,701 | 45 |
| 2720 Montecito Ranch Pl | 0.67mi | 4/6.0 | 6,157 | 2mo | $13,955,000 | $2,267 | 39 |
| 2030 Creekside Rd | 0.71mi | 4/5.5 | 5,315 | 10mo | $7,200,000 | $1,355 | 32 |
Match score weights: distance 35% · size 25% · config 20% · recency 20%. Top-matched comps best support the ARV.
Projected returns pro-forma
1.14% appreciation · 3.0% rent growth · sell at horizon
- IRR
- 4.6%
- Equity multiple
- 1.23×
- Total profit
- $160,904
- Equity at exit
- $853,647
- IRR
- 8.8%
- Equity multiple
- 2.09×
- Total profit
- $745,411
- Equity at exit
- $1,147,885
Cash invested: $686,000 (down + closing). Projections, not guarantees.
Landlord ↔ Tenant lean methodology
- Overall (STATE)
- 18 Strongly Tenant-Friendly
- State California
- 18 Strongly Tenant-Friendly · D+13
- County
- — inherits STATE
- City
- — inherits STATE
ZIP-level market 93067
- Home prices YoY
- 0.2%
- Active inventory
- 9
- Price-to-rent
- 9.7×
Monthly cashflow live
- Estimated rent
- $21,143 high interval (Pro) →
- Mortgage (P&I)
- −$12,848
- Tax from tax record
- −$1,270 /mo · $15,235/yr
- Insurance
- −$1,021
- HOA
- −$0
- Vacancy / Maint / Mgmt
- −$4,440
- Net cashflow
- $1,565
Break-even live
UW: 25.0% down · 7.5% · 30yr · 1.5% tax · 5.0% vac · 8.0% maint · 8.0% mgmt
Financing live
Cash to close
- Down payment
- $612,500
- Closing costs
- $73,500
- Reserves months
- —
- Total cash needed
- —
Loan-product check · same deal, 3 products live
Conventional
25% down · 7.5% · 30yr
- Down + closing
- —
- Monthly P&I
- —
- Monthly cashflow
- —
- DSCR
- —
- Eligible?
- —
Personal DTI + credit; lowest rate.
DSCR
20% down · 8.5% · 30yr
- Down + closing
- —
- Monthly P&I
- —
- Monthly cashflow
- —
- DSCR
- —
- Eligible?
- —
No personal income docs; deal must DSCR.
Hard money
10% down · 12.0% · 12mo
- Down + closing
- —
- Monthly P&I
- —
- Monthly cashflow
- —
- DSCR
- —
- Eligible?
- —
Short-term bridge; refi at stabilization.
Rent comps 11 comps
| Address | Beds | Baths | Sqft | Rent | $/sqft | DOM | Units | Dist |
|---|---|---|---|---|---|---|---|---|
| 2290 Golden Gate Ave Summerland, CA | 3.0 | 2.0 | 1405 | $9,500 | $6.76 | 20d | 1 | 0.06mi |
| 2315 Finney St Summerland, CA | 5.0 | 2.5 | 3483 | $35,000 | $10.05 | 43d | 1 | 0.22mi |
| 2345 Finney St Summerland, CA | 3.0 | 3.0 | 1951 | $23,000 | $11.79 | 11d | 1 | 0.23mi |
| 2430 Whitney Ave Summerland, CA | 3.0 | 3.0 | 1986 | $19,500 | $9.82 | 11d | 1 | 0.23mi |
| 2521 Whitney Ave Summerland, CA | 4.0 | 3.0 | 2556 | $9,000 | $3.52 | 2d | 1 | 0.36mi |
| 2121 Summerland Heights Ln Santa Barbara, CA | 3.0 | 2.5 | 2709 | $20,000 | $7.38 | 43d | 1 | 0.43mi |
| 2162 E Valley Rd Santa Barbara, CA | 3.0 | 2.0 | 1825 | $28,000 | $15.34 | 23d | 1 | 0.98mi |
| Crocker Sperry Dr Montecito, CA | 3.0 | 3.5 | 2805 | $28,500 | $10.16 | 14d | 1 | 1.07mi |
| 710 Romero Canyon Rd Santa Barbara, CA | 5.0 | 4.5 | 4476 | $55,000 | $12.29 | 23d | 1 | 1.23mi |
| 2084 Alisos Dr Santa Barbara, CA | 4.0 | 4.5 | — | $38,000 | — | 23d | 1 | 1.35mi |
| 1694 San Leandro Ln Santa Barbara, CA | 3.0 | 2.5 | 2368 | $22,500 | $9.50 | 23d | 1 | 1.41mi |
Listing history 3 events
-
2026-06-18days on market $2,450,000 Active 2 DOM
-
2026-06-17remarks 699-char remark
-
2026-06-17$2,450,000 Active 1 DOM
ⓘ Source: listings_history table (triggers on properties + properties_extension) + one-shot
backfill from property_details.listing_events for pre-trigger history.
Tax reassessment forecast CA · Resets to sale price
- Current annual tax
- $15,235 · $1,270/mo
- Projected year-2 tax
- $18,620 · $1,552/mo
- Expected delta
- +$3,385/yr (+$282/mo · 22.2%)
ⓘ Screening estimate from a state-policy table — verify with the county assessor before closing.
Climate risk First Street
- Flood 1/10 Low FEMA zone X (unshaded) · 0% chance over 30 yrs
- Wildfire 4/10 Moderate
- Heat 6/10 Major 7 d/yr ≥86°F today · 17 d/yr by 30 yrs out
- Wind 1/10 Low
- Air quality 8/10 Severe 13 unhealthy d/yr today · 13 by 30 yrs out
Nearby sold comps map
Loading sold comps map…
Walkable amenities ~0.75 mi
Loading nearby amenities…
Taxation est. · year 1
- Rental income
- $253,718
- − Mortgage interest
- −$137,238
- − Property taxes
- −$15,235
- − Insurance
- −$12,250
- − Repairs & maintenance
- −$20,297
- − Management
- −$20,297
- − Depreciation
- −$71,273
- Taxable loss
- −$22,873
- Est. tax savings @ 24.0%
- +$5,490
- After-tax cash flow
- $24,265/yr
For passive investors: Depreciation is non-cash, so a rental often shows a tax loss while cash-flowing — sheltering income. Rental losses are passive: they offset passive income freely, and up to $25,000/yr can offset ordinary (W-2) income if you actively participate and your MAGI is under $100k (phasing out to $0 by $150k); unused losses carry forward. On sale, claimed depreciation is recaptured at up to 25%, and gains may owe capital-gains tax (a 1031 exchange can defer both). Figures are a year-1 estimate at your 24.0% rate — not tax advice; consult a CPA.
Schools (NCES district)
- District
- Carpinteria Unified
- NCES district ID
- 0607560
- Math proficiency
- 27% ▼ -16.00%
- Reading proficiency
- 43% ▼ -5.00%
- Median HH income
- $70,780
- Composite
- 32.27/100
- National rank
- #5758
- State rank
- #255 of 517 in CA
Livability — Summerland
- Score
- 66/100
- State rank
- #339
- US rank
- #11657
Category grades
Schools grade is shown separately in the Schools card above.
Census & demographics
- Census place
- Summerland, CA
- City population
- 993
- Population (ZIP)
- 993
Population outlook (Santa Barbara County) Hauer SSP2
- Today (2025)
- 484,679 people
- By 2030
- 505,323 · +4.3%
- By 2040
- 545,783 · +12.6%
- By 2050
- 584,263 · +20.5%
- By 2075
- 682,586 · +40.8%
- By 2100
- 723,188 · +49.2%
Race, ethnicity, and origin ACS 2023
- Neighborhood character
- Diverse neighborhood (Simpson 0.65)
- Race & ethnicity
- White 45% Hispanic / Latino 34% Two or more races 28% Asian 18% Native American 9%
- Hispanic origin (detail)
- Mexican 4%
- Common ancestry
- Russian 6% Italian 5% Lithuanian 3%
- Foreign-born
- 9% · Vietnam, Canada
- Languages at home
- 69% English-only · Spanish 24% Vietnamese 7%
Political lean MEDSL · Santa Barbara
- 2024 margin
- Strong D (+26.7) · D 61.8% · R 35.1% · Other 3.1%
- 2008→2024 swing
- +3.8pp toward D · 2008: 22.9pp · 2024: 26.7pp
- All cycles
- 2024: D+26.7 2020: D+32.1 2016: D+28.2 2012: D+17.1 2008: D+22.9
Not yet ingested
- Civics
- —
Market trends
- HPI YoY
- ▲ 1.14%
- Current HPI
- 459.4446
- Rent YoY
- —
- Metro
- —
- State GDP YoY
- ▲ 3.21%
- F500 in state
- 116
Industry mix (Fortune 500 HQ in CA)
| Industry | F500 HQs | Revenue |
|---|---|---|
| Technology | 27 | $1,492B |
|
||
| Financial Services | 3 | $174B |
|
||
| Retail | 3 | $44B |
|
||
| Insurance | 3 | $26B |
|
||
| Media / Entertainment | 2 | $115B |
|
||
| Pharmaceuticals / Biotech | 2 | $62B |
|
||
Price history
+346.3% since first listed13 events — show timeline
- 2026-06-16 Listed $2,450,000 SBMLS
- 2020-11-12 Sold (Public Records) $1,105,000 Public Records
- 2020-11-12 Sold (MLS) $1,105,000 SBMLS
- 2020-10-16 Contingent — SBMLS
- 2020-05-19 Listed $1,125,000 SBMLS
- 2017-12-23 Relisted — SBMLS
- 2017-12-22 Listing Removed — SBMLS
- 2017-10-25 Contingent — SBMLS
- 2017-09-18 Listed $995,000 SBMLS
- 2010-12-30 Sold (Public Records) $417,000 Public Records
- 2010-12-30 Sold (MLS) $417,000 SBMLS
- 2010-11-22 Listed $485,000 SBMLS
- 2010-06-14 Listed $549,000 SBMLS
Property tax history
+14.9%/yrLatest (2025): $15,235 · +3.5% YoY. Source: county tax records.
Cash-flow waterfall
monthlySold comps — $/sqft
last 12 mo · ≤1 miLoading sold comps…