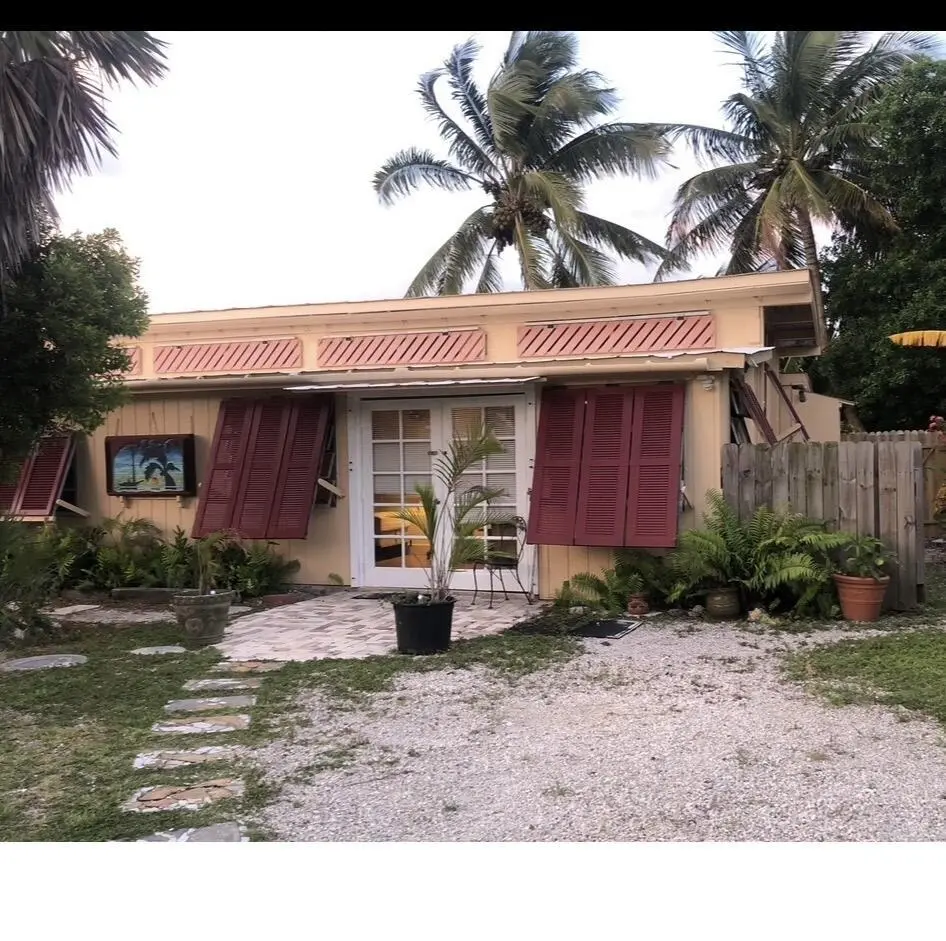
28178 Julia Ave · Big Pine Key, FL
Flood risk 9/10 · Severe
- FEMA flood zone
- AE
- Chance of flooding over 30 yrs
- 0.99%
- Est. flood insurance / yr
- $1,737 – $8,500
Fire risk 1/10 · Minimal
- Est. fire insurance / yr
- $947 – $1,759
Heat risk No data
- Hot days now (above threshold)
- —
- Hot days in 30 yrs
- —
Wind risk 10/10 · Severe
- Chance of severe wind over 30 yrs
- 99.0%
Air-quality risk 1/10 · Minimal
- Unhealthy air days now
- 0 days/yr
- Unhealthy air days in 30 yrs
- 0 days/yr
Risk factors via First Street. Map © Google.
Why this score? — see what drove the D+ grade
The composite is a weighted blend of 9 inputs, each scored 0–100. Each bar is that input's sub-score; the figure is the points it added to the 100-point composite (weight × sub-score).
- Cash flow +12.0/30.0
- Appreciation +10.0/10.0
- ARV discount +6.0/15.0
- Schools +4.6/10.0
- DSCR +3.5/10.0
- Livability +3.3/5.0
- Rent growth +2.5/5.0
- Condition / age +2.5/5.0
- 1% rule +2.1/10.0
$525,000
🖨 Deal sheet (PDF) 📄 Offer letter ✓ Due diligence
Listing remarks
Income producing Property 2 Bed 1 Bath w/ Airbnb. Separate studio private entrance, metal roof, mini split AC, 200 AMP service, large workshop, impact windows, close to boat ramp. Custom lots of charm! . .. . the property '28168 Julia Ave, next door is for sale separately as a Rogo exempt lot ' Cash sale only please.
Key facts
- Mini split ac
- Metal roof
- 200 amp service
Tags
Property features AI
Finance
- Financial info: Cash terms
- HOA & community: No association fee; No association-provided services listed; No first right of refusal
Exterior
- Utilities: Public sewer hookup; Cable available; Buyer to verify utilities
- Home design: Manufactured home; Ground level; Built in 1966; Metal roof; Zoned URM - Urban Res Mobile Home District; Facing Bay/Gulf side
- Construction: Manufactured construction; Metal roof; Built in 1966
- Exterior features: No waterfront; No dockage; Deed restrictions apply; Pets allowed with restrictions (verify with owner); Rentals not allowed; Flood zone AE; Lot less than 1/4 acre
Interior
- Kitchen: Range
- Bathrooms: One full bathroom; One half bathroom
- Heating & cooling: Window/Wall Unit
- Interior features: Window/wall air conditioning units; Unfurnished
Neighborhood map
What this means for you Summary
Snapshot
- This is a 2-bed/1.0-bath manufactured listed at $525k.
Deal economics
- At list price, monthly cash flow is $-556 ($-7k/yr) — negative.
- To cash-flow at today's rent, offer at most $427k (18.7% below list).
- To meet the 1% rule (rent ≥ 1% of price), the offer needs to be $373k (28.9% below list).
- Recommended offer: $373k (28.9% below list) — sets the bar for 1% rule.
- Cap rate 6.0% vs local median 0.2% in Big Pine Key — top-decile yield for the area; either an underpriced asset or a hidden risk that comps aren't pricing in. Stress-test before assuming the spread holds.
Location & tenants
- Location reads 66/100 on livability (#597 in FL) — a middle-class / working-renter tenant base. Strengths: schools A+, crime A+, employment A+; Watch: amenities F, commute F, cost of living F.
- Monroe (town): math 50% / reading 55% proficiency, ranked #23 of 73 in FL (top 32%) — acceptable for families but not a draw, mixed tenant base, ~2y average lease.
- Market conditions: 244 active listings in the ZIP; solid renter incomes; 332 units permitted in Monroe County in 2024 (42 in 5+ unit buildings).
- This rent runs 43% of the median local income ($103k/yr) — at the standard rent-burdened threshold; future hikes will face affordability resistance.
Forward outlook
- In year one you build about $56k of equity ($4k loan paydown + $52k appreciation (10.0% local appreciation)).
- Monroe County population projected at +28% by 2050 — long-run rental-demand tailwind backs the buy-and-hold thesis.
- By year 2, paydown + projected appreciation supports a ~$90k cash-out refi (75% LTV) — recoverable capital for the next deal without selling this one.
Negotiation context
- It's been on market 88 days — a 6% lower offer ($494k) is reasonable based on typical stale-listing flexibility.
- 9 sale attempts since 24y ago; this cycle's ask has dropped $44k (8%) from the opening price — seller is motivated, your offer sets the floor, not the list.
- Current owner paid $116k; list at $525k implies a 353% gain — meaningful room to come down on a strong offer.
Risks & watch-outs
- Watch-outs: flood insurance adds $427/mo.
- Climate carrying-cost: in FEMA flood zone AE (mandatory federal flood insurance); severe wind risk, 99% chance of damaging wind over 30y — expect insurance premiums to compound above CPI over the hold.
Questions for the listing agent
- What do current leases actually rent for vs. the listed asking? Can we see a recent rent roll and the last 12 months of T-12 income?
- It's been on market 88 days. Have you received any prior offers? Is the seller open to a 29% concession, seller financing, or rate buy-down credit?
- Built in 1966 — when were the roof, HVAC, electrical panel, plumbing, and water heater last replaced?
- What's the actual annual flood-insurance premium (NFIP or private), and is the property in a SFHA with mandatory coverage?
- Why hasn't it sold? Are there any deal-killer items the seller is aware of (foundation, flood, title, zoning, code violations)?
- Is there a deadline driving the sale (1031 exchange, divorce, estate, relocation)? That informs how much negotiation room exists.
- Schools are A-rated — typically a magnet for longer-tenancy family renters. What's the average tenant stay here, and is there a school-zone premium baked into asking?
- The area grade is low — what's the realistic commute time and amenity access for the typical tenant pool here? Any planned neighborhood developments (good or bad) we should know about?
- What's the average days-on-market for RENTAL listings here right now (not sales)? A rising rental-DOM trend means longer vacancies and softer asking-rent achievability than the comps imply.
- What's the recent tenant-quality profile in this submarket — average credit score on applications, eviction rate, late-payment / NSF rate, and stable-employment percentage? A property-management company in the area should have these aggregated.
- How much new for-sale + rental construction is in the pipeline within 1–3 miles? Heavy new supply typically softens prices + rents 12–24 months out; constrained supply supports both.
Investment metrics
- 1% rule
- 0.71% ✗
- Cap rate
- 6.00%
- Cash-on-cash
- -1.06%
- DSCR
- 0.95
- GRM
- 11.7
CMA / ARV
- ARV (on-the-fly)
- $507,726
- Comps found
- 2
Show comp detail 2 sales within ~0.75 mi
| Address | Dist | Beds/Ba | Sqft | Sold | Price | $/sf | Match |
|---|---|---|---|---|---|---|---|
| 28232 Dorothy Ave | 0.06mi | 2/1.5 | 1,064 (-12%) | 15mo | $310,000 | $291 | 63 |
| 27973 Snapper Ln | 0.71mi | 2/2.0 | 1,056 (-12%) | 2mo | $445,000 | $421 | 41 |
Match score weights: distance 35% · size 25% · config 20% · recency 20%. Top-matched comps best support the ARV.
Projected returns pro-forma
10.0% appreciation · 3.0% rent growth · sell at horizon
- IRR
- 21.1%
- Equity multiple
- 2.70×
- Total profit
- $250,499
- Equity at exit
- $472,962
- IRR
- 19.1%
- Equity multiple
- 6.21×
- Total profit
- $765,486
- Equity at exit
- $1,019,960
Cash invested: $147,000 (down + closing). Projections, not guarantees.
Landlord ↔ Tenant lean methodology
- Overall (STATE)
- 87 Strongly Landlord-Friendly
- State Florida
- 87 Strongly Landlord-Friendly · R+3
- County
- — inherits STATE
- City
- — inherits STATE
ZIP-level market 33042
- Home prices YoY
- 2.5%
- Active inventory
- 244
- Price-to-rent
- 11.7×
Monthly cashflow live
- Estimated rent
- $3,733 medium interval (Pro) →
- Mortgage (P&I)
- −$2,753
- Tax from tax record
- −$106 /mo · $1,274/yr
- Insurance
- −$219
- Flood insurance flood zone
- −$427 /mo · $5,118/yr
- HOA
- −$0
- Vacancy / Maint / Mgmt
- −$784
- Net cashflow
- $-556
Break-even live
Sensitivity live
| Price | -10% $-259 | -5% $-407 | +0% $-556 | +5% $-705 | +10% $-853 |
|---|---|---|---|---|---|
| Rent | -10% $-851 | -5% $-703 | +0% $-556 | +5% $-409 | +10% $-261 |
| Rate | -1.0pp $-292 | -0.5pp $-422 | base $-556 | +0.5pp $-692 | +1.0pp $-830 |
UW: 25.0% down · 7.5% · 30yr · 1.5% tax · 5.0% vac · 8.0% maint · 8.0% mgmt
Financing live
Cash to close
- Down payment
- $131,250
- Closing costs
- $15,750
- Reserves months
- —
- Total cash needed
- —
Loan-product check · same deal, 3 products live
Conventional
25% down · 7.5% · 30yr
- Down + closing
- —
- Monthly P&I
- —
- Monthly cashflow
- —
- DSCR
- —
- Eligible?
- —
Personal DTI + credit; lowest rate.
DSCR
20% down · 8.5% · 30yr
- Down + closing
- —
- Monthly P&I
- —
- Monthly cashflow
- —
- DSCR
- —
- Eligible?
- —
No personal income docs; deal must DSCR.
Hard money
10% down · 12.0% · 12mo
- Down + closing
- —
- Monthly P&I
- —
- Monthly cashflow
- —
- DSCR
- —
- Eligible?
- —
Short-term bridge; refi at stabilization.
Listing history 40 events
-
2026-06-22days on market $525,000 Active 88 DOM
-
2026-06-19days on market $525,000 Active 85 DOM
-
2026-06-18days on market $525,000 Active 84 DOM
-
2026-06-17days on market $525,000 Active 83 DOM
-
2026-06-16days on market $525,000 Active 82 DOM
-
2026-06-15days on market $525,000 Active 81 DOM
-
2026-06-14days on market $525,000 Active 79 DOM
-
2026-06-13days on market $525,000 Active 78 DOM
-
2026-06-10days on market $525,000 Active 76 DOM
-
2026-06-09days on market $525,000 Active 75 DOM
-
2026-06-08days on market $525,000 Active 74 DOM
-
2026-06-07days on market $525,000 Active 73 DOM
-
2026-06-05days on market $525,000 Active 70 DOM
-
2026-06-03days on market $525,000 Active 69 DOM
-
2026-06-02days on market $525,000 Active 68 DOM
-
2026-06-01days on market $525,000 Active 67 DOM
-
2026-05-31days on market $525,000 Active 66 DOM
-
2026-05-30days on market $525,000 Active 65 DOM
-
2026-05-18price $525,000
-
2026-03-26$569,000 Active
-
2021-03-03historical
-
2020-09-02$349,000
-
2020-05-15historical
-
2020-05-15historical
-
2012-07-12soldstatus $116,000
-
2011-06-21soldstatus $119,000
-
2011-03-11$119,900
-
2005-07-20soldstatus $295,000
-
2005-07-20soldstatus $295,000
-
2005-07-20soldstatus $295,000
-
2005-03-14historical
-
2005-03-14historical
-
2005-03-07$295,000
-
2005-03-07$295,000
-
2004-12-21$329,000
-
2004-12-21$329,000
-
2004-02-09historical
-
2003-10-01$199,900
-
2002-12-17$179,000
-
1979-06-01soldstatus $10,500
ⓘ Source: listings_history table (triggers on properties + properties_extension) + one-shot
backfill from property_details.listing_events for pre-trigger history.
Tax reassessment forecast FL · Resets to sale price
- Current annual tax
- $1,274 · $106/mo
- Projected year-2 tax
- $4,358 · $363/mo
- Expected delta
- +$3,083/yr (+$257/mo · 241.9%)
ⓘ Screening estimate from a state-policy table — verify with the county assessor before closing.
Climate risk First Street
- Flood 9/10 Extreme FEMA zone AE · 99% chance over 30 yrs
- Wildfire 1/10 Low
- Wind 10/10 Extreme 99% chance of damaging wind over 30 yrs
- Air quality 1/10 Low 0 unhealthy d/yr today · 0 by 30 yrs out
Nearby sold comps map
Loading sold comps map…
Walkable amenities ~0.75 mi
Loading nearby amenities…
Taxation est. · year 1
- Rental income
- $44,790
- − Mortgage interest
- −$29,408
- − Property taxes
- −$1,274
- − Insurance
- −$7,744
- − Repairs & maintenance
- −$3,583
- − Management
- −$3,583
- − Depreciation
- −$15,273
- Taxable loss
- −$16,075
- Est. tax savings @ 24.0%
- +$3,858
- After-tax cash flow
- $-2,814/yr
For passive investors: Depreciation is non-cash, so a rental often shows a tax loss while cash-flowing — sheltering income. Rental losses are passive: they offset passive income freely, and up to $25,000/yr can offset ordinary (W-2) income if you actively participate and your MAGI is under $100k (phasing out to $0 by $150k); unused losses carry forward. On sale, claimed depreciation is recaptured at up to 25%, and gains may owe capital-gains tax (a 1031 exchange can defer both). Figures are a year-1 estimate at your 24.0% rate — not tax advice; consult a CPA.
Schools (NCES district)
- District
- Monroe
- NCES district ID
- 1201320
- Math proficiency
- 50% ▼ -14.00%
- Reading proficiency
- 55% ▼ -6.00%
- Median HH income
- $56,955
- Composite
- 45.51/100
- National rank
- #2608
- State rank
- #23 of 73 in FL
Livability — Big Pine Key
- Score
- 66/100
- State rank
- #597
- US rank
- #11450
Category grades
Schools grade is shown separately in the Schools card above.
Census & demographics
- County
- Monroe County · 66,185 people
- Metro
- Key West, FL
- Population (ZIP)
- 6,441
- Household income
- $103,041
- Rent vs Own
- Severe rent burden
- 146.0
Population outlook (Monroe County) Hauer SSP2
- Today (2025)
- 90,706 people
- By 2030
- 96,308 · +6.2%
- By 2040
- 106,565 · +17.5%
- By 2050
- 116,500 · +28.4%
- By 2075
- 141,423 · +55.9%
- By 2100
- 151,947 · +67.5%
Race, ethnicity, and origin ACS 2023
- Neighborhood character
- Predominantly White (81%)
- Race & ethnicity
- White 81% Two or more races 12% Hispanic / Latino 12% Black 3%
- Hispanic origin (detail)
- Mexican 3% Puerto Rican 2% Cuban 5%
- Common ancestry
- Romanian 3% Slovak 3% Iranian 3%
- Foreign-born
- 8% · Canada, Jamaica
- Languages at home
- 91% English-only · Spanish 5% Russian/Polish/Slavic 1% German/W. Germanic 1%
Political lean MEDSL · Monroe
- 2024 margin
- R (+18.3) · D 40.5% · R 58.8%
- 2008→2024 swing
- -23.2pp toward R · 2008: 4.9pp · 2024: -18.3pp
- All cycles
- 2024: R+18.3 2020: R+7.9 2016: R+6.9 2012: D+0.4 2008: D+4.9
Not yet ingested
- Civics
- —
Market trends
- HPI YoY
- ▲ 12.11%
- Current HPI
- 491.52
- Rent YoY
- —
- Metro
- Key West, FL
- State GDP YoY
- ▲ 3.28%
- F500 in state
- 36
Industry mix (Fortune 500 HQ in FL)
| Industry | F500 HQs | Revenue |
|---|---|---|
| Industrial Technology | 2 | $29B |
|
||
| Insurance | 2 | $17B |
|
||
| Retail | 1 | $60B |
|
||
| Technology Distribution | 1 | $58B |
|
||
| Homebuilding | 1 | $35B |
|
||
| Technology Manufacturing | 1 | $35B |
|
||
Price history
+4900.0% since first listed22 events — show timeline
- 2026-05-18 Price Changed $525,000 FLKMLS
- 2026-03-26 Listed $569,000 FLKMLS
- 2021-03-03 Listing Removed — FLKMLS
- 2020-09-02 Listed $349,000 FLKMLS
- 2020-05-15 Listing Removed — FLKMLS
- 2020-05-15 Listing Removed — FLKMLS
- 2012-07-12 Sold (Public Records) $116,000 Public Records
- 2011-06-21 Sold (Public Records) $119,000 Public Records
- 2011-03-11 Listed $119,900 FLKMLS
- 2005-07-20 Sold (Public Records) $295,000 Public Records
- 2005-07-20 Sold (MLS) $295,000 FLKMLS
- 2005-07-20 Sold (MLS) $295,000 FLKMLS
- 2005-03-14 Listing Removed — FLKMLS
- 2005-03-14 Listing Removed — FLKMLS
- 2005-03-07 Listed $295,000 FLKMLS
- 2005-03-07 Listed $295,000 FLKMLS
- 2004-12-21 Listed $329,000 FLKMLS
- 2004-12-21 Listed $329,000 FLKMLS
- 2004-02-09 Listing Removed — FLKMLS
- 2003-10-01 Listed $199,900 FLKMLS
- 2002-12-17 Listed $179,000 FLKMLS
- 1979-06-01 Sold (Public Records) $10,500 Public Records
Property tax history
+2.3%/yrLatest (2025): $1,274 · +4.9% YoY. Source: county tax records.
Cash-flow waterfall
monthlySold comps — $/sqft
last 12 mo · ≤1 miLoading sold comps…