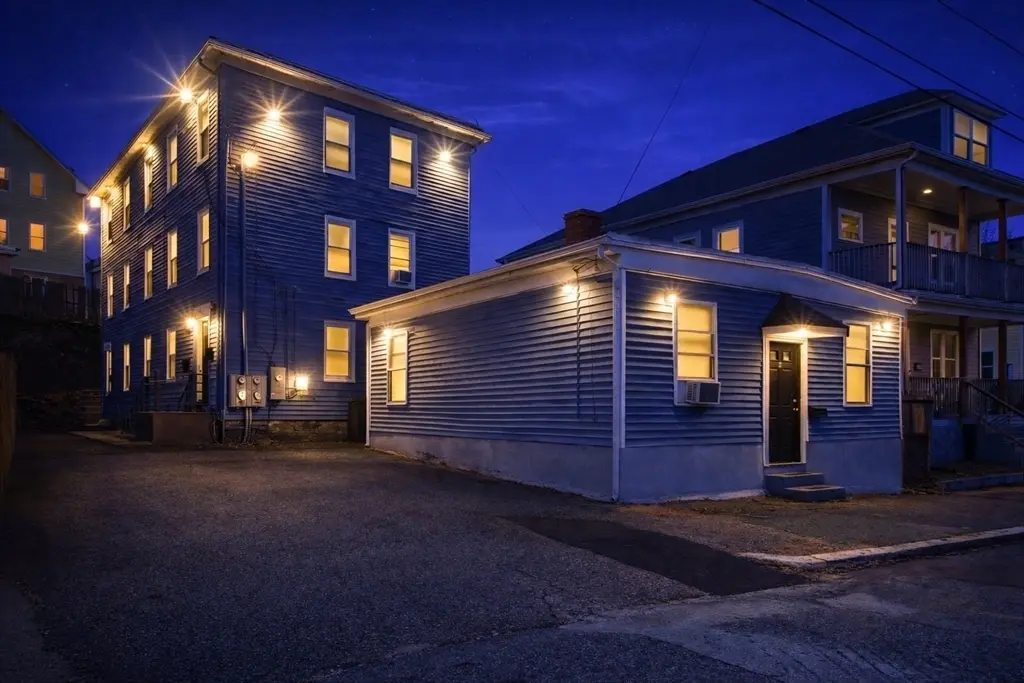
 7-Plex
23 Whitehall · Providence, RI
Flood risk 1/10 · Minimal
- FEMA flood zone
- X (unshaded)
- Chance of flooding over 30 yrs
- 0.0%
- Est. flood insurance / yr
- $473 – $860
Fire risk 1/10 · Minimal
- Est. fire insurance / yr
- $835 – $1,551
Heat risk 5/10 · Moderate
- Hot days now (above 96°F)
- 7 days/yr
- Hot days in 30 yrs
- 15 days/yr
Wind risk 6/10 · Moderate
- Chance of severe wind over 30 yrs
- 71.0%
Air-quality risk 2/10 · Minimal
- Unhealthy air days now
- 1 days/yr
- Unhealthy air days in 30 yrs
- 2 days/yr
Risk factors via First Street. Map © Google.
Why this score? — see what drove the C grade
The composite is a weighted blend of 9 inputs, each scored 0–100. Each bar is that input's sub-score; the figure is the points it added to the 100-point composite (weight × sub-score).
- Cash flow +30.0/30.0
- DSCR +10.0/10.0
- 1% rule +8.5/10.0
- Livability +4.2/5.0
- Rent growth +3.4/5.0
- Condition / age +2.5/5.0
- Schools +1.0/10.0
- ARV discount +0.0/15.0
- Appreciation +0.0/10.0
$999,000
🖨 Deal sheet 📄 Offer letter ✓ Due diligence
Multi-family units
County records classify this as Multi-Family (5+ Unit). Listing-text estimate: 7 units. confirmed
5+ unit building — per-unit beds/baths from public records are typically unavailable; the breakdown below (if shown) is an estimate from the listing text.
Listing remarks MLS
Turnkey 7-unit compound with significant upside in a strong Providence rental market. The asset consists of a 6-unit main building featuring (6) one-bed, one-bath units with gas baseboard heat, plus a detached ~989 SF cottage offering a 2-bed, 1-bath layout with electric baseboard heat. Ownership has completed all major capital improvements, including upgraded boilers and hot water systems, minimizing near-term capex. The property is professionally managed and benefits from tenant-paid utilities, creating an efficient and predictable expense structure. Off-street parking adds to tenant appeal and retention. Current gross income is $98,448, with a pro forma of $111,600, driven by below-market rents, presenting a clear and immediate value-add opportunity. This is a stabilized, income-producing asset with operational upside—ideal for investors seeking strong in-place cash flow with the ability to increase yield through rent growth.
Key facts
- 7 unit compound
- Detached cottage
- Off street parking
Tags
Neighborhood map
What this means for you Summary
Snapshot
- This is a 6×1bd/1ba + 1×2bd/1ba units multifamily listed at $999k.
Deal economics
- At list price, monthly cash flow is $4k ($47k/yr) — positive. Per door: $564/mo.
- The deal already cash-flows at list — no discount required.
- Meets the 1% rule at list price ($13k rent vs $999k).
- Recommended offer: $969k (3.0% below list) — sets the bar for market timing.
- Cap rate 11.0% vs local median 4.2% in Providence — top-decile yield for the area; either an underpriced asset or a hidden risk that comps aren't pricing in. Stress-test before assuming the spread holds.
Location & tenants
- Location reads 84/100 on livability (#2 in RI, #794 nationally) — a professional / high-income tenant draw. Strengths: amenities A+, commute A+, housing A+; Watch: employment C-, schools F.
- Providence (urban): math 8% / reading 16% proficiency, ranked #34 of 39 in RI (top 87%) — low school quality limits family demand, transient renter base, plan for 1-2y turnover; 79% free/reduced lunch — lower-income household profile, screen leases tightly.
- Market conditions: Rents rising (+3.7%/yr); 132 active listings in the ZIP; 776 units permitted in Providence County in 2024 (229 in 5+ unit buildings).
- At $13,453/mo this rent would consume 250% of the median local household income ($65k/yr) (locally 2000% of renters already pay >50% of income on rent) — very limited rent-growth headroom before tenants either downsize or default.
Forward outlook
- Local home prices are declining (-3.0%/yr); year-one equity from $7k of loan paydown is wiped out by about $30k of value loss. Plan a longer hold.
- Providence County population projected at +5% by 2050 — modest demand growth; plan on rents tracking national, not racing it.
- At projected returns (-3.0% appreciation + 3.7% rent growth), your $280k cash investment doubles in ~7 years — after that, you're playing with house money.
Negotiation context
- It's been on market 51 days — a 3% lower offer ($969k) is reasonable based on typical stale-listing flexibility.
- 2 sale attempts with the ask held roughly flat each time — persistent listings suggest the price (not the market) is what's stuck; bring a comps-based counter.
- Current owner paid $10k; list at $999k implies a 9964% gain — meaningful room to come down on a strong offer.
Risks & watch-outs
- Watch-outs: built in 1900 — expect roof / HVAC / electrical / plumbing capex.
- Climate carrying-cost: major wind risk, 71% chance of damaging wind over 30y; extreme-heat days projected 7→15/yr by 2055 (HVAC capex compounding) — expect insurance premiums to compound above CPI over the hold.
Questions for the listing agent
- It's been on market 51 days. Have you received any prior offers? Is the seller open to a 3% concession, seller financing, or rate buy-down credit?
- Can we see the unit-by-unit rent roll, current vacancy, and any below-market leases? What's the average tenancy length?
- What capital expenditures (roof, boiler, parking lot, exteriors) have been made in the last 5 years, and what's planned in the next 2?
- Built in 1900 — when were the roof, HVAC, electrical panel, plumbing, and water heater last replaced?
- Is there a deadline driving the sale (1031 exchange, divorce, estate, relocation)? That informs how much negotiation room exists.
- Schools are F-rated, which usually means shorter tenancies and higher turnover. Who's the typical renter profile here, and what's been the actual vacancy rate?
- What's the average days-on-market for RENTAL listings here right now (not sales)? A rising rental-DOM trend means longer vacancies and softer asking-rent achievability than the comps imply.
- What's the recent tenant-quality profile in this submarket — average credit score on applications, eviction rate, late-payment / NSF rate, and stable-employment percentage? A property-management company in the area should have these aggregated.
- How much new apartment / multifamily construction is in the pipeline within 1–3 miles? Heavy new supply (>2% of stock underway) typically softens rents 12–24 months out; light construction supports rent growth.
Investment metrics
- 1% rule
- 1.35% ✓
- Cap rate
- 11.03%
- Cash-on-cash
- 16.93%
- DSCR
- 1.75
- GRM
- 6.2
CMA / ARV
- ARV (median comp)
- $699,735
- List price
- $999,000
- Delta
- 42.77%
- Verdict
- OVERPRICED
- Comps
- 20 within 1.0 mi
Projected returns pro-forma
-3.0% appreciation · 3.68% rent growth · sell at horizon
- IRR
- 8.9%
- Equity multiple
- 1.35×
- Total profit
- $98,759
- Equity at exit
- $148,954
- IRR
- 18.7%
- Equity multiple
- 2.60×
- Total profit
- $448,421
- Equity at exit
- $86,375
Cash invested: $279,720 (down + closing). Projections, not guarantees.
Landlord ↔ Tenant lean methodology
- Overall (STATE)
- 31 Tenant-Leaning
- State Rhode Island
- 31 Tenant-Leaning · D+8
- County
- — inherits STATE
- City
- — inherits STATE
ZIP-level market 02909
- Home prices YoY
- -13.3%
- Rents YoY
- 3.7%
- Active inventory
- 132
- Price-to-rent
- 44.0×
Monthly cashflow live
- Estimated rent
- $13,453 medium interval (Pro) →
- Mortgage (P&I)
- −$5,239
- Tax from tax record
- −$1,027 /mo · $12,324/yr
- Insurance
- −$416
- HOA
- −$0
- Vacancy / Maint / Mgmt
- −$2,825
- Net cashflow
- $3,946
Break-even live
7-unit breakdown (identical units grouped — click to expand)
| Units | Beds | Baths | Est. rent |
|---|---|---|---|
| 6× units | 1 | 1 | $11,358 |
| #1 | 1 | 1 | $1,893 |
| #2 | 1 | 1 | $1,893 |
| #3 | 1 | 1 | $1,893 |
| #4 | 1 | 1 | $1,893 |
| #5 | 1 | 1 | $1,893 |
| #6 | 1 | 1 | $1,893 |
| 1× unit | 2 | 1 | $2,098 |
| Total (7 units) | $13,453 | ||
UW: 25.0% down · 7.5% · 30yr · 1.5% tax · 5.0% vac · 8.0% maint · 8.0% mgmt
Financing live
Cash to close
- Down payment
- $249,750
- Closing costs
- $29,970
- Reserves months
- —
- Total cash needed
- —
Loan-product check · same deal, 3 products live
Conventional
25% down · 7.5% · 30yr
- Down + closing
- —
- Monthly P&I
- —
- Monthly cashflow
- —
- DSCR
- —
- Eligible?
- —
Personal DTI + credit; lowest rate.
DSCR
20% down · 8.5% · 30yr
- Down + closing
- —
- Monthly P&I
- —
- Monthly cashflow
- —
- DSCR
- —
- Eligible?
- —
No personal income docs; deal must DSCR.
Hard money
10% down · 12.0% · 12mo
- Down + closing
- —
- Monthly P&I
- —
- Monthly cashflow
- —
- DSCR
- —
- Eligible?
- —
Short-term bridge; refi at stabilization.
Listing history 18 events
-
2026-06-18days on market $999,000 Active 51 DOM
-
2026-06-17days on market $999,000 Active 50 DOM
-
2026-06-16days on market $999,000 Active 49 DOM
-
2026-06-15days on market $999,000 Active 48 DOM
-
2026-06-13days on market $999,000 Active 46 DOM
-
2026-06-09days on market $999,000 Active 42 DOM
-
2026-06-08days on market $999,000 Active 41 DOM
-
2026-06-07days on market $999,000 Active 40 DOM
-
2026-06-05days on market $999,000 Active 37 DOM
-
2026-06-03days on market $999,000 Active 36 DOM
-
2026-06-02days on market $999,000 Active 35 DOM
-
2026-06-01days on market $999,000 Active 34 DOM
-
2026-05-31days on market $999,000 Active 33 DOM
-
2026-04-28$999,000 New 948-char remark
Show marketing remark (948 chars)
Turnkey 7-unit compound with significant upside in a strong Providence rental market. The asset consists of a 6-unit main building featuring (6) one-bed, one-bath units with gas baseboard heat, plus a detached ~989 SF cottage offering a 2-bed, 1-bath layout with electric baseboard heat. Ownership has completed all major capital improvements, including upgraded boilers and hot water systems, minimizing near-term capex. The property is professionally managed and benefits from tenant-paid utilities, creating an efficient and predictable expense structure. Off-street parking adds to tenant appeal and retention. Current gross income is $98,448, with a pro forma of $111,600, driven by below-market rents, presenting a clear and immediate value-add opportunity. This is a stabilized, income-producing asset with operational upside—ideal for investors seeking strong in-place cash flow with the ability to increase yield through rent growth.
-
2026-04-13$999,000 Active 942-char remark
Show marketing remark (942 chars)
Turnkey 7-unit compound with significant upside in a strong Providence rental market. The asset consists of a 6-unit main building featuring (6) one-bed, one-bath units with gas baseboard heat, plus a detached ~989 SF cottage offering a 2-bed, 1-bath layout with electric baseboard heat. Ownership has completed all major capital improvements, including upgraded boilers and hot water systems, minimizing near-term capex. The property is professionally managed and benefits from tenant-paid utilities, creating an efficient and predictable expense structure. Off-street parking adds to tenant appeal and retention. Current gross income is $98,448, with a pro forma of $111,600, driven by below-market rents, presenting a clear and immediate value-add opportunity. This is a stabilized, income-producing asset with operational upside ideal for investors seeking strong in-place cash flow with the ability to increase yield through rent growth.
-
2018-03-06soldstatus $9,926
-
2017-04-04soldstatus $8,171
-
2016-06-15soldstatus $11,904
ⓘ Source: listings_history table (triggers on properties + properties_extension) + one-shot
backfill from property_details.listing_events for pre-trigger history.
Tax reassessment forecast RI · Partial reset (capped growth)
- Current annual tax
- $12,324 · $1,027/mo
- Projected year-2 tax
- $14,304 · $1,192/mo
- Expected delta
- +$1,980/yr (+$165/mo · 16.1%)
ⓘ Screening estimate from a state-policy table — verify with the county assessor before closing.
Climate risk First Street
- Flood 1/10 Low FEMA zone X (unshaded) · 0% chance over 30 yrs
- Wildfire 1/10 Low
- Heat 5/10 Major 7 d/yr ≥96°F today · 15 d/yr by 30 yrs out
- Wind 6/10 Major 71% chance of damaging wind over 30 yrs
- Air quality 2/10 Low 1 unhealthy d/yr today · 2 by 30 yrs out
Nearby sold comps map
Loading sold comps map…
Walkable amenities ~0.75 mi
Loading nearby amenities…
Taxation est. · year 1
- Rental income
- $161,436
- − Mortgage interest
- −$55,960
- − Property taxes
- −$12,324
- − Insurance
- −$4,995
- − Repairs & maintenance
- −$12,915
- − Management
- −$12,915
- − Depreciation
- −$29,062
- Taxable income
- $33,266
- Est. tax owed @ 24.0%
- −$7,984
- After-tax cash flow
- $39,365/yr
For passive investors: Depreciation is non-cash, so a rental often shows a tax loss while cash-flowing — sheltering income. Rental losses are passive: they offset passive income freely, and up to $25,000/yr can offset ordinary (W-2) income if you actively participate and your MAGI is under $100k (phasing out to $0 by $150k); unused losses carry forward. On sale, claimed depreciation is recaptured at up to 25%, and gains may owe capital-gains tax (a 1031 exchange can defer both). Figures are a year-1 estimate at your 24.0% rate — not tax advice; consult a CPA.
Schools (NCES district)
- District
- Providence
- NCES district ID
- 4400900
- Math proficiency
- 8% ▼ -4.00%
- Reading proficiency
- 16% ▼ -2.00%
- Median HH income
- $38,197
- Composite
- 10.12/100
- National rank
- #9803
- State rank
- #34 of 39 in RI
Livability — Providence
- Score
- 84/100
- State rank
- #2
- US rank
- #794
Category grades
Schools grade is shown separately in the Schools card above.
Census & demographics
- Census place
- Providence, RI
- County
- Providence County · 548,917 people
- City population
- 212,734
- Metro
- Providence-Warwick, RI-MA
- Population (ZIP)
- 46,014
- Household income
- $64,649
- Rent vs Own
- Severe rent burden
- 2000.0
Population outlook (Providence County) Hauer SSP2
- Today (2025)
- 653,469 people
- By 2030
- 660,819 · +1.1%
- By 2040
- 672,747 · +3.0%
- By 2050
- 683,741 · +4.6%
- By 2075
- 720,435 · +10.2%
- By 2100
- 741,582 · +13.5%
Race, ethnicity, and origin ACS 2023
- Neighborhood character
- Diverse neighborhood (Simpson 0.57)
- Race & ethnicity
- Hispanic / Latino 60% Two or more races 23% White 22% Black 12% Asian 2% Native American 2%
- Hispanic origin (detail)
- Puerto Rican 12% Dominican 23%
- Common ancestry
- Lithuanian 2% Russian 1% Romanian 1%
- Foreign-born
- 35% · Canada, Jamaica
- Languages at home
- 43% English-only · Spanish 50% Other Indo-European 2% Other Asian/Pacific 1%
Political lean MEDSL · Providence
- 2024 margin
- D (+14.4) · D 56.1% · R 41.7% · Other 2.2%
- 2008→2024 swing
- -20.0pp toward R · 2008: 34.4pp · 2024: 14.4pp
- All cycles
- 2024: D+14.4 2020: D+22.9 2016: D+21.2 2012: D+34.9 2008: D+34.4
Not yet ingested
- Civics
- —
Market trends
- HPI YoY
- ▼ -72.78%
- Current HPI
- 474.9956
- Rent YoY
- ▲ 3.68%
- Metro
- Providence-Warwick, RI-MA
- State GDP YoY
- ▲ 2.25%
- F500 in state
- 10
Industry mix (Fortune 500 HQ in RI)
| Industry | F500 HQs | Revenue |
|---|---|---|
| Healthcare | 1 | $373B |
|
||
| Food Distribution | 1 | $31B |
|
||
| Aerospace / Defense | 1 | $14B |
|
||
| Financial Services | 1 | $8B |
|
||
| Consumer Goods | 1 | $4B |
|
||
Price history
+8292.1% since first listed5 events — show timeline
- 2026-04-28 Listed $999,000 MLS PIN
- 2026-04-13 Listed $999,000 RIS
- 2018-03-06 Sold (Public Records) $9,926 Public Records
- 2017-04-04 Sold (Public Records) $8,171 Public Records
- 2016-06-15 Sold (Public Records) $11,904 Public Records
Property tax history
+4.2%/yrLatest (2025): $12,324 · +96.6% YoY. Source: county tax records.
Cash-flow waterfall
monthlySold comps — $/sqft
last 12 mo · ≤1 miLoading sold comps…