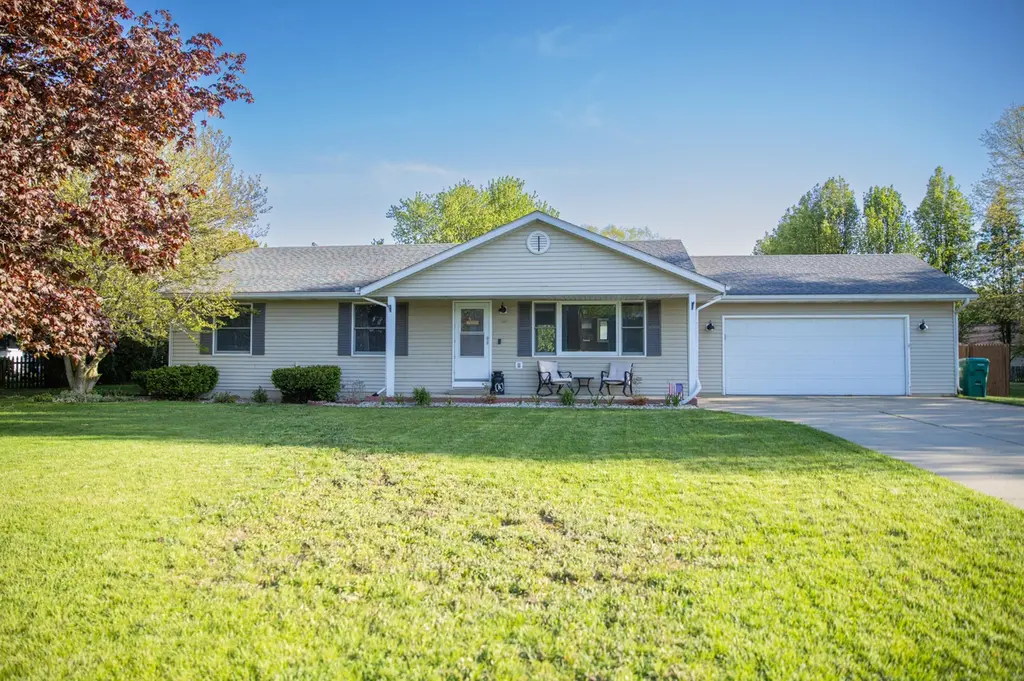
17064 Hawk Ct · Three Rivers, MI
Flood risk 1/10 · Minimal
- FEMA flood zone
- X (unshaded)
- Chance of flooding over 30 yrs
- 0.0%
- Est. flood insurance / yr
- $473 – $860
Fire risk 1/10 · Minimal
- Est. fire insurance / yr
- $784 – $1,456
Heat risk 2/10 · Minimal
- Hot days now (above 100°F)
- 7 days/yr
- Hot days in 30 yrs
- 16 days/yr
Wind risk 2/10 · Minimal
- Chance of severe wind over 30 yrs
- —
Air-quality risk 2/10 · Minimal
- Unhealthy air days now
- 1 days/yr
- Unhealthy air days in 30 yrs
- 2 days/yr
Risk factors via First Street. Map © Google.
Why this score? — see what drove the F grade
The composite is a weighted blend of 9 inputs, each scored 0–100. Each bar is that input's sub-score; the figure is the points it added to the 100-point composite (weight × sub-score).
- Cash flow +5.2/30.0
- Schools +3.5/10.0
- Livability +3.5/5.0
- ARV discount +2.9/15.0
- Rent growth +2.5/5.0
- Condition / age +2.5/5.0
- 1% rule +0.0/10.0
- DSCR +0.0/10.0
- Appreciation +0.0/10.0
$288,000
🖨 Deal sheet 📄 Offer letter ✓ Due diligence
Listing remarks MLS
Sought after Tamarac Subdivision home with open concept living room, dining area, and kitchen in this spacious 3 bedroom, 2 bath with approximately 1,888 sq ft. The finished basement offers additional living space and includes a potential extra room. Recent updates include new flooring throughout the main level, new countertops, and brand new kitchen appliances including the refrigerator, dishwasher, and microwave. The washer, dryer, and water heater have all been replaced within the last two years. The home also features a brand new water softener and reverse osmosis drinking water system. Additional improvements include a recently pumped and inspected septic system and a new water line at the main. The fully fenced backyard features a large new cement patio, offering great outdoor space for relaxing or entertaining.
Key facts
- 0.35 acre lot
- 2 garage spots
- Built 1995
Property features AI
Finance
- HOA & community: Association fee $150 annually; Part of an association
Exterior
- Parking: Attached 2-car garage
- Utilities: Public water; Public sewer; Natural gas
- Home design: Ranch style; Single-family residence; Residential property
- Construction: Built in 1995; Vinyl siding; Composition roof; Full basement foundation
- Exterior features: Cul-de-sac lot; Paved road
Interior
- Kitchen: Dishwasher; Range; Refrigerator
- Bathrooms: 2 full bathrooms
- Heating & cooling: Forced air heating; Has cooling
- Interior features: Garage door opener; Eat-in kitchen; Pantry; Full basement; 6 total rooms
- Laundry & utility: Washer; Dryer; Natural gas water heater
Neighborhood map
What this means for you Summary
Snapshot
- This is a 3-bed/2.0-bath single-family listed at $288k.
Deal economics
- At list price, monthly cash flow is $-651 ($-8k/yr) — negative.
- To cash-flow at today's rent, offer at most $173k (39.9% below list).
- To meet the 1% rule (rent ≥ 1% of price), the offer needs to be $135k (53.2% below list).
- Recommended offer: $135k (53.2% below list) — sets the bar for 1% rule.
- Cap rate 3.6% vs local median 5.2% in Three Rivers — below-typical yield; the buyer is paying a premium for something (appreciation thesis, condition, location) that the cap rate doesn't capture.
Location & tenants
- Location reads 70/100 on livability (#306 in MI) — a middle-class / working-renter tenant base. Strengths: cost of living A+, housing A+, health & safety A+; Watch: schools D+, crime D, amenities F.
- Three Rivers Community Schools (town): math 37% / reading 45% proficiency, ranked #200 of 540 in MI (top 37%) — families likely to look elsewhere, expect single-tenant / working-renter base with shorter leases.
- Market conditions: 178 active listings in the ZIP; 125 units permitted in St. Joseph County in 2024 (0 in 5+ unit buildings).
Forward outlook
- Local home prices are declining (-3.0%/yr); year-one equity from $2k of loan paydown is wiped out by about $9k of value loss. Plan a longer hold.
- St. Joseph County population projected at -16% by 2050 — secular population decline; favor cash flow + early exit over multi-decade hold.
Negotiation context
- It's been on market 41 days — a 3% lower offer ($279k) is reasonable based on typical stale-listing flexibility.
- 25 sale attempts since 27y ago with the ask held roughly flat each time — persistent listings suggest the price (not the market) is what's stuck; bring a comps-based counter.
- Current owner paid $164k; list at $288k implies a 76% gain — meaningful room to come down on a strong offer.
Questions for the listing agent
- What do current leases actually rent for vs. the listed asking? Can we see a recent rent roll and the last 12 months of T-12 income?
- It's been on market 41 days. Have you received any prior offers? Is the seller open to a 53% concession, seller financing, or rate buy-down credit?
- What does the HOA fee cover, when was the last increase, and are there any pending special assessments or reserve-fund shortfalls?
- Is there a deadline driving the sale (1031 exchange, divorce, estate, relocation)? That informs how much negotiation room exists.
- Schools are D-rated, which usually means shorter tenancies and higher turnover. Who's the typical renter profile here, and what's been the actual vacancy rate?
- Crime grade is D in this area — have there been break-ins, vandalism, or insurance claims at this property in the last 3 years? What carrier currently insures it and at what premium?
- The area grade is low — what's the realistic commute time and amenity access for the typical tenant pool here? Any planned neighborhood developments (good or bad) we should know about?
- What's the average days-on-market for RENTAL listings here right now (not sales)? A rising rental-DOM trend means longer vacancies and softer asking-rent achievability than the comps imply.
- What's the recent tenant-quality profile in this submarket — average credit score on applications, eviction rate, late-payment / NSF rate, and stable-employment percentage? A property-management company in the area should have these aggregated.
- How much new for-sale + rental construction is in the pipeline within 1–3 miles? Heavy new supply typically softens prices + rents 12–24 months out; constrained supply supports both.
Investment metrics
- 1% rule
- 0.47% ✗
- Cap rate
- 3.58%
- Cash-on-cash
- -9.69%
- DSCR
- 0.57
- GRM
- 17.8
CMA / ARV
- ARV (median comp)
- $261,457
- List price
- $288,000
- Delta
- 10.15%
- Verdict
- OVERPRICED
- Comps
- 20 within 1.0 mi
Show comp detail 4 sales within ~0.75 mi
| Address | Dist | Beds/Ba | Sqft | Sold | Price | $/sf | Match |
|---|---|---|---|---|---|---|---|
| 17363 Mackinaw | 0.36mi | 3/1.5 | 1,176 (-1%) | 1mo | $235,000 | $200 | 79 |
| 57145 Linda Ave | 0.37mi | 4/2.0 (+1) | 1,086 (-9%) | 8mo | $240,000 | $221 | 57 |
| 57150 Linda Ave | 0.39mi | 3/2.0 | 1,301 (+10%) | 12mo | $240,000 | $184 | 56 |
| 16917 Bridgette Dr | 0.48mi | 3/1.5 | 1,338 (+13%) | 17mo | $235,000 | $176 | 40 |
Match score weights: distance 35% · size 25% · config 20% · recency 20%. Top-matched comps best support the ARV.
Projected returns pro-forma
-3.0% appreciation · 3.0% rent growth · sell at horizon
- IRR
- -33.8%
- Equity multiple
- -0.09×
- Total profit
- $-88,297
- Equity at exit
- $42,942
- IRR
- -42.5%
- Equity multiple
- -0.62×
- Total profit
- $-130,902
- Equity at exit
- $24,901
Cash invested: $80,640 (down + closing). Projections, not guarantees.
Landlord ↔ Tenant lean methodology
- Overall (STATE)
- 62 Landlord-Friendly
- State Michigan
- 62 Landlord-Friendly · EVEN
- County
- — inherits STATE
- City
- — inherits STATE
ZIP-level market 49093
- Active inventory
- 178
- Price-to-rent
- 17.8×
Monthly cashflow live
- Estimated rent
- $1,348 medium interval (Pro) →
- Mortgage (P&I)
- −$1,510
- Tax from tax record
- −$73 /mo · $879/yr
- Insurance
- −$120
- HOA
- −$13
- Vacancy / Maint / Mgmt
- −$283
- Net cashflow
- $-651
Break-even live
UW: 25.0% down · 7.5% · 30yr · 1.5% tax · 5.0% vac · 8.0% maint · 8.0% mgmt
Financing live
Cash to close
- Down payment
- $72,000
- Closing costs
- $8,640
- Reserves months
- —
- Total cash needed
- —
Loan-product check · same deal, 3 products live
Conventional
25% down · 7.5% · 30yr
- Down + closing
- —
- Monthly P&I
- —
- Monthly cashflow
- —
- DSCR
- —
- Eligible?
- —
Personal DTI + credit; lowest rate.
DSCR
20% down · 8.5% · 30yr
- Down + closing
- —
- Monthly P&I
- —
- Monthly cashflow
- —
- DSCR
- —
- Eligible?
- —
No personal income docs; deal must DSCR.
Hard money
10% down · 12.0% · 12mo
- Down + closing
- —
- Monthly P&I
- —
- Monthly cashflow
- —
- DSCR
- —
- Eligible?
- —
Short-term bridge; refi at stabilization.
HOA detail
- Monthly dues
- $13 · $156/yr
- Likely covers
- water
Listing history 50 events
-
2026-06-15status $288,000 Pending 41 DOM
Show marketing remark (829 chars)
Sought after Tamarac Subdivision home with open concept living room, dining area, and kitchen in this spacious 3 bedroom, 2 bath with approximately 1,888 sq ft. The finished basement offers additional living space and includes a potential extra room. Recent updates include new flooring throughout the main level, new countertops, and brand new kitchen appliances including the refrigerator, dishwasher, and microwave. The washer, dryer, and water heater have all been replaced within the last two years. The home also features a brand new water softener and reverse osmosis drinking water system. Additional improvements include a recently pumped and inspected septic system and a new water line at the main. The fully fenced backyard features a large new cement patio, offering great outdoor space for relaxing or entertaining.
-
2026-06-15days on market $288,000 Active 41 DOM
Show marketing remark (829 chars)
Sought after Tamarac Subdivision home with open concept living room, dining area, and kitchen in this spacious 3 bedroom, 2 bath with approximately 1,888 sq ft. The finished basement offers additional living space and includes a potential extra room. Recent updates include new flooring throughout the main level, new countertops, and brand new kitchen appliances including the refrigerator, dishwasher, and microwave. The washer, dryer, and water heater have all been replaced within the last two years. The home also features a brand new water softener and reverse osmosis drinking water system. Additional improvements include a recently pumped and inspected septic system and a new water line at the main. The fully fenced backyard features a large new cement patio, offering great outdoor space for relaxing or entertaining.
-
2026-06-14days on market $288,000 Active 39 DOM
-
2026-06-13days on market $288,000 Active 38 DOM
-
2026-06-10days on market $288,000 Active 36 DOM
-
2026-06-09days on market $288,000 Active 35 DOM
-
2026-06-08days on market $288,000 Active 34 DOM
-
2026-06-07days on market $288,000 Active 33 DOM
-
2026-06-05days on market $288,000 Active 30 DOM
-
2026-06-03days on market $288,000 Active 29 DOM
-
2026-06-02days on market $288,000 Active 28 DOM
-
2026-06-01days on market $288,000 Active 27 DOM
-
2026-05-31days on market $288,000 Active 26 DOM
-
2026-05-30days on market $288,000 Active 25 DOM
-
2026-05-05$288,000 Active 831-char remark
Show marketing remark (829 chars)
Sought after Tamarac Subdivision home with open concept living room, dining area, and kitchen in this spacious 3 bedroom, 2 bath with approximately 1,888 sq ft. The finished basement offers additional living space and includes a potential extra room. Recent updates include new flooring throughout the main level, new countertops, and brand new kitchen appliances including the refrigerator, dishwasher, and microwave. The washer, dryer, and water heater have all been replaced within the last two years. The home also features a brand new water softener and reverse osmosis drinking water system. Additional improvements include a recently pumped and inspected septic system and a new water line at the main. The fully fenced backyard features a large new cement patio, offering great outdoor space for relaxing or entertaining.
-
2026-05-05$288,000 Active 829-char remark
Show marketing remark (829 chars)
Sought after Tamarac Subdivision home with open concept living room, dining area, and kitchen in this spacious 3 bedroom, 2 bath with approximately 1,888 sq ft. The finished basement offers additional living space and includes a potential extra room. Recent updates include new flooring throughout the main level, new countertops, and brand new kitchen appliances including the refrigerator, dishwasher, and microwave. The washer, dryer, and water heater have all been replaced within the last two years. The home also features a brand new water softener and reverse osmosis drinking water system. Additional improvements include a recently pumped and inspected septic system and a new water line at the main. The fully fenced backyard features a large new cement patio, offering great outdoor space for relaxing or entertaining.
-
2026-05-05$288,000 Active
Show marketing remark (829 chars)
Sought after Tamarac Subdivision home with open concept living room, dining area, and kitchen in this spacious 3 bedroom, 2 bath with approximately 1,888 sq ft. The finished basement offers additional living space and includes a potential extra room. Recent updates include new flooring throughout the main level, new countertops, and brand new kitchen appliances including the refrigerator, dishwasher, and microwave. The washer, dryer, and water heater have all been replaced within the last two years. The home also features a brand new water softener and reverse osmosis drinking water system. Additional improvements include a recently pumped and inspected septic system and a new water line at the main. The fully fenced backyard features a large new cement patio, offering great outdoor space for relaxing or entertaining.
-
2026-05-02historical
-
2026-04-24price $284,900
-
2026-04-24price $284,900
-
2026-04-24price $284,900
-
2026-03-26price $289,900
-
2026-03-25price $289,900
-
2026-03-25price $289,900
-
2026-03-09$296,000 Active
-
2026-03-09$296,000 Active
-
2019-04-10soldstatus $164,000
-
2019-03-29soldstatus $164,000
-
2019-03-29soldstatus $164,000 Sold
-
2019-03-12historical
-
2019-03-04$166,000
-
2019-03-04$166,000
-
2019-03-04$166,000
-
2016-09-30soldstatus $139,900
-
2016-09-29soldstatus $139,900
-
2016-09-29soldstatus $139,900 Sold
-
2016-08-29status Pending
-
2016-07-21price $139,900
-
2016-06-14$148,900 Active
-
2016-06-14$139,900
-
2014-09-26historical
-
2014-09-25historical
-
2014-09-25historical
-
2014-09-18historical
-
2010-07-13soldstatus $100,000
-
2010-07-13soldstatus $100,000
-
2010-05-31historical
-
2010-05-28$111,000
-
2010-05-28$111,000
-
2010-04-30$111,000
ⓘ Source: listings_history table (triggers on properties + properties_extension) + one-shot
backfill from property_details.listing_events for pre-trigger history.
Tax reassessment forecast MI · Partial reset (capped growth)
- Current annual tax
- $879 · $73/mo
- Projected year-2 tax
- $2,657 · $221/mo
- Expected delta
- +$1,778/yr (+$148/mo · 202.3%)
ⓘ Screening estimate from a state-policy table — verify with the county assessor before closing.
Climate risk First Street
- Flood 1/10 Low FEMA zone X (unshaded) · 0% chance over 30 yrs
- Wildfire 1/10 Low
- Heat 2/10 Low 7 d/yr ≥100°F today · 16 d/yr by 30 yrs out
- Wind 2/10 Low
- Air quality 2/10 Low 1 unhealthy d/yr today · 2 by 30 yrs out
Nearby sold comps map
Loading sold comps map…
Walkable amenities ~0.75 mi
Loading nearby amenities…
Taxation est. · year 1
- Rental income
- $16,181
- − Mortgage interest
- −$16,132
- − Property taxes
- −$879
- − Insurance
- −$1,440
- − Repairs & maintenance
- −$1,294
- − Management
- −$1,294
- − HOA
- −$156
- − Depreciation
- −$8,378
- Taxable loss
- −$13,393
- Est. tax savings @ 24.0%
- +$3,214
- After-tax cash flow
- $-4,601/yr
For passive investors: Depreciation is non-cash, so a rental often shows a tax loss while cash-flowing — sheltering income. Rental losses are passive: they offset passive income freely, and up to $25,000/yr can offset ordinary (W-2) income if you actively participate and your MAGI is under $100k (phasing out to $0 by $150k); unused losses carry forward. On sale, claimed depreciation is recaptured at up to 25%, and gains may owe capital-gains tax (a 1031 exchange can defer both). Figures are a year-1 estimate at your 24.0% rate — not tax advice; consult a CPA.
Schools (NCES district)
- District
- Three Rivers Community Schools
- NCES district ID
- 2633840
- Math proficiency
- 37% ▲ 1.00%
- Reading proficiency
- 45% ▼ -3.00%
- Median HH income
- $46,576
- Composite
- 34.97/100
- National rank
- #5058
- State rank
- #200 of 540 in MI
Livability — Three Rivers
- Score
- 70/100
- State rank
- #306
- US rank
- #7604
Category grades
Schools grade is shown separately in the Schools card above.
Census & demographics
- Population (ZIP)
- 18,439
Population outlook (St. Joseph County) Hauer SSP2
- Today (2025)
- 58,726 people
- By 2030
- 57,030 · -2.9%
- By 2040
- 53,266 · -9.3%
- By 2050
- 49,343 · -16.0%
- By 2075
- 40,441 · -31.1%
- By 2100
- 31,981 · -45.5%
Race, ethnicity, and origin ACS 2023
- Neighborhood character
- Predominantly White (84%)
- Race & ethnicity
- White 84% Two or more races 8% Hispanic / Latino 5% Black 5%
- Hispanic origin (detail)
- Mexican 4%
- Common ancestry
- Italian 11% Iranian 5% Romanian 3%
- Foreign-born
- 2% · Canada
- Languages at home
- 95% English-only · Spanish 3% Other Indo-European 1%
Political lean MEDSL · St. Joseph
- 2024 margin
- Solid R (+34.0) · D 32.2% · R 66.2% · Other 1.5%
- 2008→2024 swing
- -31.8pp toward R · 2008: -2.2pp · 2024: -34.0pp
- All cycles
- 2024: R+34.0 2020: R+31.7 2016: R+31.0 2012: R+12.3 2008: R+2.2
Not yet ingested
- Civics
- —
Market trends
- HPI YoY
- ▼ -159.07%
- Current HPI
- 226.5079
- Rent YoY
- —
- Metro
- —
- State GDP YoY
- ▲ 1.37%
- F500 in state
- 28
Industry mix (Fortune 500 HQ in MI)
| Industry | F500 HQs | Revenue |
|---|---|---|
| Automotive Parts | 3 | $48B |
|
||
| Automotive | 2 | $372B |
|
||
| Chemicals | 1 | $45B |
|
||
| Automotive Retail | 1 | $29B |
|
||
| Healthcare / Medical Devices | 1 | $23B |
|
||
| Automotive Technology | 1 | $20B |
|
||
Price history
+130.6% since first listed59 events — show timeline
- 2026-06-15 Pending — MiRealSource-MiMLS
- 2026-06-15 Pending — REALCOMP
- 2026-06-15 Pending — SW Michigan MLS
- 2026-05-05 Listed $288,000 SW Michigan MLS
- 2026-05-05 Listed $288,000 REALCOMP
- 2026-05-05 Listed $288,000 MiRealSource-MiMLS
- 2026-05-02 Listing Removed — MiRealSource-MiMLS
- 2026-04-24 Price Changed $284,900 MiRealSource-MiMLS
- 2026-04-24 Price Changed $284,900 REALCOMP
- 2026-04-24 Price Changed $284,900 SW Michigan MLS
- 2026-03-26 Price Changed $289,900 MiRealSource-MiMLS
- 2026-03-25 Price Changed $289,900 REALCOMP
- 2026-03-25 Price Changed $289,900 SW Michigan MLS
- 2026-03-09 Listed $296,000 REALCOMP
- 2026-03-09 Listed $296,000 MiRealSource-MiMLS
- 2019-04-10 Sold (Public Records) $164,000 Public Records
- 2019-03-29 Sold (MLS) $164,000 SW Michigan MLS
- 2019-03-29 Sold (MLS) $164,000 REALCOMP
- 2019-03-12 Listing Removed — SW Michigan MLS
- 2019-03-04 Listed $166,000 MiRealSource-MiMLS
- 2019-03-04 Listed $166,000 SW Michigan MLS
- 2019-03-04 Listed $166,000 REALCOMP
- 2016-09-30 Sold (Public Records) $139,900 Public Records
- 2016-09-29 Sold (MLS) $139,900 SW Michigan MLS
- 2016-09-29 Sold (MLS) $139,900 REALCOMP
- 2016-08-29 Pending — SW Michigan MLS
- 2016-07-21 Price Changed $139,900 SW Michigan MLS
- 2016-06-14 Listed $148,900 SW Michigan MLS
- 2016-06-14 Listed $139,900 REALCOMP
- 2014-09-26 Listing Removed — SW Michigan MLS
- 2014-09-25 Listing Removed — SW Michigan MLS
- 2014-09-25 Listing Removed — SW Michigan MLS
- 2014-09-18 Listing Removed — SW Michigan MLS
- 2010-07-13 Sold (MLS) $100,000 REALCOMP
- 2010-07-13 Sold (MLS) $100,000 SW Michigan MLS
- 2010-05-31 Listing Removed — REALCOMP
- 2010-05-28 Listed $111,000 REALCOMP
- 2010-05-28 Listed $111,000 SW Michigan MLS
- 2010-04-30 Listed $111,000 REALCOMP
- 2010-04-30 Listed $111,000 SW Michigan MLS
- 2008-08-22 Sold (MLS) $160,000 REALCOMP
- 2008-06-02 Listed $154,900 REALCOMP
- 2008-06-01 Listing Removed — REALCOMP
- 2008-02-29 Listed $158,000 REALCOMP
- 2008-02-29 Listed $158,000 SW Michigan MLS
- 2008-02-28 Listing Removed — REALCOMP
- 2007-01-02 Listed $158,000 REALCOMP
- 2007-01-02 Listed $158,000 SW Michigan MLS
- 2006-12-30 Listing Removed — REALCOMP
- 2006-07-12 Listed $159,000 REALCOMP
- 2006-07-12 Listed $159,000 SW Michigan MLS
- 2002-08-29 Listed $132,000 REALCOMP
- 2002-08-29 Listed $132,000 SW Michigan MLS
- 2002-08-29 Sold (MLS) $132,000 REALCOMP
- 2002-08-29 Sold (MLS) $132,000 SW Michigan MLS
- 2000-06-05 Sold (MLS) $124,000 REALCOMP
- 2000-06-05 Sold (MLS) $124,000 SW Michigan MLS
- 1999-10-04 Listed $124,900 REALCOMP
- 1999-10-04 Listed $124,900 SW Michigan MLS
Property tax history
-4.4%/yrLatest (2025): $879 · -61.0% YoY. Source: county tax records.
Cash-flow waterfall
monthlySold comps — $/sqft
last 12 mo · ≤1 miLoading sold comps…