12 Lyra Way · Coto de Caza, CA
Flood risk 3/10 · Minor
- FEMA flood zone
- X (unshaded)
- Chance of flooding over 30 yrs
- 0.1%
- Est. flood insurance / yr
- $507 – $1,088
Fire risk 6/10 · Moderate
- Est. fire insurance / yr
- $659 – $1,223
Heat risk 5/10 · Moderate
- Hot days now (above 96°F)
- 6 days/yr
- Hot days in 30 yrs
- 19 days/yr
Wind risk 1/10 · Minimal
- Chance of severe wind over 30 yrs
- —
Air-quality risk 4/10 · Minor
- Unhealthy air days now
- 5 days/yr
- Unhealthy air days in 30 yrs
- 5 days/yr
Risk factors via First Street. Map © Google.
Why this score? — see what drove the D- grade
The composite is a weighted blend of 9 inputs, each scored 0–100. Each bar is that input's sub-score; the figure is the points it added to the 100-point composite (weight × sub-score).
- ARV discount +12.7/15.0
- Appreciation +7.1/10.0
- Schools +5.7/10.0
- Rent growth +4.5/5.0
- Cash flow +3.2/30.0
- Livability +2.9/5.0
- Condition / age +2.5/5.0
- 1% rule +0.0/10.0
- DSCR +0.0/10.0
$1,698,000
🖨 Deal sheet 📄 Offer letter ✓ Due diligence
Listing remarks
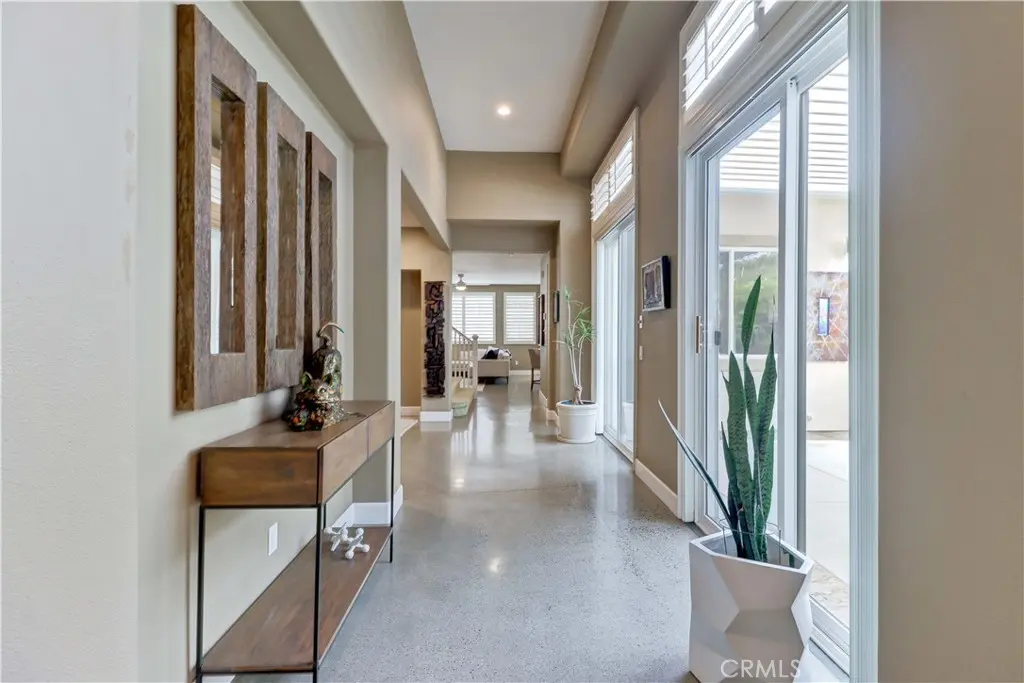
Must see to appreciate! NO MELLO ROOS! SELLER OFFERING BUYER A $15,000 CONCESSION IF ESCROW OPENS BY JULY 1ST. Stunning home is situated in the GATED community of Coto de Caza. This fully REPIPED residence features three sliding glass doors with expansive windows and wood shutters throughout, allowing sunlight to pour into the OPEN CONCEPT LIVING SPACE. Clean lines highlight the airy, welcoming ambience. The crisp, modern esthetic is enhanced by the perfect blend of warmth and modern design maximizing daylight and giving off a calm, bright, vibrant and sophisticated living environment. Recessed lighting has been upgraded throughout, including closets. Two louvered patios in the atrium and
Key facts
- Gas wolf range
- Recessed lighting
- 6,193 sq ft lot
Tags
Property features AI
Finance
- Financial info: Subject to special assessments
- HOA & community: Part of an association (CZ Master); Monthly association dues (fee listed separately); Community amenities include sport courts, hiking and horse trails, tennis, golf, pool, clubhouse and spa; Neighborhood features include curbs, street lighting, sidewalks, parks and storm drains
Exterior
- Parking: Attached garage; Approximately 2.5 garage spaces; About 2 uncovered parking spaces; Approximately 4.5 total parking spaces
- Security: Community with gated/south guard gate access; Multiple access/exit points
- Utilities: Public sewer; Public/district water; Natural gas connected; Electricity connected
- Home design: Planned development community; Two stories; No common walls; Patio-style home; Front-facing entry; Has a view
- Construction: No accessory dwelling unit (ADU); Year built reported by assessor
- Exterior features: House structure; Awning; Covered concrete patio and open patios with wrap-around design; Community pool and spa access; Sprinkler system (including drip); Front and back yard; Brick wall fencing in good condition
Interior
- Kitchen: Garbage disposal; Gas range; Dishwasher; Kitchen island; Kitchen open to family room; Breakfast counter/bar; Formal dining area
- Bedrooms: All bedrooms are on the upper level; Walk-in closet; Office (flex space)
- Flooring: Carpet; Concrete; Additional flooring details noted in remarks
- Bathrooms: Three full bathrooms; One half bathroom; Upgraded finishes; Master bath with double sinks and vanity area; Walk-in shower and shower in tub; Linen storage
- Heating & cooling: Central heating (furnace); Central air conditioning
- Interior features: Built-in shelving/cabinets; Ceiling fans; Pantry; Recessed lighting; Open floor plan; Plantation shutters; Two levels; Front entry
- Laundry & utility: Washer hookup; Gas dryer hookup; Dedicated laundry room on upper level
Neighborhood map
What this means for you Summary
Snapshot
- This is a 3-bed/4.0-bath single-family listed at $1.70M.
Deal economics
- At list price, monthly cash flow is $-5k ($-64k/yr) — negative.
- To cash-flow at today's rent, offer at most $757k (55.4% below list).
- To meet the 1% rule (rent ≥ 1% of price), the offer needs to be $655k (61.4% below list).
- Recommended offer: $655k (61.4% below list) — sets the bar for 1% rule.
- Cap rate 2.5% vs local median 1.7% in Coto de Caza — top-decile yield for the area; either an underpriced asset or a hidden risk that comps aren't pricing in. Stress-test before assuming the spread holds.
Location & tenants
- Location reads 57/100 on livability (#745 in CA) — a working-class tenant base; expect higher turnover. Strengths: employment A+, crime A-, housing B+; Watch: amenities F, commute F, cost of living F.
- Capistrano Unified (suburban): math 50% / reading 72% proficiency, ranked #64 of 517 in CA (top 12%) — acceptable for families but not a draw, mixed tenant base, ~2y average lease; only 19% free/reduced lunch — higher-income household profile.
- Zoned schools: Wagon Wheel Elementary (431 students, 15% FRL); Las Flores Middle (571 students, 22% FRL) — zoned schools at 18% FRL track the district average.
- Market conditions: Rents rising fast (+7.8%/yr); 126 active listings in the ZIP; 2 comparable units currently listed for rent nearby; high-income renter base; 6,974 units permitted in Orange County in 2024 (3,839 in 5+ unit buildings).
- This rent runs 37% of the median local income ($211k/yr) — at the standard rent-burdened threshold; future hikes will face affordability resistance.
Forward outlook
- In year one you build about $84k of equity ($12k loan paydown + $72k appreciation (4.3% local appreciation)).
- Orange County population projected at +14% by 2050 — modest demand growth; plan on rents tracking national, not racing it.
- By year 2, paydown + projected appreciation supports a ~$135k cash-out refi (75% LTV) — recoverable capital for the next deal without selling this one.
Negotiation context
- It's been on market 35 days — a 3% lower offer ($1.65M) is reasonable based on typical stale-listing flexibility.
- Current owner paid $383k; list at $1.70M implies a 343% gain — meaningful room to come down on a strong offer.
Risks & watch-outs
- Climate carrying-cost: major wildfire risk; extreme-heat days projected 6→19/yr by 2055 (HVAC capex compounding) — expect insurance premiums to compound above CPI over the hold.
Questions for the listing agent
- What do current leases actually rent for vs. the listed asking? Can we see a recent rent roll and the last 12 months of T-12 income?
- It's been on market 35 days. Have you received any prior offers? Is the seller open to a 61% concession, seller financing, or rate buy-down credit?
- What does the HOA fee cover, when was the last increase, and are there any pending special assessments or reserve-fund shortfalls?
- Is there a deadline driving the sale (1031 exchange, divorce, estate, relocation)? That informs how much negotiation room exists.
- Schools are A-rated — typically a magnet for longer-tenancy family renters. What's the average tenant stay here, and is there a school-zone premium baked into asking?
- The area grade is low — what's the realistic commute time and amenity access for the typical tenant pool here? Any planned neighborhood developments (good or bad) we should know about?
- What's the average days-on-market for RENTAL listings here right now (not sales)? A rising rental-DOM trend means longer vacancies and softer asking-rent achievability than the comps imply.
- What's the recent tenant-quality profile in this submarket — average credit score on applications, eviction rate, late-payment / NSF rate, and stable-employment percentage? A property-management company in the area should have these aggregated.
- How much new for-sale + rental construction is in the pipeline within 1–3 miles? Heavy new supply typically softens prices + rents 12–24 months out; constrained supply supports both.
Investment metrics
- 1% rule
- 0.39% ✗
- Cap rate
- 2.53%
- Cash-on-cash
- -13.44%
- DSCR
- 0.40
- GRM
- 21.6
CMA / ARV
- ARV (median comp)
- $1,920,441
- List price
- $1,698,000
- Delta
- -11.58%
- Verdict
- UNDERPRICED
- Comps
- 20 within 1.0 mi
Show comp detail 5 sales within ~0.75 mi
| Address | Dist | Beds/Ba | Sqft | Sold | Price | $/sf | Match |
|---|---|---|---|---|---|---|---|
| 47 Lyra Way | 0.17mi | 4/4.0 (+1) | 2,970 (0%) | 11mo | $2,070,000 | $697 | 78 |
| 45 Lyra Way | 0.16mi | 4/4.0 (+1) | 2,970 (0%) | 21mo | $2,375,000 | $800 | 70 |
| 23 Constellation | 0.32mi | 4/3.0 (+1) | 2,703 (-9%) | 1mo | $1,700,000 | $629 | 60 |
| 46 Vela Ct | 0.25mi | 4/4.5 (+1) | 3,379 (+14%) | 16mo | $2,000,000 | $592 | 45 |
| 12 Sagitta Way | 0.31mi | 4/3.0 (+1) | 2,700 (-9%) | 22mo | $1,599,000 | $592 | 43 |
Match score weights: distance 35% · size 25% · config 20% · recency 20%. Top-matched comps best support the ARV.
Projected returns pro-forma
4.26% appreciation · 7.8% rent growth · sell at horizon
- IRR
- 0.5%
- Equity multiple
- 1.03×
- Total profit
- $13,540
- Equity at exit
- $886,445
- IRR
- 5.2%
- Equity multiple
- 1.94×
- Total profit
- $448,798
- Equity at exit
- $1,470,606
Cash invested: $475,440 (down + closing). Projections, not guarantees.
Landlord ↔ Tenant lean methodology
- Overall (STATE)
- 18 Strongly Tenant-Friendly
- State California
- 18 Strongly Tenant-Friendly · D+13
- County
- — inherits STATE
- City
- — inherits STATE
ZIP-level market 92679
- Home prices YoY
- 1.1%
- Rents YoY
- 7.8%
- Active inventory
- 126
- Price-to-rent
- 21.6×
Monthly cashflow live
- Estimated rent
- $6,550 medium interval (Pro) →
- Mortgage (P&I)
- −$8,904
- Tax from tax record
- −$501 /mo · $6,015/yr
- Insurance
- −$708
- HOA
- −$385
- Vacancy / Maint / Mgmt
- −$1,375
- Net cashflow
- $-5,324
Break-even live
UW: 25.0% down · 7.5% · 30yr · 1.5% tax · 5.0% vac · 8.0% maint · 8.0% mgmt
Financing live
Cash to close
- Down payment
- $424,500
- Closing costs
- $50,940
- Reserves months
- —
- Total cash needed
- —
Loan-product check · same deal, 3 products live
Conventional
25% down · 7.5% · 30yr
- Down + closing
- —
- Monthly P&I
- —
- Monthly cashflow
- —
- DSCR
- —
- Eligible?
- —
Personal DTI + credit; lowest rate.
DSCR
20% down · 8.5% · 30yr
- Down + closing
- —
- Monthly P&I
- —
- Monthly cashflow
- —
- DSCR
- —
- Eligible?
- —
No personal income docs; deal must DSCR.
Hard money
10% down · 12.0% · 12mo
- Down + closing
- —
- Monthly P&I
- —
- Monthly cashflow
- —
- DSCR
- —
- Eligible?
- —
Short-term bridge; refi at stabilization.
Rent comps 2 comps
| Address | Beds | Baths | Sqft | Rent | $/sqft | DOM | Units | Dist |
|---|---|---|---|---|---|---|---|---|
| 16 Sharon Ln Trabuco Canyon, CA | 4.0 | 4.5 | 4100 | $7,590 | $1.85 | 24d | 1 | 0.52mi |
| 53 Fosco St Rancho Mission Viejo, CA | 4.0 | 3.0 | 2021 | $5,500 | $2.72 | 6d | 1 | 1.42mi |
HOA detail
- Monthly dues
- $385 · $4,620/yr
- Likely covers
- security
Listing history 17 events
-
2026-06-18days on market $1,698,000 Active 35 DOM
-
2026-06-17days on market $1,698,000 Active 34 DOM
-
2026-06-16days on market $1,698,000 Active 33 DOM
-
2026-06-15pricedays on market $1,698,000 Active 32 DOM
-
2026-06-13days on market $1,699,000 Active 30 DOM
-
2026-06-13days on market $1,699,000 Active 29 DOM
-
2026-06-09days on market $1,699,000 Active 26 DOM
-
2026-06-08days on market $1,699,000 Active 25 DOM
-
2026-06-08price $1,699,000 Active 24 DOM
-
2026-06-07days on market $1,724,999 Active 24 DOM
-
2026-06-04days on market $1,724,999 Active 21 DOM
-
2026-06-03days on market $1,724,999 Active 20 DOM
-
2026-06-02days on market $1,724,999 Active 19 DOM
-
2026-06-01days on market $1,724,999 Active 18 DOM
-
2026-05-31days on market $1,724,999 Active 17 DOM
-
2026-05-14$1,749,999 Active 2092-char remark
-
1998-12-31soldstatus $383,000
ⓘ Source: listings_history table (triggers on properties + properties_extension) + one-shot
backfill from property_details.listing_events for pre-trigger history.
Tax reassessment forecast CA · Resets to sale price
- Current annual tax
- $6,015 · $501/mo
- Projected year-2 tax
- $12,905 · $1,075/mo
- Expected delta
- +$6,890/yr (+$574/mo · 114.5%)
ⓘ Screening estimate from a state-policy table — verify with the county assessor before closing.
Climate risk First Street
- Flood 3/10 Moderate FEMA zone X (unshaded) · 10% chance over 30 yrs
- Wildfire 6/10 Major
- Heat 5/10 Major 6 d/yr ≥96°F today · 19 d/yr by 30 yrs out
- Wind 1/10 Low
- Air quality 4/10 Moderate 5 unhealthy d/yr today · 5 by 30 yrs out
Nearby sold comps map
Loading sold comps map…
Walkable amenities ~0.75 mi
Loading nearby amenities…
Taxation est. · year 1
- Rental income
- $78,597
- − Mortgage interest
- −$95,114
- − Property taxes
- −$6,015
- − Insurance
- −$8,490
- − Repairs & maintenance
- −$6,288
- − Management
- −$6,288
- − HOA
- −$4,620
- − Depreciation
- −$49,396
- Taxable loss
- −$97,615
- Est. tax savings @ 24.0%
- +$23,427
- After-tax cash flow
- $-40,460/yr
For passive investors: Depreciation is non-cash, so a rental often shows a tax loss while cash-flowing — sheltering income. Rental losses are passive: they offset passive income freely, and up to $25,000/yr can offset ordinary (W-2) income if you actively participate and your MAGI is under $100k (phasing out to $0 by $150k); unused losses carry forward. On sale, claimed depreciation is recaptured at up to 25%, and gains may owe capital-gains tax (a 1031 exchange can defer both). Figures are a year-1 estimate at your 24.0% rate — not tax advice; consult a CPA.
Schools (NCES district)
- District
- Capistrano Unified
- NCES district ID
- 0607440
- Math proficiency
- 50% ▼ -11.00%
- Reading proficiency
- 72% ▲ 2.00%
- Median HH income
- $99,673
- Composite
- 56.56/100
- National rank
- #1147
- State rank
- #64 of 517 in CA
Livability — Coto de Caza
- Score
- 57/100
- State rank
- #745
- US rank
- #21857
Category grades
Schools grade is shown separately in the Schools card above.
Census & demographics
- Census place
- Coto de Caza, CA
- County
- Orange County · 3,096,323 people
- City population
- 30,818
- Metro
- Los Angeles-Long Beach-Anaheim, CA
- Population (ZIP)
- 30,818
- Household income
- $211,250
- Rent vs Own
- Severe rent burden
- 290.0
Population outlook (Orange County) Hauer SSP2
- Today (2025)
- 3,477,456 people
- By 2030
- 3,613,117 · +3.9%
- By 2040
- 3,835,945 · +10.3%
- By 2050
- 3,968,736 · +14.1%
- By 2075
- 4,097,053 · +17.8%
- By 2100
- 3,903,633 · +12.3%
Race, ethnicity, and origin ACS 2023
- Neighborhood character
- Predominantly White (67%)
- Race & ethnicity
- White 67% Hispanic / Latino 16% Two or more races 12% Asian 9% Black 2%
- Hispanic origin (detail)
- Mexican 9% Puerto Rican 2%
- Common ancestry
- Italian 3% Lithuanian 3% Slovak 2%
- Foreign-born
- 15% · Canada, China, South Korea
- Languages at home
- 82% English-only · Spanish 8% Other Indo-European 3% Chinese 2%
Political lean MEDSL · Orange
- 2024 margin
- Toss-up / Even · D 49.7% · R 47.1% · Other 3.2%
- 2008→2024 swing
- +5.2pp toward D · 2008: -2.6pp · 2024: 2.6pp
- All cycles
- 2024: D+2.6 2020: D+9.0 2016: D+7.7 2012: R+8.3 2008: R+2.6
Not yet ingested
- Civics
- —
Market trends
- HPI YoY
- ▲ 4.26%
- Current HPI
- 391.0085
- Rent YoY
- ▲ 7.80%
- Metro
- Los Angeles-Long Beach-Anaheim, CA
- State GDP YoY
- ▲ 3.21%
- F500 in state
- 116
Industry mix (Fortune 500 HQ in CA)
| Industry | F500 HQs | Revenue |
|---|---|---|
| Technology | 27 | $1,492B |
|
||
| Financial Services | 3 | $174B |
|
||
| Retail | 3 | $44B |
|
||
| Insurance | 3 | $26B |
|
||
| Media / Entertainment | 2 | $115B |
|
||
| Pharmaceuticals / Biotech | 2 | $62B |
|
||
Price history
+343.3% since first listed5 events — show timeline
- 2026-06-14 Price Changed $1,698,000 CRMLS
- 2026-06-07 Price Changed $1,699,000 CRMLS
- 2026-05-26 Price Changed $1,724,999 CRMLS
- 2026-05-14 Listed $1,749,999 CRMLS
- 1998-12-31 Sold (Public Records) $383,000 Public Records
Property tax history
+0.6%/yrLatest (2025): $6,015 · +2.0% YoY. Source: county tax records.
Cash-flow waterfall
monthlySold comps — $/sqft
last 12 mo · ≤1 miLoading sold comps…