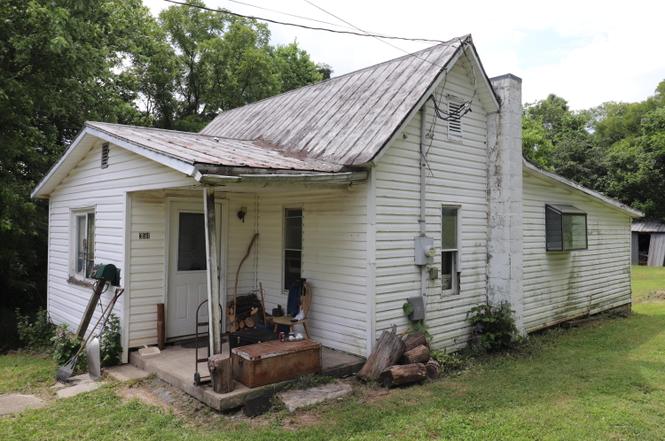
354 Garrett Ave · Brooksville, KY
Flood risk 1/10 · Minimal
- FEMA flood zone
- X (unshaded)
- Chance of flooding over 30 yrs
- 0.0%
- Est. flood insurance / yr
- $507 – $1,088
Fire risk 3/10 · Minor
- Est. fire insurance / yr
- $839 – $1,559
Heat risk 4/10 · Minor
- Hot days now (above 102°F)
- 7 days/yr
- Hot days in 30 yrs
- 19 days/yr
Wind risk 2/10 · Minimal
- Chance of severe wind over 30 yrs
- 1.0%
Air-quality risk 2/10 · Minimal
- Unhealthy air days now
- 0 days/yr
- Unhealthy air days in 30 yrs
- 1 days/yr
Risk factors via First Street. Map © Google.
Why this score? — see what drove the B+ grade
The composite is a weighted blend of 9 inputs, each scored 0–100. Each bar is that input's sub-score; the figure is the points it added to the 100-point composite (weight × sub-score).
- Cash flow +30.0/30.0
- 1% rule +10.0/10.0
- DSCR +10.0/10.0
- Appreciation +10.0/10.0
- ARV discount +7.5/15.0
- Livability +3.2/5.0
- Schools +2.7/10.0
- Rent growth +2.5/5.0
- Condition / age +2.5/5.0
$35,000
🖨 Deal sheet 📄 Offer letter ✓ Due diligence
Listing remarks
Opportunity Awaits!! Bring your vision to life on this half acre lot. This charming fixer-upper is like a blank canvas just waiting to be transformed into your dream home!! Or. .. .. A half acre within city limits with city utilities to build equity and create a personalized haven to build your dream home. Envision the possibilities and capitalize on the potential for value appreciation with your thoughtful ideas!! Bring your creative touch or your favorite builder!! Awesome opportunity for your dream home either way!!!
Key facts
- City utilities
- Half acre lot
- 0.53 acre lot
Tags
Property features AI
Exterior
- Parking: Driveway; On-street parking
- Utilities: Public water; Public sewer; Cable available
- Home design: Single-family residence; One level; Built in 1950
- Construction: Vinyl siding; Metal roof; Block foundation
- Exterior features: Deck; Porch; Outbuilding; Partially wooded lot; Has view
Interior
- Kitchen: Kitchen (12 x 11)
- Bedrooms: Primary bedroom (15 x 12); Bedroom 2 (10 x 9); Bedroom 3 (8 x 7); Bonus room (11 x 8)
- Bathrooms: 1 full bathroom (Primary bath 9 x 5)
- Heating & cooling: Wood stove heating
- Interior features: Entrance foyer; Built-in features; Ceiling fan(s)
- Laundry & utility: Partial basement
Neighborhood map
What this means for you Summary
Snapshot
- This is a 2-bed/1.0-bath single-family listed at $35k.
Deal economics
- At list price, monthly cash flow is $531 ($6k/yr) — positive.
- The deal already cash-flows at list — no discount required.
- Meets the 1% rule at list price ($978 rent vs $35k).
- Recommended offer: $31k (12.0% below list) — sets the bar for market timing.
Location & tenants
- Location reads 64/100 on livability (#293 in KY) — a middle-class / working-renter tenant base. Strengths: crime A+, cost of living A+; Watch: health & safety C-, amenities F, commute F.
- Bracken County (rural): math 27% / reading 38% proficiency, ranked #86 of 165 in KY (top 52%) — families likely to look elsewhere, expect single-tenant / working-renter base with shorter leases.
- Zoned schools: Taylor Elementary School (math 29% / reading 31%, grade F, #388 of 676 statewide, top 58%, 522 students, 53% FRL); Bracken County Middle School (math 28% / reading 47%, grade F, #73 of 217 statewide, top 36%, 259 students, 53% FRL); Bracken County High School (math 17% / reading 27%, grade F, #202 of 254 statewide, top 82%, 364 students, 54% FRL).
- Market conditions: 21 active listings in the ZIP.
Forward outlook
- In year one you build about $4k of equity ($242 loan paydown + $4k appreciation (10.0% local appreciation)).
- Bracken County population projected at -22% by 2050 — secular population decline; favor cash flow + early exit over multi-decade hold.
- At projected returns (10.0% appreciation + 3.0% rent growth), your $10k cash investment doubles in ~1 year — after that, you're playing with house money.
- By year 8, paydown + projected appreciation supports a ~$33k cash-out refi (75% LTV) — recoverable capital for the next deal without selling this one.
Negotiation context
- It's been on market 317 days — a 12% lower offer ($31k) is reasonable based on typical stale-listing flexibility.
- Current owner paid $22k; list at $35k implies a 56% gain — meaningful room to come down on a strong offer.
Risks & watch-outs
- Watch-outs: built in 1950 — expect roof / HVAC / electrical / plumbing capex.
Questions for the listing agent
- It's been on market 317 days. Have you received any prior offers? Is the seller open to a 12% concession, seller financing, or rate buy-down credit?
- Built in 1950 — when were the roof, HVAC, electrical panel, plumbing, and water heater last replaced?
- Why hasn't it sold? Are there any deal-killer items the seller is aware of (foundation, flood, title, zoning, code violations)?
- Is there a deadline driving the sale (1031 exchange, divorce, estate, relocation)? That informs how much negotiation room exists.
- Schools are D-rated, which usually means shorter tenancies and higher turnover. Who's the typical renter profile here, and what's been the actual vacancy rate?
- What's the average days-on-market for RENTAL listings here right now (not sales)? A rising rental-DOM trend means longer vacancies and softer asking-rent achievability than the comps imply.
- What's the recent tenant-quality profile in this submarket — average credit score on applications, eviction rate, late-payment / NSF rate, and stable-employment percentage? A property-management company in the area should have these aggregated.
- How much new for-sale + rental construction is in the pipeline within 1–3 miles? Heavy new supply typically softens prices + rents 12–24 months out; constrained supply supports both.
Investment metrics
- 1% rule
- 2.80% ✓
- Cap rate
- 24.50%
- Cash-on-cash
- 65.02%
- DSCR
- 3.89
- GRM
- 3.0
CMA / ARV
- ARV (on-the-fly)
- $146,864
- Comps found
- 4
Show comp detail 4 sales within ~0.75 mi
| Address | Dist | Beds/Ba | Sqft | Sold | Price | $/sf | Match |
|---|---|---|---|---|---|---|---|
| 115 Woodward Ave | 0.26mi | 2/1.5 | 969 (-10%) | 0mo | $125,000 | $129 | 69 |
| 109 Wallin St | 0.35mi | 2/1.0 | 1,032 (-4%) | 10mo | $160,000 | $155 | 69 |
| 108 Lincoln Ave | 0.34mi | 2/1.0 | 991 (-8%) | 10mo | $85,500 | $86 | 63 |
| 317 W Miami St | 0.64mi | 3/1.0 (+1) | 936 (-13%) | 17mo | $128,500 | $137 | 30 |
Match score weights: distance 35% · size 25% · config 20% · recency 20%. Top-matched comps best support the ARV.
Projected returns pro-forma
10.0% appreciation · 3.0% rent growth · sell at horizon
- IRR
- 76.6%
- Equity multiple
- 6.40×
- Total profit
- $52,895
- Equity at exit
- $31,531
- IRR
- 70.6%
- Equity multiple
- 14.18×
- Total profit
- $129,202
- Equity at exit
- $67,997
Cash invested: $9,800 (down + closing). Projections, not guarantees.
Landlord ↔ Tenant lean methodology
- Overall (STATE)
- 83 Strongly Landlord-Friendly
- State Kentucky
- 83 Strongly Landlord-Friendly · R+16
- County
- — inherits STATE
- City
- — inherits STATE
ZIP-level market 41004
- Home prices YoY
- 3.6%
- Active inventory
- 21
- Price-to-rent
- 3.0×
Monthly cashflow live
- Estimated rent
- $978 medium interval (Pro) →
- Mortgage (P&I)
- −$184
- Tax est. 1.5%
- −$44 /mo · $525/yr
- Insurance
- −$15
- HOA
- −$0
- Vacancy / Maint / Mgmt
- −$205
- Net cashflow
- $531
Break-even live
UW: 25.0% down · 7.5% · 30yr · 1.5% tax · 5.0% vac · 8.0% maint · 8.0% mgmt
Financing live
Cash to close
- Down payment
- $8,750
- Closing costs
- $1,050
- Reserves months
- —
- Total cash needed
- —
Loan-product check · same deal, 3 products live
Conventional
25% down · 7.5% · 30yr
- Down + closing
- —
- Monthly P&I
- —
- Monthly cashflow
- —
- DSCR
- —
- Eligible?
- —
Personal DTI + credit; lowest rate.
DSCR
20% down · 8.5% · 30yr
- Down + closing
- —
- Monthly P&I
- —
- Monthly cashflow
- —
- DSCR
- —
- Eligible?
- —
No personal income docs; deal must DSCR.
Hard money
10% down · 12.0% · 12mo
- Down + closing
- —
- Monthly P&I
- —
- Monthly cashflow
- —
- DSCR
- —
- Eligible?
- —
Short-term bridge; refi at stabilization.
Listing history 21 events
-
2026-06-18days on market $35,000 Active 317 DOM
-
2026-06-17days on market $35,000 Active 316 DOM
-
2026-06-16days on market $35,000 Active 315 DOM
-
2026-06-15days on market $35,000 Active 314 DOM
-
2026-06-13days on market $35,000 Active 312 DOM
-
2026-06-12pricedays on market $35,000 Active 311 DOM
-
2026-06-09days on market $39,900 Active 308 DOM
-
2026-06-08days on market $39,900 Active 307 DOM
-
2026-06-07days on market $39,900 Active 306 DOM
-
2026-06-05days on market $39,900 Active 304 DOM
-
2026-06-04days on market $39,900 Active 302 DOM
-
2026-06-02days on market $39,900 Active 301 DOM
-
2026-06-01days on market $39,900 Active 300 DOM
-
2026-05-31days on market $39,900 Active 299 DOM
-
2026-05-31days on market $39,900 Active 298 DOM
-
2026-04-13price $39,900
-
2025-11-12price $49,900
-
2025-10-06price $59,900
-
2025-09-08price $69,900
-
2025-08-04$79,900 Active
-
2001-04-01soldstatus $22,500
ⓘ Source: listings_history table (triggers on properties + properties_extension) + one-shot
backfill from property_details.listing_events for pre-trigger history.
Climate risk First Street
- Flood 1/10 Low FEMA zone X (unshaded) · 0% chance over 30 yrs
- Wildfire 3/10 Moderate
- Heat 4/10 Moderate 7 d/yr ≥102°F today · 19 d/yr by 30 yrs out
- Wind 2/10 Low 100% chance of damaging wind over 30 yrs
- Air quality 2/10 Low 0 unhealthy d/yr today · 1 by 30 yrs out
Nearby sold comps map
Loading sold comps map…
Walkable amenities ~0.75 mi
Loading nearby amenities…
Taxation est. · year 1
- Rental income
- $11,740
- − Mortgage interest
- −$1,961
- − Property taxes
- −$525
- − Insurance
- −$175
- − Repairs & maintenance
- −$939
- − Management
- −$939
- − Depreciation
- −$1,018
- Taxable income
- $6,183
- Est. tax owed @ 24.0%
- −$1,484
- After-tax cash flow
- $4,888/yr
For passive investors: Depreciation is non-cash, so a rental often shows a tax loss while cash-flowing — sheltering income. Rental losses are passive: they offset passive income freely, and up to $25,000/yr can offset ordinary (W-2) income if you actively participate and your MAGI is under $100k (phasing out to $0 by $150k); unused losses carry forward. On sale, claimed depreciation is recaptured at up to 25%, and gains may owe capital-gains tax (a 1031 exchange can defer both). Figures are a year-1 estimate at your 24.0% rate — not tax advice; consult a CPA.
Schools (NCES district)
- District
- Bracken County
- NCES district ID
- 2100660
- Math proficiency
- 27% ▼ -17.00%
- Reading proficiency
- 38% ▼ -12.00%
- Median HH income
- $41,507
- Composite
- 27.42/100
- National rank
- #6967
- State rank
- #86 of 165 in KY
Livability — Brooksville
- Score
- 64/100
- State rank
- #293
- US rank
- #14121
Category grades
Schools grade is shown separately in the Schools card above.
Census & demographics
- Census place
- Brooksville, KY
- County
- Bracken · 8,179 people
- Metro
- Cincinnati, OH-KY-IN
- Population (ZIP)
- 4,105
- Household income
- $59,944
- Rent vs Own
Population outlook (Bracken County) Hauer SSP2
- Today (2025)
- 8,026 people
- By 2030
- 7,751 · -3.4%
- By 2040
- 7,054 · -12.1%
- By 2050
- 6,246 · -22.2%
- By 2075
- 4,453 · -44.5%
- By 2100
- 2,941 · -63.4%
Race, ethnicity, and origin ACS 2023
- Neighborhood character
- Predominantly White (94%)
- Race & ethnicity
- White 94% Two or more races 4% Black 2%
- Common ancestry
- Lithuanian 3% Slovak 3% Serbian 2%
- Foreign-born
- 0%
Political lean MEDSL · Bracken
- 2024 margin
- Solid R (+65.0) · D 16.9% · R 82.0% · Other 1.1%
- 2008→2024 swing
- -40.8pp toward R · 2008: -24.3pp · 2024: -65.0pp
- All cycles
- 2024: R+65.0 2020: R+61.2 2016: R+57.0 2012: R+27.3 2008: R+24.3
Not yet ingested
- Civics
- —
Market trends
- HPI YoY
- ▲ 10.21%
- Current HPI
- 290.6204
- Rent YoY
- —
- Metro
- —
- State GDP YoY
- ▲ 1.81%
- F500 in state
- 4
Industry mix (Fortune 500 HQ in KY)
| Industry | F500 HQs | Revenue |
|---|---|---|
| Healthcare | 1 | $118B |
|
||
| Food / Beverage | 1 | $7B |
|
||
Price history
+77.3% since first listed6 events — show timeline
- 2026-04-13 Price Changed $39,900 NKMLS
- 2025-11-12 Price Changed $49,900 NKMLS
- 2025-10-06 Price Changed $59,900 NKMLS
- 2025-09-08 Price Changed $69,900 NKMLS
- 2025-08-04 Listed $79,900 NKMLS
- 2001-04-01 Sold (Public Records) $22,500 Public Records
Cash-flow waterfall
monthlySold comps — $/sqft
last 12 mo · ≤1 miLoading sold comps…