8074 Perry Creek Rd #31 · Grizzly Flats, CA
Flood risk 1/10 · Minimal
- FEMA flood zone
- X (unshaded)
- Chance of flooding over 30 yrs
- 0.0%
- Est. flood insurance / yr
- $507 – $1,088
Fire risk 8/10 · Major
- Est. fire insurance / yr
- $659 – $1,223
Heat risk 6/10 · Moderate
- Hot days now (above 98°F)
- 7 days/yr
- Hot days in 30 yrs
- 16 days/yr
Wind risk 1/10 · Minimal
- Chance of severe wind over 30 yrs
- —
Air-quality risk 10/10 · Severe
- Unhealthy air days now
- 27 days/yr
- Unhealthy air days in 30 yrs
- 31 days/yr
Risk factors via First Street. Map © Google.
Why this score? — see what drove the B- grade
The composite is a weighted blend of 9 inputs, each scored 0–100. Each bar is that input's sub-score; the figure is the points it added to the 100-point composite (weight × sub-score).
- Cash flow +30.0/30.0
- 1% rule +10.0/10.0
- DSCR +10.0/10.0
- ARV discount +7.5/15.0
- Schools +3.9/10.0
- Livability +2.7/5.0
- Rent growth +2.5/5.0
- Condition / age +2.5/5.0
- Appreciation +0.0/10.0
$85,500
🖨 Deal sheet 📄 Offer letter ✓ Due diligence
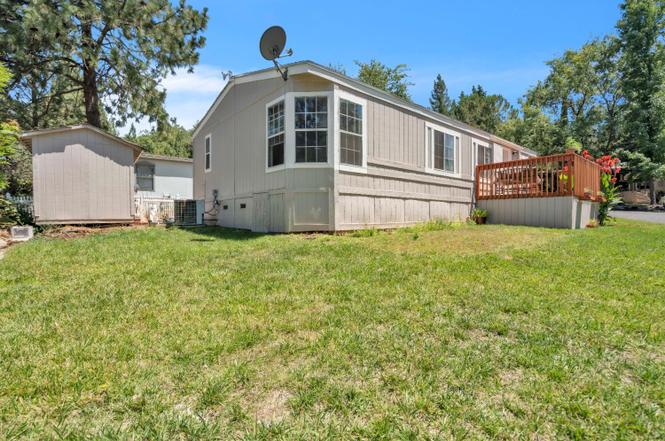
Listing remarks
Welcome to Space 31 in the peaceful Crystal Cave Mobile Home Park. This 3-bedroom, 2-bath manufactured home offers 1,035 square feet of comfortable living in a serene, park-like setting. The home features a functional layout with ample natural light and room to make it your own. Enjoy the quiet surroundings, mature trees, and well-maintained grounds of one of the area's nicest parks. A great opportunity for affordable living in a tranquil environment.
Key facts
- Tranquil environment
- 5,000 sq ft lot
- Built 1990
Tags
Property features AI
Finance
- Other: Lot size approximately 0.11 acre; Lot size approximately 5,000 sq ft; Located at 8074 Perry Creek Rd #31, Somerset, CA 95684; Corner location; directions: Omo Ranch to Fairplay Rd to Whistler
- Financial info: Land lease: No (land lease amount listed separately)
- HOA & community: No homeowners association; Not a senior community
Exterior
- Parking: No garage
- Utilities: Private water; Private sewer
- Home design: Manufactured home in park; Double-wide; Made by Sunpointe; Built in 1990; Wood skirting
- Construction: Other roof
- Exterior features: Corner lot
Interior
- Kitchen: Breakfast area (kitchen feature)
- Bedrooms: 3 bedrooms
- Flooring: Carpet; Laminate; Linoleum
- Bathrooms: 2 full bathrooms; Tub and tub with shower over
- Heating & cooling: Central heating; Central air conditioning
- Interior features: Cathedral/vaulted living room ceiling; Breakfast area; Breakfast nook
- Laundry & utility: Laundry inside with 220-volt outlet
Neighborhood map
What this means for you Summary
Snapshot
- This is a 3-bed/2.0-bath manufactured listed at $86k.
Deal economics
- At list price, monthly cash flow is $1k ($15k/yr) — positive.
- The deal already cash-flows at list — no discount required.
- Meets the 1% rule at list price ($2k rent vs $86k).
- Recommended offer: $75k (12.0% below list) — sets the bar for market timing.
- Cap rate 23.7% vs local median 3.7% in Grizzly Flats — top-decile yield for the area; either an underpriced asset or a hidden risk that comps aren't pricing in. Stress-test before assuming the spread holds.
Location & tenants
- Location reads 54/100 on livability (#914 in CA) — a working-class tenant base; expect higher turnover. Strengths: housing A+, crime B+; Watch: employment D, schools F, amenities F.
- Pioneer Union Elementary (rural): math 30% / reading 55% proficiency, ranked #638 of 1,400 in CA (top 46%) — families likely to look elsewhere, expect single-tenant / working-renter base with shorter leases.
- Market conditions: 88 active listings in the ZIP; 437 units permitted in El Dorado County in 2024 (0 in 5+ unit buildings).
Forward outlook
- Local home prices are declining (-3.0%/yr); year-one equity from $591 of loan paydown is wiped out by about $3k of value loss. Plan a longer hold.
- El Dorado County population projected to shrink 3% by 2050 — rents likely to lag national; underwrite the cash flow, not the appreciation.
- At projected returns (-3.0% appreciation + 3.0% rent growth), your $24k cash investment doubles in ~2 years — after that, you're playing with house money.
Negotiation context
- It's been on market 286 days — a 12% lower offer ($75k) is reasonable based on typical stale-listing flexibility.
Risks & watch-outs
- Climate carrying-cost: severe wildfire risk; extreme-heat days projected 7→16/yr by 2055 (HVAC capex compounding) — expect insurance premiums to compound above CPI over the hold.
Questions for the listing agent
- It's been on market 286 days. Have you received any prior offers? Is the seller open to a 12% concession, seller financing, or rate buy-down credit?
- Why hasn't it sold? Are there any deal-killer items the seller is aware of (foundation, flood, title, zoning, code violations)?
- Is there a deadline driving the sale (1031 exchange, divorce, estate, relocation)? That informs how much negotiation room exists.
- Schools are F-rated, which usually means shorter tenancies and higher turnover. Who's the typical renter profile here, and what's been the actual vacancy rate?
- What's the average days-on-market for RENTAL listings here right now (not sales)? A rising rental-DOM trend means longer vacancies and softer asking-rent achievability than the comps imply.
- What's the recent tenant-quality profile in this submarket — average credit score on applications, eviction rate, late-payment / NSF rate, and stable-employment percentage? A property-management company in the area should have these aggregated.
- How much new for-sale + rental construction is in the pipeline within 1–3 miles? Heavy new supply typically softens prices + rents 12–24 months out; constrained supply supports both.
Investment metrics
- 1% rule
- 2.71% ✓
- Cap rate
- 23.71%
- Cash-on-cash
- 62.22%
- DSCR
- 3.77
- GRM
- 3.1
CMA / ARV
No comps found within radius.
Projected returns pro-forma
-3.0% appreciation · 3.0% rent growth · sell at horizon
- IRR
- 61.2%
- Equity multiple
- 3.73×
- Total profit
- $65,239
- Equity at exit
- $12,748
- IRR
- 65.8%
- Equity multiple
- 7.63×
- Total profit
- $158,752
- Equity at exit
- $7,392
Cash invested: $23,940 (down + closing). Projections, not guarantees.
Landlord ↔ Tenant lean methodology
- Overall (STATE)
- 18 Strongly Tenant-Friendly
- State California
- 18 Strongly Tenant-Friendly · D+13
- County
- — inherits STATE
- City
- — inherits STATE
ZIP-level market 95684
- Home prices YoY
- -5.0%
- Active inventory
- 88
- Price-to-rent
- 3.1×
Monthly cashflow live
- Estimated rent
- $2,319 medium interval (Pro) →
- Mortgage (P&I)
- −$448
- Tax est. 1.5%
- −$107 /mo · $1,282/yr
- Insurance
- −$36
- HOA
- −$0
- Vacancy / Maint / Mgmt
- −$487
- Net cashflow
- $1,241
Break-even live
UW: 25.0% down · 7.5% · 30yr · 1.5% tax · 5.0% vac · 8.0% maint · 8.0% mgmt
Financing live
Cash to close
- Down payment
- $21,375
- Closing costs
- $2,565
- Reserves months
- —
- Total cash needed
- —
Loan-product check · same deal, 3 products live
Conventional
25% down · 7.5% · 30yr
- Down + closing
- —
- Monthly P&I
- —
- Monthly cashflow
- —
- DSCR
- —
- Eligible?
- —
Personal DTI + credit; lowest rate.
DSCR
20% down · 8.5% · 30yr
- Down + closing
- —
- Monthly P&I
- —
- Monthly cashflow
- —
- DSCR
- —
- Eligible?
- —
No personal income docs; deal must DSCR.
Hard money
10% down · 12.0% · 12mo
- Down + closing
- —
- Monthly P&I
- —
- Monthly cashflow
- —
- DSCR
- —
- Eligible?
- —
Short-term bridge; refi at stabilization.
Listing history 13 events
-
2026-06-15status $85,500 Pending 286 DOM
-
2026-06-15days on market $85,500 Active 286 DOM
-
2026-06-13days on market $85,500 Active 284 DOM
-
2026-06-13days on market $85,500 Active 283 DOM
-
2026-06-10days on market $85,500 Active 281 DOM
-
2026-06-09days on market $85,500 Active 280 DOM
-
2026-06-08days on market $85,500 Active 279 DOM
-
2026-06-07days on market $85,500 Active 278 DOM
-
2026-06-05days on market $85,500 Active 275 DOM
-
2026-06-03days on market $85,500 Active 274 DOM
-
2026-06-02days on market $85,500 Active 273 DOM
-
2026-06-01days on market $85,500 Active 272 DOM
-
2026-05-31days on market $85,500 Active 271 DOM
ⓘ Source: listings_history table (triggers on properties + properties_extension) + one-shot
backfill from property_details.listing_events for pre-trigger history.
Climate risk First Street
- Flood 1/10 Low FEMA zone X (unshaded) · 0% chance over 30 yrs
- Wildfire 8/10 Severe
- Heat 6/10 Major 7 d/yr ≥98°F today · 16 d/yr by 30 yrs out
- Wind 1/10 Low
- Air quality 10/10 Extreme 27 unhealthy d/yr today · 31 by 30 yrs out
Nearby sold comps map
Loading sold comps map…
Walkable amenities ~0.75 mi
Loading nearby amenities…
Taxation est. · year 1
- Rental income
- $27,830
- − Mortgage interest
- −$4,789
- − Property taxes
- −$1,282
- − Insurance
- −$428
- − Repairs & maintenance
- −$2,226
- − Management
- −$2,226
- − Depreciation
- −$2,487
- Taxable income
- $14,391
- Est. tax owed @ 24.0%
- −$3,454
- After-tax cash flow
- $11,442/yr
For passive investors: Depreciation is non-cash, so a rental often shows a tax loss while cash-flowing — sheltering income. Rental losses are passive: they offset passive income freely, and up to $25,000/yr can offset ordinary (W-2) income if you actively participate and your MAGI is under $100k (phasing out to $0 by $150k); unused losses carry forward. On sale, claimed depreciation is recaptured at up to 25%, and gains may owe capital-gains tax (a 1031 exchange can defer both). Figures are a year-1 estimate at your 24.0% rate — not tax advice; consult a CPA.
Schools (NCES district)
- District
- Pioneer Union Elementary
- NCES district ID
- 0630480
- Math proficiency
- 30% ▬ 0.00%
- Reading proficiency
- 55% ▲ 10.00%
- Median HH income
- $52,807
- Composite
- 39.11/100
- National rank
- #8246
- State rank
- #638 of 1400 in CA
Livability — Grizzly Flats
- Score
- 54/100
- State rank
- #914
- US rank
- #24125
Category grades
Schools grade is shown separately in the Schools card above.
Census & demographics
- Population (ZIP)
- 2,637
Population outlook (El Dorado County) Hauer SSP2
- Today (2025)
- 191,666 people
- By 2030
- 193,662 · +1.0%
- By 2040
- 192,583 · +0.5%
- By 2050
- 185,904 · -3.0%
- By 2075
- 169,543 · -11.5%
- By 2100
- 139,623 · -27.2%
Race, ethnicity, and origin ACS 2023
- Neighborhood character
- Predominantly White (75%)
- Race & ethnicity
- White 75% Hispanic / Latino 16% Two or more races 11% Asian 2%
- Hispanic origin (detail)
- Mexican 14%
- Common ancestry
- Russian 7% Romanian 2% Portuguese 2%
- Foreign-born
- 3% · Canada, China
- Languages at home
- 92% English-only · Spanish 6% Chinese 1% French/Haitian/Cajun 1%
Political lean MEDSL · El Dorado
- 2024 margin
- R (+12.0) · D 42.6% · R 54.6% · Other 2.8%
- 2008→2024 swing
- -1.5pp toward R · 2008: -10.5pp · 2024: -12.0pp
- All cycles
- 2024: R+12.0 2020: R+8.8 2016: R+13.9 2012: R+18.2 2008: R+10.5
Not yet ingested
- Civics
- —
Market trends
- HPI YoY
- ▼ -12.72%
- Current HPI
- 240.1455
- Rent YoY
- —
- Metro
- —
- State GDP YoY
- ▲ 3.21%
- F500 in state
- 116
Industry mix (Fortune 500 HQ in CA)
| Industry | F500 HQs | Revenue |
|---|---|---|
| Technology | 27 | $1,492B |
|
||
| Financial Services | 3 | $174B |
|
||
| Retail | 3 | $44B |
|
||
| Insurance | 3 | $26B |
|
||
| Media / Entertainment | 2 | $115B |
|
||
| Pharmaceuticals / Biotech | 2 | $62B |
|
||
Property tax history
-0.0%/yrLatest (2023): $36 · -0.4% YoY. Source: county tax records.
Cash-flow waterfall
monthlySold comps — $/sqft
last 12 mo · ≤1 miLoading sold comps…