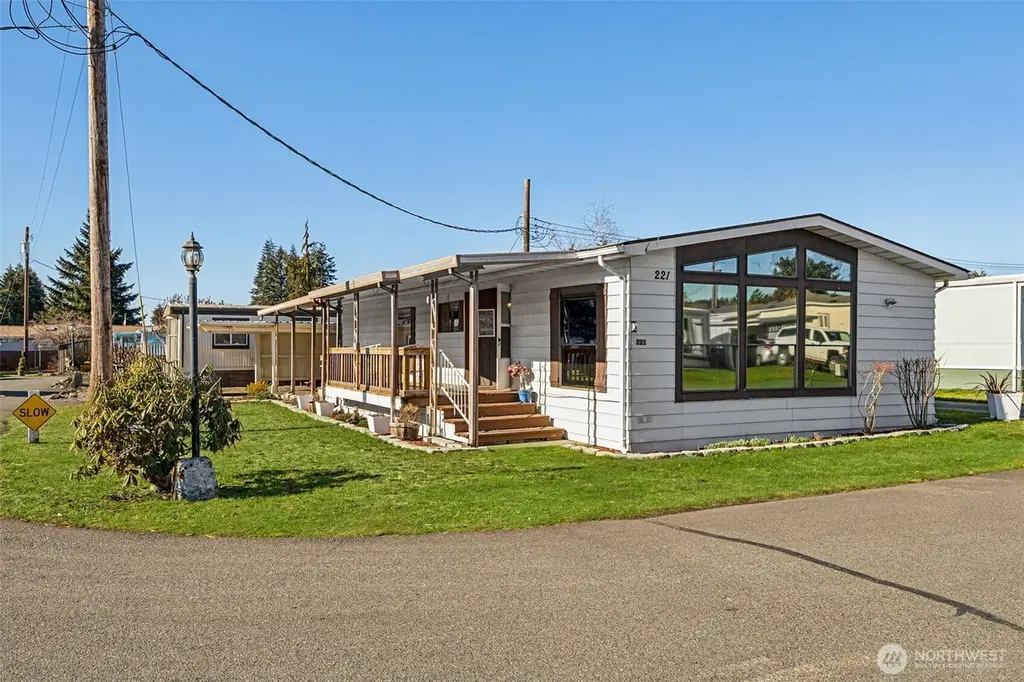
1313 Harrison Ave #221 · Centralia, WA
Flood risk 4/10 · Minor
- FEMA flood zone
- X
- Chance of flooding over 30 yrs
- 0.21%
- Est. flood insurance / yr
- $507 – $1,088
Fire risk 3/10 · Minor
- Est. fire insurance / yr
- $604 – $1,122
Heat risk 3/10 · Minor
- Hot days now (above 90°F)
- 7 days/yr
- Hot days in 30 yrs
- 15 days/yr
Wind risk 1/10 · Minimal
- Chance of severe wind over 30 yrs
- —
Air-quality risk 6/10 · Moderate
- Unhealthy air days now
- 8 days/yr
- Unhealthy air days in 30 yrs
- 8 days/yr
Risk factors via First Street. Map © Google.
Why this score? — see what drove the B grade
The composite is a weighted blend of 9 inputs, each scored 0–100. Each bar is that input's sub-score; the figure is the points it added to the 100-point composite (weight × sub-score).
- Cash flow +30.0/30.0
- 1% rule +10.0/10.0
- DSCR +10.0/10.0
- ARV discount +7.5/15.0
- Schools +4.0/10.0
- Livability +4.0/5.0
- Rent growth +3.2/5.0
- Condition / age +2.5/5.0
- Appreciation +0.0/10.0
$69,900
🖨 Deal sheet 📄 Offer letter ✓ Due diligence
Listing remarks
Welcome to this inviting manufactured home on a large corner lot in Village Park, a 55+ community. With 1,344 sq. ft. of living space, this home offers plenty of room to relax and entertain. Featuring vaulted ceilings and large windows throughout, this home is filled with natural light. The heat pump ensures year-round comfort, recent updates include a newer roof & water heater providing peace of mind. Step outside onto the spacious deck, complete with a ramp and steps—perfect for relaxing, enjoying morning coffee, or hosting outdoor gatherings. Conveniently located only minutes from shopping, medical services, a dog park & much more! This home offers great potential for i
Key facts
- Large deck
- Minutes shopping
- Large corner lot
Tags
Neighborhood map
What this means for you Summary
Snapshot
- This is a 2-bed/2.0-bath other listed at $70k.
Deal economics
- At list price, monthly cash flow is $877 ($11k/yr) — positive.
- The deal already cash-flows at list — no discount required.
- Meets the 1% rule at list price ($2k rent vs $70k).
- Recommended offer: $62k (12.0% below list) — sets the bar for market timing.
- Cap rate 21.3% vs local median 3.0% in Centralia — top-decile yield for the area; either an underpriced asset or a hidden risk that comps aren't pricing in. Stress-test before assuming the spread holds.
Location & tenants
- Location reads 81/100 on livability (#81 in WA, #1,497 nationally) — a professional / high-income tenant draw. Strengths: commute A+, health & safety A+, cost of living A; Watch: schools C-, crime C-, employment F.
- Centralia School District (town): math 39% / reading 52% proficiency, ranked #187 of 291 in WA (top 64%) — families likely to look elsewhere, expect single-tenant / working-renter base with shorter leases; 65% free/reduced lunch — lower-income household profile, screen leases tightly.
- Market conditions: Rents rising (+3.0%/yr); 258 active listings in the ZIP; 8 comparable units currently listed for rent nearby; rentals lingering (median 44d on market — plan ~5-8 weeks vacancy on turnover, expect pricing pressure); 75% of comp listings sitting > 30 days — soft ceiling on asking rent; 265 units permitted in Lewis County in 2024 (44 in 5+ unit buildings).
- This rent runs 32% of the median local income ($63k/yr) — at the standard rent-burdened threshold; future hikes will face affordability resistance.
Forward outlook
- Local home prices are declining (-3.0%/yr); year-one equity from $483 of loan paydown is wiped out by about $2k of value loss. Plan a longer hold.
- Lewis County population projected at -11% by 2050 — secular population decline; favor cash flow + early exit over multi-decade hold.
- At projected returns (-3.0% appreciation + 3.0% rent growth), your $20k cash investment doubles in ~3 years — after that, you're playing with house money.
Negotiation context
- It's been on market 480 days — a 12% lower offer ($62k) is reasonable based on typical stale-listing flexibility.
- 5 sale attempts since 8y ago; this cycle's ask has dropped $40k (36%) from the opening price — seller is motivated, your offer sets the floor, not the list.
Questions for the listing agent
- It's been on market 480 days. Have you received any prior offers? Is the seller open to a 12% concession, seller financing, or rate buy-down credit?
- Why hasn't it sold? Are there any deal-killer items the seller is aware of (foundation, flood, title, zoning, code violations)?
- Is there a deadline driving the sale (1031 exchange, divorce, estate, relocation)? That informs how much negotiation room exists.
- What's the average days-on-market for RENTAL listings here right now (not sales)? A rising rental-DOM trend means longer vacancies and softer asking-rent achievability than the comps imply.
- What's the recent tenant-quality profile in this submarket — average credit score on applications, eviction rate, late-payment / NSF rate, and stable-employment percentage? A property-management company in the area should have these aggregated.
- How much new for-sale + rental construction is in the pipeline within 1–3 miles? Heavy new supply typically softens prices + rents 12–24 months out; constrained supply supports both.
Investment metrics
- 1% rule
- 2.45% ✓
- Cap rate
- 21.34%
- Cash-on-cash
- 53.75%
- DSCR
- 3.39
- GRM
- 3.4
CMA / ARV
- ARV (median comp)
- $143,385
- List price
- $69,900
- Delta
- -51.25%
- Verdict
- UNDERPRICED
- Comps
- 6 within 1.0 mi
Projected returns pro-forma
-3.0% appreciation · 3.0% rent growth · sell at horizon
- IRR
- 51.9%
- Equity multiple
- 3.28×
- Total profit
- $44,528
- Equity at exit
- $10,422
- IRR
- 57.2%
- Equity multiple
- 6.66×
- Total profit
- $110,753
- Equity at exit
- $6,044
Cash invested: $19,572 (down + closing). Projections, not guarantees.
Landlord ↔ Tenant lean methodology
- Overall (STATE)
- 28 Tenant-Leaning
- State Washington
- 28 Tenant-Leaning · D+8
- County
- — inherits STATE
- City
- — inherits STATE
ZIP-level market 98531
- Rents YoY
- 3.0%
- Active inventory
- 258
- Price-to-rent
- 3.4×
Monthly cashflow live
- Estimated rent
- $1,710 high interval (Pro) →
- Mortgage (P&I)
- −$367
- Tax from tax record
- −$78 /mo · $939/yr
- Insurance
- −$29
- HOA
- −$0
- Vacancy / Maint / Mgmt
- −$359
- Net cashflow
- $877
Break-even live
UW: 25.0% down · 7.5% · 30yr · 1.5% tax · 5.0% vac · 8.0% maint · 8.0% mgmt
Financing live
Cash to close
- Down payment
- $17,475
- Closing costs
- $2,097
- Reserves months
- —
- Total cash needed
- —
Loan-product check · same deal, 3 products live
Conventional
25% down · 7.5% · 30yr
- Down + closing
- —
- Monthly P&I
- —
- Monthly cashflow
- —
- DSCR
- —
- Eligible?
- —
Personal DTI + credit; lowest rate.
DSCR
20% down · 8.5% · 30yr
- Down + closing
- —
- Monthly P&I
- —
- Monthly cashflow
- —
- DSCR
- —
- Eligible?
- —
No personal income docs; deal must DSCR.
Hard money
10% down · 12.0% · 12mo
- Down + closing
- —
- Monthly P&I
- —
- Monthly cashflow
- —
- DSCR
- —
- Eligible?
- —
Short-term bridge; refi at stabilization.
Rent comps 8 comps
| Address | Beds | Baths | Sqft | Rent | $/sqft | DOM | Units | Dist |
|---|---|---|---|---|---|---|---|---|
| 1413 Nora Ln Centralia, WA | 2.0 | 3.0 | 1315 | $1,850 | $1.41 | 43d | 1 | 0.18mi |
| 1413 Nora Ln Unit B Centralia, WA | 2.0 | 2.5 | 1315 | $1,850 | $1.41 | 43d | 1 | 0.18mi |
| 1014 N Scheuber Rd Centralia, WA | 2.0 | 1.0 | 890 | $1,395 | $1.57 | 13d | 1 | 0.34mi |
| 2711 Niki Ln Bldg D8 Centralia, WA | 3.0 | 2.5 | 1312 | $2,100 | $1.60 | 43d | 1 | 0.34mi |
| 2711 Niki LN Centralia, WA | 3.0 | 2.0 | 1250 | $2,100 | $1.68 | 43d | 1 | 0.39mi |
| 1405 Lewis St Centralia, WA | 2.0 | 1.5 | 1150 | $1,650 | $1.43 | 13d | 1 | 1.15mi |
| 701 H St Apt R Centralia, WA | 2.0 | 1.5 | 1180 | $1,500 | $1.27 | 43d | 1 | 1.42mi |
| 701 H St Apt E Centralia, WA | 2.0 | 1.0 | 1137 | $1,500 | $1.32 | 43d | 1 | 1.42mi |
Listing history 31 events
-
2026-06-19days on market $69,900 Active 480 DOM
-
2026-06-18days on market $69,900 Active 479 DOM
-
2026-06-17days on market $69,900 Active 478 DOM
-
2026-06-16days on market $69,900 Active 477 DOM
-
2026-06-15days on market $69,900 Active 476 DOM
-
2026-06-14days on market $69,900 Active 474 DOM
-
2026-06-12days on market $69,900 Active 473 DOM
-
2026-06-09days on market $69,900 Active 470 DOM
-
2026-06-08days on market $69,900 Active 469 DOM
-
2026-06-07days on market $69,900 Active 468 DOM
-
2026-06-07days on market $69,900 Active 467 DOM
-
2026-06-03days on market $69,900 Active 464 DOM
-
2026-06-02days on market $69,900 Active 463 DOM
-
2026-06-01days on market $69,900 Active 462 DOM
-
2026-05-31days on market $69,900 Active 461 DOM
-
2026-05-30days on market $69,900 Active 460 DOM
-
2026-05-11status Active
-
2026-05-08historical
-
2026-03-23price $69,900
-
2025-09-24price $79,999
-
2025-06-27status Active
-
2025-06-18status Pending
-
2025-04-21price $85,000
-
2025-04-03price $94,000
-
2025-02-28price $99,000
-
2025-02-12$110,000 Active
-
2018-08-29soldstatus $65,200 Sold
-
2018-08-22status Pending
-
2018-08-15status Active
-
2018-08-10status Pending
-
2018-07-23$64,950 Active
ⓘ Source: listings_history table (triggers on properties + properties_extension) + one-shot
backfill from property_details.listing_events for pre-trigger history.
Tax reassessment forecast WA · Resets to sale price
- Current annual tax
- $939 · $78/mo
- Projected year-2 tax
- $939 · $78/mo
- Expected delta
- $0/yr ($0/mo · 0.0%)
ⓘ Screening estimate from a state-policy table — verify with the county assessor before closing.
Climate risk First Street
- Flood 4/10 Moderate FEMA zone X · 21% chance over 30 yrs
- Wildfire 3/10 Moderate
- Heat 3/10 Moderate 7 d/yr ≥90°F today · 15 d/yr by 30 yrs out
- Wind 1/10 Low
- Air quality 6/10 Major 8 unhealthy d/yr today · 8 by 30 yrs out
Nearby sold comps map
Loading sold comps map…
Walkable amenities ~0.75 mi
Loading nearby amenities…
Taxation est. · year 1
- Rental income
- $20,515
- − Mortgage interest
- −$3,915
- − Property taxes
- −$939
- − Insurance
- −$350
- − Repairs & maintenance
- −$1,641
- − Management
- −$1,641
- − Depreciation
- −$2,033
- Taxable income
- $9,995
- Est. tax owed @ 24.0%
- −$2,399
- After-tax cash flow
- $8,121/yr
For passive investors: Depreciation is non-cash, so a rental often shows a tax loss while cash-flowing — sheltering income. Rental losses are passive: they offset passive income freely, and up to $25,000/yr can offset ordinary (W-2) income if you actively participate and your MAGI is under $100k (phasing out to $0 by $150k); unused losses carry forward. On sale, claimed depreciation is recaptured at up to 25%, and gains may owe capital-gains tax (a 1031 exchange can defer both). Figures are a year-1 estimate at your 24.0% rate — not tax advice; consult a CPA.
Schools (NCES district)
- District
- Centralia School District
- NCES district ID
- 5301140
- Math proficiency
- 39% ▼ -2.00%
- Reading proficiency
- 52% ▼ -2.00%
- Median HH income
- $38,851
- Composite
- 40.17/100
- National rank
- #7832
- State rank
- #187 of 291 in WA
Livability — Centralia
- Score
- 81/100
- State rank
- #81
- US rank
- #1497
Category grades
Schools grade is shown separately in the Schools card above.
Census & demographics
- Census place
- Centralia, WA
- County
- Lewis County · 27,337 people
- City population
- 27,337
- Metro
- Centralia, WA
- Population (ZIP)
- 27,337
- Household income
- $63,406
- Rent vs Own
- Severe rent burden
- 1000.0
Population outlook (Lewis County) Hauer SSP2
- Today (2025)
- 75,749 people
- By 2030
- 74,647 · -1.5%
- By 2040
- 71,310 · -5.9%
- By 2050
- 67,748 · -10.6%
- By 2075
- 59,829 · -21.0%
- By 2100
- 52,293 · -31.0%
Race, ethnicity, and origin ACS 2023
- Neighborhood character
- Predominantly White (74%)
- Race & ethnicity
- White 74% Hispanic / Latino 19% Two or more races 10% Asian 1%
- Hispanic origin (detail)
- Mexican 15% Puerto Rican 1%
- Common ancestry
- Portuguese 3% Slovak 3% Lithuanian 2%
- Foreign-born
- 9% · Canada, Vietnam
- Languages at home
- 83% English-only · Spanish 16% Tagalog/Filipino 1%
Political lean MEDSL · Lewis
- 2024 margin
- Solid R (+33.0) · D 32.0% · R 65.0% · Other 3.0%
- 2008→2024 swing
- -13.8pp toward R · 2008: -19.2pp · 2024: -33.0pp
- All cycles
- 2024: R+33.0 2020: R+32.8 2016: R+36.2 2012: R+23.5 2008: R+19.2
Not yet ingested
- Civics
- —
Market trends
- HPI YoY
- ▼ -249.98%
- Current HPI
- 378.6936
- Rent YoY
- ▲ 3.00%
- Metro
- Centralia, WA
- State GDP YoY
- ▲ 4.65%
- F500 in state
- 22
Industry mix (Fortune 500 HQ in WA)
| Industry | F500 HQs | Revenue |
|---|---|---|
| Retail | 2 | $269B |
|
||
| Technology / Retail | 1 | $638B |
|
||
| Technology | 1 | $245B |
|
||
| Telecommunications | 1 | $38B |
|
||
| Food / Beverage | 1 | $36B |
|
||
| Automotive / Trucks | 1 | $34B |
|
||
Price history
+7.6% since first listed15 events — show timeline
- 2026-05-11 Relisted — NWMLS as Distributed by MLS Grid
- 2026-05-08 Delisted — NWMLS as Distributed by MLS Grid
- 2026-03-23 Price Changed $69,900 NWMLS as Distributed by MLS Grid
- 2025-09-24 Price Changed $79,999 NWMLS as Distributed by MLS Grid
- 2025-06-27 Relisted — NWMLS as Distributed by MLS Grid
- 2025-06-18 Pending — NWMLS as Distributed by MLS Grid
- 2025-04-21 Price Changed $85,000 NWMLS as Distributed by MLS Grid
- 2025-04-03 Price Changed $94,000 NWMLS as Distributed by MLS Grid
- 2025-02-28 Price Changed $99,000 NWMLS as Distributed by MLS Grid
- 2025-02-12 Listed $110,000 NWMLS as Distributed by MLS Grid
- 2018-08-29 Sold (MLS) $65,200 NWMLS as Distributed by MLS Grid
- 2018-08-22 Pending — NWMLS as Distributed by MLS Grid
- 2018-08-15 Relisted — NWMLS as Distributed by MLS Grid
- 2018-08-10 Pending — NWMLS as Distributed by MLS Grid
- 2018-07-23 Listed $64,950 NWMLS as Distributed by MLS Grid
Property tax history
+7.5%/yrLatest (2026): $939 · +8.7% YoY. Source: county tax records.
Cash-flow waterfall
monthlySold comps — $/sqft
last 12 mo · ≤1 miLoading sold comps…