138 Park Pl · Putney, GA
Flood risk 1/10 · Minimal
- FEMA flood zone
- X (unshaded)
- Chance of flooding over 30 yrs
- 0.0%
- Est. flood insurance / yr
- $473 – $860
Fire risk 7/10 · Major
- Est. fire insurance / yr
- $963 – $1,789
Heat risk 7/10 · Major
- Hot days now (above 108°F)
- 7 days/yr
- Hot days in 30 yrs
- 20 days/yr
Wind risk 8/10 · Major
- Chance of severe wind over 30 yrs
- 97.0%
Air-quality risk 4/10 · Minor
- Unhealthy air days now
- 6 days/yr
- Unhealthy air days in 30 yrs
- 6 days/yr
Risk factors via First Street. Map © Google.
Why this score? — see what drove the D+ grade
The composite is a weighted blend of 9 inputs, each scored 0–100. Each bar is that input's sub-score; the figure is the points it added to the 100-point composite (weight × sub-score).
- Cash flow +15.6/30.0
- ARV discount +7.5/15.0
- DSCR +4.8/10.0
- Rent growth +4.5/5.0
- 1% rule +4.3/10.0
- Livability +3.2/5.0
- Schools +2.6/10.0
- Condition / age +2.5/5.0
- Appreciation +0.0/10.0
$139,900
🖨 Deal sheet (PDF) 📄 Offer letter ✓ Due diligence
Listing remarks
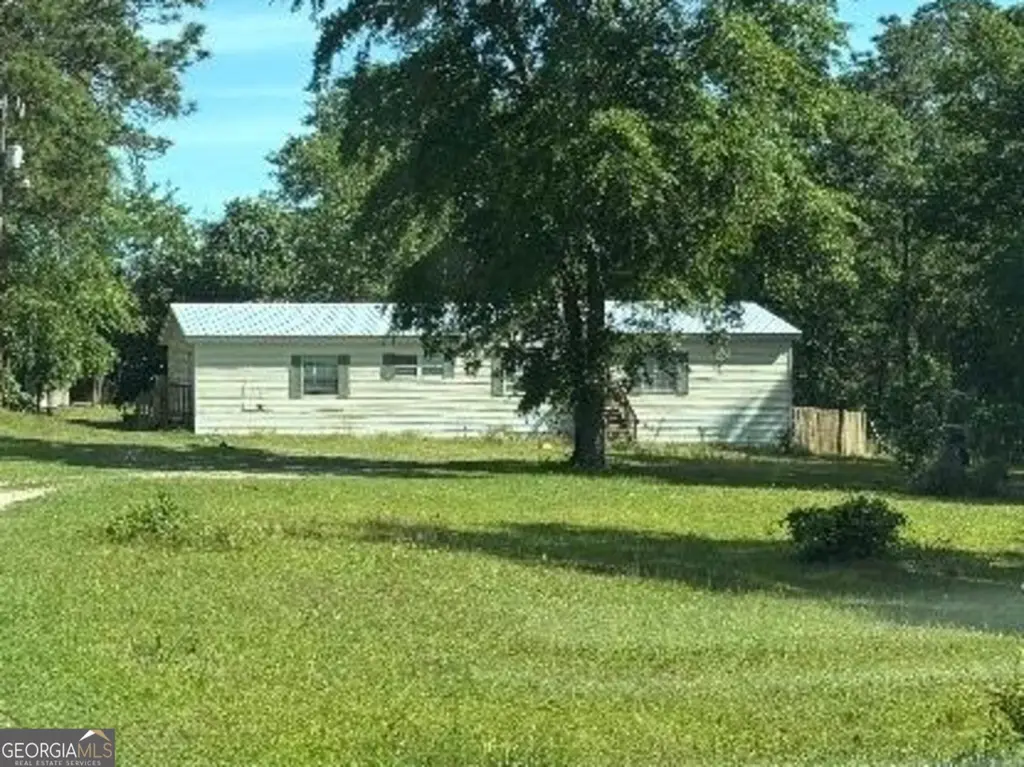
Nestled in the charming city of Albany, Georgia, this 3-bedroom, 2-bathroom mobile home offers a wealth of potential for those looking to create their dream living space. Situated on a sprawling one-acre lot, this property provides ample space for outdoor activities, gardening, or future expansions. The home boasts high ceilings, creating an open and airy atmosphere that enhances the sense of space within. Whether you're a first-time homebuyer or looking to invest in a property with promising possibilities, this mobile home is a canvas awaiting your personal touch. Its location in Albany ensures a blend of tranquil living with easy access to local amenities, making it a perfect spot for fam
Key facts
- One acre lot
- High ceilings
- 1 acre lot
Tags
Property features AI
Finance
- HOA & community: No HOA
Exterior
- Parking: Off-street parking
- Utilities: Well water; Septic tank; Electricity available; Water available; Sewer available
- Home design: Manufactured home (single-family manufactured house); Resale property
- Construction: Built in 1999; Vinyl siding construction; Metal roof
- Exterior features: Metal roof; Vinyl siding; Lot is 1 acre
Interior
- Kitchen: Refrigerator included
- Bedrooms: 3 bedrooms (all on the main level)
- Flooring: Vinyl flooring
- Bathrooms: 2 full bathrooms (main level)
- Heating & cooling: No heating system listed; No cooling system listed
- Interior features: High ceilings; One level living
- Laundry & utility: Laundry closet
Neighborhood map
What this means for you Summary
Snapshot
- This is a 3-bed/2.0-bath land listed at $140k.
Deal economics
- At list price, monthly cash flow is $59 ($705/yr) — positive.
- The deal already cash-flows at list — no discount required.
- To meet the 1% rule (rent ≥ 1% of price), the offer needs to be $130k (7.2% below list).
- Recommended offer: $130k (7.2% below list) — sets the bar for 1% rule.
Location & tenants
- Location reads 65/100 on livability (#234 in GA) — a middle-class / working-renter tenant base. Strengths: crime A+, cost of living A+, housing A+; Watch: employment D+, schools F, amenities F.
- Worth County (town): math 28% / reading 34% proficiency, ranked #91 of 174 in GA (top 52%) — families likely to look elsewhere, expect single-tenant / working-renter base with shorter leases; 66% free/reduced lunch — lower-income household profile, screen leases tightly.
- Market conditions: Rents rising fast (+8.1%/yr); 128 active listings in the ZIP; lower-income renter base — watch delinquency; 26 units permitted in Worth County in 2024 (0 in 5+ unit buildings).
- This rent runs 36% of the median local income ($43k/yr) — at the standard rent-burdened threshold; future hikes will face affordability resistance.
Forward outlook
- Local home prices are declining (-3.0%/yr); year-one equity from $967 of loan paydown is wiped out by about $4k of value loss. Plan a longer hold.
- Worth County population projected at -31% by 2050 — secular population decline; favor cash flow + early exit over multi-decade hold.
Negotiation context
- It's been on market 38 days — a 3% lower offer ($136k) is reasonable based on typical stale-listing flexibility.
- Current owner paid $55k; list at $140k implies a 154% gain — meaningful room to come down on a strong offer.
Risks & watch-outs
- Climate carrying-cost: severe wind risk, 97% chance of damaging wind over 30y; major wildfire risk; extreme-heat days projected 7→20/yr by 2055 (HVAC capex compounding) — expect insurance premiums to compound above CPI over the hold.
Questions for the listing agent
- It's been on market 38 days. Have you received any prior offers? Is the seller open to a 7% concession, seller financing, or rate buy-down credit?
- Is there a deadline driving the sale (1031 exchange, divorce, estate, relocation)? That informs how much negotiation room exists.
- Schools are F-rated, which usually means shorter tenancies and higher turnover. Who's the typical renter profile here, and what's been the actual vacancy rate?
- The area grade is low — what's the realistic commute time and amenity access for the typical tenant pool here? Any planned neighborhood developments (good or bad) we should know about?
- What's the average days-on-market for RENTAL listings here right now (not sales)? A rising rental-DOM trend means longer vacancies and softer asking-rent achievability than the comps imply.
- What's the recent tenant-quality profile in this submarket — average credit score on applications, eviction rate, late-payment / NSF rate, and stable-employment percentage? A property-management company in the area should have these aggregated.
- How much new for-sale + rental construction is in the pipeline within 1–3 miles? Heavy new supply typically softens prices + rents 12–24 months out; constrained supply supports both.
Investment metrics
- 1% rule
- 0.93% ✗
- Cap rate
- 6.80%
- Cash-on-cash
- 1.80%
- DSCR
- 1.08
- GRM
- 9.0
CMA / ARV
- ARV (median comp)
- $81,799
- List price
- $139,900
- Delta
- 71.03%
- Verdict
- OVERPRICED
- Comps
- 2 within 1.0 mi
Projected returns pro-forma
-3.0% appreciation · 8.0% rent growth · sell at horizon
- IRR
- -8.0%
- Equity multiple
- 0.69×
- Total profit
- $-12,046
- Equity at exit
- $20,860
- IRR
- 7.1%
- Equity multiple
- 1.65×
- Total profit
- $25,637
- Equity at exit
- $12,096
Cash invested: $39,172 (down + closing). Projections, not guarantees.
Landlord ↔ Tenant lean methodology
- Overall (STATE)
- 90 Strongly Landlord-Friendly
- State Georgia
- 90 Strongly Landlord-Friendly · R+3
- County
- — inherits STATE
- City
- — inherits STATE
ZIP-level market 31705
- Home prices YoY
- -20.1%
- Rents YoY
- 8.1%
- Active inventory
- 128
- Price-to-rent
- 9.0×
Monthly cashflow live
- Estimated rent
- $1,298 medium interval (Pro) →
- Mortgage (P&I)
- −$734
- Tax est. 1.5%
- −$175 /mo · $2,098/yr
- Insurance
- −$58
- HOA
- −$0
- Vacancy / Maint / Mgmt
- −$273
- Net cashflow
- $59
Break-even live
Sensitivity live
| Price | -10% $155 | -5% $107 | +0% $59 | +5% $10 | +10% $-38 |
|---|---|---|---|---|---|
| Rent | -10% $-44 | -5% $7 | +0% $59 | +5% $110 | +10% $161 |
| Rate | -1.0pp $129 | -0.5pp $94 | base $59 | +0.5pp $23 | +1.0pp $-14 |
UW: 25.0% down · 7.5% · 30yr · 1.5% tax · 5.0% vac · 8.0% maint · 8.0% mgmt
Financing live
Cash to close
- Down payment
- $34,975
- Closing costs
- $4,197
- Reserves months
- —
- Total cash needed
- —
Loan-product check · same deal, 3 products live
Conventional
25% down · 7.5% · 30yr
- Down + closing
- —
- Monthly P&I
- —
- Monthly cashflow
- —
- DSCR
- —
- Eligible?
- —
Personal DTI + credit; lowest rate.
DSCR
20% down · 8.5% · 30yr
- Down + closing
- —
- Monthly P&I
- —
- Monthly cashflow
- —
- DSCR
- —
- Eligible?
- —
No personal income docs; deal must DSCR.
Hard money
10% down · 12.0% · 12mo
- Down + closing
- —
- Monthly P&I
- —
- Monthly cashflow
- —
- DSCR
- —
- Eligible?
- —
Short-term bridge; refi at stabilization.
Listing history 19 events
-
2026-06-19days on market $139,900 Active 38 DOM
-
2026-06-18days on market $139,900 Active 37 DOM
-
2026-06-17days on market $139,900 Active 36 DOM
-
2026-06-16days on market $139,900 Active 35 DOM
-
2026-06-15days on market $139,900 Active 34 DOM
-
2026-06-14days on market $139,900 Active 32 DOM
-
2026-06-13days on market $139,900 Active 31 DOM
-
2026-06-10days on market $139,900 Active 29 DOM
-
2026-06-09days on market $139,900 Active 28 DOM
-
2026-06-08days on market $139,900 Active 27 DOM
-
2026-06-07days on market $139,900 Active 26 DOM
-
2026-06-05days on market $139,900 Active 23 DOM
-
2026-06-03days on market $139,900 Active 22 DOM
-
2026-06-02days on market $139,900 Active 21 DOM
-
2026-06-01days on market $139,900 Active 20 DOM
-
2026-05-31days on market $139,900 Active 19 DOM
-
2026-05-30days on market $139,900 Active 18 DOM
-
2026-05-11$139,900 New 791-char remark
-
2024-09-25soldstatus $55,000
ⓘ Source: listings_history table (triggers on properties + properties_extension) + one-shot
backfill from property_details.listing_events for pre-trigger history.
Climate risk First Street
- Flood 1/10 Low FEMA zone X (unshaded) · 0% chance over 30 yrs
- Wildfire 7/10 Severe
- Heat 7/10 Severe 7 d/yr ≥108°F today · 20 d/yr by 30 yrs out
- Wind 8/10 Severe 97% chance of damaging wind over 30 yrs
- Air quality 4/10 Moderate 6 unhealthy d/yr today · 6 by 30 yrs out
Nearby sold comps map
Loading sold comps map…
Walkable amenities ~0.75 mi
Loading nearby amenities…
Taxation est. · year 1
- Rental income
- $15,579
- − Mortgage interest
- −$7,837
- − Property taxes
- −$2,098
- − Insurance
- −$700
- − Repairs & maintenance
- −$1,246
- − Management
- −$1,246
- − Depreciation
- −$4,070
- Taxable loss
- −$1,618
- Est. tax savings @ 24.0%
- +$388
- After-tax cash flow
- $1,094/yr
For passive investors: Depreciation is non-cash, so a rental often shows a tax loss while cash-flowing — sheltering income. Rental losses are passive: they offset passive income freely, and up to $25,000/yr can offset ordinary (W-2) income if you actively participate and your MAGI is under $100k (phasing out to $0 by $150k); unused losses carry forward. On sale, claimed depreciation is recaptured at up to 25%, and gains may owe capital-gains tax (a 1031 exchange can defer both). Figures are a year-1 estimate at your 24.0% rate — not tax advice; consult a CPA.
Schools (NCES district)
- District
- Worth County
- NCES district ID
- 1305850
- Math proficiency
- 28% ▼ -5.00%
- Reading proficiency
- 34% ▼ -3.00%
- Median HH income
- $39,056
- Composite
- 25.97/100
- National rank
- #7327
- State rank
- #91 of 174 in GA
Livability — Putney
- Score
- 65/100
- State rank
- #234
- US rank
- #13458
Category grades
Schools grade is shown separately in the Schools card above.
Census & demographics
- County
- Dougherty County · 89,040 people
- Metro
- Albany, GA
- Population (ZIP)
- 30,791
- Household income
- $42,972
- Rent vs Own
- Severe rent burden
- 1933.0
Population outlook (Worth County) Hauer SSP2
- Today (2025)
- 18,547 people
- By 2030
- 17,345 · -6.5%
- By 2040
- 14,978 · -19.2%
- By 2050
- 12,782 · -31.1%
- By 2075
- 8,832 · -52.4%
- By 2100
- 6,226 · -66.4%
Race, ethnicity, and origin ACS 2023
- Neighborhood character
- Predominantly Black (68%)
- Race & ethnicity
- Black 68% White 23% Hispanic / Latino 6% Two or more races 4%
- Hispanic origin (detail)
- Mexican 2% Puerto Rican 1%
- Common ancestry
- Lithuanian 1%
- Foreign-born
- 3% · Canada
- Languages at home
- 94% English-only · Spanish 5% Other Asian/Pacific 1%
Political lean MEDSL · Worth
- 2024 margin
- Solid R (+50.4) · D 24.7% · R 75.1%
- 2008→2024 swing
- -11.7pp toward R · 2008: -38.7pp · 2024: -50.4pp
- All cycles
- 2024: R+50.4 2020: R+47.8 2016: R+50.0 2012: R+40.2 2008: R+38.7
Not yet ingested
- Civics
- —
Market trends
- HPI YoY
- ▼ -38.46%
- Current HPI
- 152.4574
- Rent YoY
- ▲ 8.10%
- Metro
- Albany, GA
- State GDP YoY
- ▲ 2.66%
- F500 in state
- 28
Industry mix (Fortune 500 HQ in GA)
| Industry | F500 HQs | Revenue |
|---|---|---|
| Paper / Packaging | 2 | $29B |
|
||
| Retail | 1 | $160B |
|
||
| Transportation / Logistics | 1 | $91B |
|
||
| Airlines | 1 | $62B |
|
||
| Consumer Goods | 1 | $47B |
|
||
| Utilities | 1 | $25B |
|
||
Price history
+154.4% since first listed2 events — show timeline
- 2026-05-11 Listed $139,900 GAMLS
- 2024-09-25 Sold (Public Records) $55,000 Public Records
Property tax history
-3.9%/yrLatest (2025): $140 · -35.3% YoY. Source: county tax records.
Cash-flow waterfall
monthlySold comps — $/sqft
last 12 mo · ≤1 miLoading sold comps…