 Fourplex
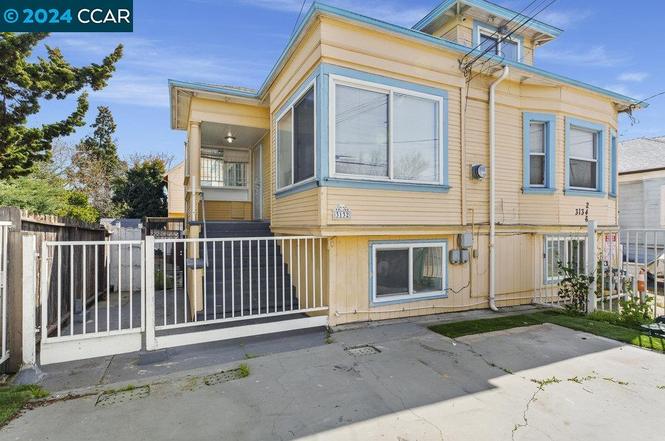
3134 Pleitner Ave · Oakland, CA
Flood risk 3/10 · Minor
- FEMA flood zone
- X (unshaded)
- Chance of flooding over 30 yrs
- 0.2%
- Est. flood insurance / yr
- $507 – $1,088
Fire risk 1/10 · Minimal
- Est. fire insurance / yr
- $659 – $1,223
Heat risk 3/10 · Minor
- Hot days now (above 84°F)
- 7 days/yr
- Hot days in 30 yrs
- 15 days/yr
Wind risk 1/10 · Minimal
- Chance of severe wind over 30 yrs
- —
Air-quality risk 8/10 · Major
- Unhealthy air days now
- 14 days/yr
- Unhealthy air days in 30 yrs
- 14 days/yr
Risk factors via First Street. Map © Google.
Why this score? — see what drove the D- grade
The composite is a weighted blend of 9 inputs, each scored 0–100. Each bar is that input's sub-score; the figure is the points it added to the 100-point composite (weight × sub-score).
- Cash flow +12.1/30.0
- ARV discount +7.5/15.0
- Rent growth +3.9/5.0
- DSCR +3.6/10.0
- Livability +3.6/5.0
- 1% rule +3.4/10.0
- Schools +3.0/10.0
- Condition / age +2.5/5.0
- Appreciation +0.0/10.0
$1,600,000
🖨 Deal sheet 📄 Offer letter ✓ Due diligence
Multi-family units
County records classify this as Multi-Family (2-4 Unit). Listing-text estimate: 4 units. confirmed
Listing remarks MLS
Three houses one lot. Live in Victorian style vacant front house, was built in 1904. Rent out two rear modern contemporary style twin townhouses built in 2009. Each townhouse has 4 bedrooms and 3.5 bath to generate 6K monthly mortgage help income. No rent control on newer construction townhouses. 4 electrical meters, 3 separate meters for gas, and a single water meter. Great potential for those with a vision to possibly convert to 4th unit. A lot of attic room for storage. List for $219 per square feet on 6,402 square feet living space. Too many details to list. Stop by and see it yourself.
Key facts
- 4,860 sq ft lot
- Garage
- Built 2009
Neighborhood map
What this means for you Summary
Snapshot
- This is a 4 × 3-bed/2.2-bath units multifamily listed at $1.60M.
Deal economics
- At list price, monthly cash flow is $-345 ($-4k/yr) — negative. Per door: $-86/mo.
- To cash-flow at today's rent, offer at most $1.54M (3.8% below list).
- To meet the 1% rule (rent ≥ 1% of price), the offer needs to be $1.35M (15.8% below list).
- Recommended offer: $1.35M (15.8% below list) — sets the bar for 1% rule.
- Cap rate 6.0% vs local median 2.4% in Oakland — top-decile yield for the area; either an underpriced asset or a hidden risk that comps aren't pricing in. Stress-test before assuming the spread holds.
Location & tenants
- Location reads 71/100 on livability (#224 in CA) — a middle-class / working-renter tenant base. Strengths: amenities A+, commute A+, employment A+; Watch: schools C-, crime F, cost of living F.
- Oakland Unified (urban): math 27% / reading 33% proficiency, ranked #1,007 of 1,400 in CA (top 72%) — families likely to look elsewhere, expect single-tenant / working-renter base with shorter leases; 68% free/reduced lunch — lower-income household profile, screen leases tightly.
- Market conditions: Rents rising fast (+5.5%/yr); 111 active listings in the ZIP; high-income renter base; 1,742 units permitted in Alameda County in 2024 (856 in 5+ unit buildings).
- At $13,475/mo this rent would consume 132% of the median local household income ($122k/yr) (locally 1018% of renters already pay >50% of income on rent) — very limited rent-growth headroom before tenants either downsize or default.
Forward outlook
- Local home prices are declining (-3.0%/yr); year-one equity from $11k of loan paydown is wiped out by about $48k of value loss. Plan a longer hold.
- Alameda County population projected at +34% by 2050 — long-run rental-demand tailwind backs the buy-and-hold thesis.
Negotiation context
- It's been on market 602 days — a 12% lower offer ($1.41M) is reasonable based on typical stale-listing flexibility.
- 7 sale attempts since 8y ago; this cycle's ask has dropped $150k (9%) from the opening price — seller is motivated, your offer sets the floor, not the list.
- Current owner paid $1.30M; 23% above their basis — modest negotiation headroom, anchor on the comps not their cost.
Questions for the listing agent
- What do current leases actually rent for vs. the listed asking? Can we see a recent rent roll and the last 12 months of T-12 income?
- It's been on market 602 days. Have you received any prior offers? Is the seller open to a 16% concession, seller financing, or rate buy-down credit?
- Can we see the unit-by-unit rent roll, current vacancy, and any below-market leases? What's the average tenancy length?
- What capital expenditures (roof, boiler, parking lot, exteriors) have been made in the last 5 years, and what's planned in the next 2?
- Why hasn't it sold? Are there any deal-killer items the seller is aware of (foundation, flood, title, zoning, code violations)?
- Is there a deadline driving the sale (1031 exchange, divorce, estate, relocation)? That informs how much negotiation room exists.
- Crime grade is F in this area — have there been break-ins, vandalism, or insurance claims at this property in the last 3 years? What carrier currently insures it and at what premium?
- The area grade is low — what's the realistic commute time and amenity access for the typical tenant pool here? Any planned neighborhood developments (good or bad) we should know about?
- What's the average days-on-market for RENTAL listings here right now (not sales)? A rising rental-DOM trend means longer vacancies and softer asking-rent achievability than the comps imply.
- What's the recent tenant-quality profile in this submarket — average credit score on applications, eviction rate, late-payment / NSF rate, and stable-employment percentage? A property-management company in the area should have these aggregated.
- How much new apartment / multifamily construction is in the pipeline within 1–3 miles? Heavy new supply (>2% of stock underway) typically softens rents 12–24 months out; light construction supports rent growth.
Investment metrics
- 1% rule
- 0.84% ✗
- Cap rate
- 6.03%
- Cash-on-cash
- -0.92%
- DSCR
- 0.96
- GRM
- 9.9
CMA / ARV
No comps found within radius.
Projected returns pro-forma
-3.0% appreciation · 5.5% rent growth · sell at horizon
- IRR
- -15.1%
- Equity multiple
- 0.45×
- Total profit
- $-246,352
- Equity at exit
- $238,565
- IRR
- -2.8%
- Equity multiple
- 0.79×
- Total profit
- $-92,115
- Equity at exit
- $138,339
Cash invested: $448,000 (down + closing). Projections, not guarantees.
Landlord ↔ Tenant lean methodology
- Overall (CITY)
- 0 Strongly Tenant-Friendly
- State California
- 18 Strongly Tenant-Friendly · D+13
- County
- — inherits STATE
- City Oakland
- 0 Strongly Tenant-Friendly · D+62
ZIP-level market 94602
- Rents YoY
- 5.5%
- Active inventory
- 111
- Price-to-rent
- 39.6×
Monthly cashflow live
- Estimated rent
- $13,475 high interval (Pro) →
- Mortgage (P&I)
- −$8,391
- Tax from tax record
- −$1,933 /mo · $23,199/yr
- Insurance
- −$667
- HOA
- −$0
- Vacancy / Maint / Mgmt
- −$2,830
- Net cashflow
- $-345
Break-even live
4-unit breakdown (identical units grouped — click to expand)
| Units | Beds | Baths | Est. rent |
|---|---|---|---|
| 4× units | 3 | 2.2 | $13,476 |
| #1 | 3 | 2.2 | $3,369 |
| #2 | 3 | 2.2 | $3,369 |
| #3 | 3 | 2.2 | $3,369 |
| #4 | 3 | 2.2 | $3,369 |
| Total (4 units) | $13,475 | ||
UW: 25.0% down · 7.5% · 30yr · 1.5% tax · 5.0% vac · 8.0% maint · 8.0% mgmt
Financing live
Cash to close
- Down payment
- $400,000
- Closing costs
- $48,000
- Reserves months
- —
- Total cash needed
- —
Loan-product check · same deal, 3 products live
Conventional
25% down · 7.5% · 30yr
- Down + closing
- —
- Monthly P&I
- —
- Monthly cashflow
- —
- DSCR
- —
- Eligible?
- —
Personal DTI + credit; lowest rate.
DSCR
20% down · 8.5% · 30yr
- Down + closing
- —
- Monthly P&I
- —
- Monthly cashflow
- —
- DSCR
- —
- Eligible?
- —
No personal income docs; deal must DSCR.
Hard money
10% down · 12.0% · 12mo
- Down + closing
- —
- Monthly P&I
- —
- Monthly cashflow
- —
- DSCR
- —
- Eligible?
- —
Short-term bridge; refi at stabilization.
Listing history 32 events
-
2026-06-18days on market $1,600,000 Active 602 DOM
-
2026-06-17days on market $1,600,000 Active 601 DOM
-
2026-06-16days on market $1,600,000 Active 600 DOM
-
2026-06-15days on market $1,600,000 Active 599 DOM
-
2026-06-13days on market $1,600,000 Active 597 DOM
-
2026-06-13days on market $1,600,000 Active 596 DOM
-
2026-06-09days on market $1,600,000 Active 593 DOM
-
2026-06-08days on market $1,600,000 Active 592 DOM
-
2026-06-07remarks 699-char remark
-
2026-06-07statusdays on market $1,600,000 Active 591 DOM
-
2026-04-19status Pending
-
2026-03-09price $1,600,000
-
2026-01-08status Active
-
2026-01-01historical Active Under Contract
-
2025-12-31status Pending
-
2025-01-15status Active
-
2025-01-03historical
-
2024-12-02status Active
-
2024-11-30historical
-
2024-08-25$1,750,000 Active
-
2020-02-10soldstatus $1,300,000 Sold 602-char remark
Show marketing remark (602 chars)
Three houses one lot. Live in Victorian style vacant front house, was built in 1904. Rent out two rear modern contemporary style twin townhouses built in 2009. Each townhouse has 4 bedrooms and 3.5 bath to generate 6K monthly mortgage help income. No rent control on newer construction townhouses. 4 electrical meters, 3 separate meters for gas, and a single water meter. Great potential for those with a vision to possibly convert to 4th unit. A lot of attic room for storage. List for $219 per square feet on 6,402 square feet living space. Too many details to list. Stop by and see it yourself.
-
2020-02-07soldstatus $1,300,000
-
2020-02-06status Pending - Show for Backups 602-char remark
Show marketing remark (602 chars)
Three houses one lot. Live in Victorian style vacant front house, was built in 1904. Rent out two rear modern contemporary style twin townhouses built in 2009. Each townhouse has 4 bedrooms and 3.5 bath to generate 6K monthly mortgage help income. No rent control on newer construction townhouses. 4 electrical meters, 3 separate meters for gas, and a single water meter. Great potential for those with a vision to possibly convert to 4th unit. A lot of attic room for storage. List for $219 per square feet on 6,402 square feet living space. Too many details to list. Stop by and see it yourself.
-
2020-02-05historical Contingent 602-char remark
Show marketing remark (602 chars)
Three houses one lot. Live in Victorian style vacant front house, was built in 1904. Rent out two rear modern contemporary style twin townhouses built in 2009. Each townhouse has 4 bedrooms and 3.5 bath to generate 6K monthly mortgage help income. No rent control on newer construction townhouses. 4 electrical meters, 3 separate meters for gas, and a single water meter. Great potential for those with a vision to possibly convert to 4th unit. A lot of attic room for storage. List for $219 per square feet on 6,402 square feet living space. Too many details to list. Stop by and see it yourself.
-
2019-04-25status Back On Market 602-char remark
Show marketing remark (602 chars)
Three houses one lot. Live in Victorian style vacant front house, was built in 1904. Rent out two rear modern contemporary style twin townhouses built in 2009. Each townhouse has 4 bedrooms and 3.5 bath to generate 6K monthly mortgage help income. No rent control on newer construction townhouses. 4 electrical meters, 3 separate meters for gas, and a single water meter. Great potential for those with a vision to possibly convert to 4th unit. A lot of attic room for storage. List for $219 per square feet on 6,402 square feet living space. Too many details to list. Stop by and see it yourself.
-
2019-04-24price $1,399,000 602-char remark
Show marketing remark (602 chars)
Three houses one lot. Live in Victorian style vacant front house, was built in 1904. Rent out two rear modern contemporary style twin townhouses built in 2009. Each townhouse has 4 bedrooms and 3.5 bath to generate 6K monthly mortgage help income. No rent control on newer construction townhouses. 4 electrical meters, 3 separate meters for gas, and a single water meter. Great potential for those with a vision to possibly convert to 4th unit. A lot of attic room for storage. List for $219 per square feet on 6,402 square feet living space. Too many details to list. Stop by and see it yourself.
-
2019-04-24historical 602-char remark
Show marketing remark (602 chars)
Three houses one lot. Live in Victorian style vacant front house, was built in 1904. Rent out two rear modern contemporary style twin townhouses built in 2009. Each townhouse has 4 bedrooms and 3.5 bath to generate 6K monthly mortgage help income. No rent control on newer construction townhouses. 4 electrical meters, 3 separate meters for gas, and a single water meter. Great potential for those with a vision to possibly convert to 4th unit. A lot of attic room for storage. List for $219 per square feet on 6,402 square feet living space. Too many details to list. Stop by and see it yourself.
-
2019-04-24status Back On Market 602-char remark
Show marketing remark (602 chars)
Three houses one lot. Live in Victorian style vacant front house, was built in 1904. Rent out two rear modern contemporary style twin townhouses built in 2009. Each townhouse has 4 bedrooms and 3.5 bath to generate 6K monthly mortgage help income. No rent control on newer construction townhouses. 4 electrical meters, 3 separate meters for gas, and a single water meter. Great potential for those with a vision to possibly convert to 4th unit. A lot of attic room for storage. List for $219 per square feet on 6,402 square feet living space. Too many details to list. Stop by and see it yourself.
-
2018-10-08historical 602-char remark
Show marketing remark (602 chars)
Three houses one lot. Live in Victorian style vacant front house, was built in 1904. Rent out two rear modern contemporary style twin townhouses built in 2009. Each townhouse has 4 bedrooms and 3.5 bath to generate 6K monthly mortgage help income. No rent control on newer construction townhouses. 4 electrical meters, 3 separate meters for gas, and a single water meter. Great potential for those with a vision to possibly convert to 4th unit. A lot of attic room for storage. List for $219 per square feet on 6,402 square feet living space. Too many details to list. Stop by and see it yourself.
-
2018-07-10$1,488,000 New 602-char remark
Show marketing remark (602 chars)
Three houses one lot. Live in Victorian style vacant front house, was built in 1904. Rent out two rear modern contemporary style twin townhouses built in 2009. Each townhouse has 4 bedrooms and 3.5 bath to generate 6K monthly mortgage help income. No rent control on newer construction townhouses. 4 electrical meters, 3 separate meters for gas, and a single water meter. Great potential for those with a vision to possibly convert to 4th unit. A lot of attic room for storage. List for $219 per square feet on 6,402 square feet living space. Too many details to list. Stop by and see it yourself.
-
2000-06-26soldstatus $240,000
-
1999-12-03soldstatus $116,000
ⓘ Source: listings_history table (triggers on properties + properties_extension) + one-shot
backfill from property_details.listing_events for pre-trigger history.
Tax reassessment forecast CA · Resets to sale price
- Current annual tax
- $23,199 · $1,933/mo
- Projected year-2 tax
- $23,199 · $1,933/mo
- Expected delta
- $0/yr ($0/mo · 0.0%)
ⓘ Screening estimate from a state-policy table — verify with the county assessor before closing.
Climate risk First Street
- Flood 3/10 Moderate FEMA zone X (unshaded) · 20% chance over 30 yrs
- Wildfire 1/10 Low
- Heat 3/10 Moderate 7 d/yr ≥84°F today · 15 d/yr by 30 yrs out
- Wind 1/10 Low
- Air quality 8/10 Severe 14 unhealthy d/yr today · 14 by 30 yrs out
Nearby sold comps map
Loading sold comps map…
Walkable amenities ~0.75 mi
Loading nearby amenities…
Taxation est. · year 1
- Rental income
- $161,700
- − Mortgage interest
- −$89,625
- − Property taxes
- −$23,199
- − Insurance
- −$8,000
- − Repairs & maintenance
- −$12,936
- − Management
- −$12,936
- − Depreciation
- −$46,545
- Taxable loss
- −$31,541
- Est. tax savings @ 24.0%
- +$7,570
- After-tax cash flow
- $3,427/yr
For passive investors: Depreciation is non-cash, so a rental often shows a tax loss while cash-flowing — sheltering income. Rental losses are passive: they offset passive income freely, and up to $25,000/yr can offset ordinary (W-2) income if you actively participate and your MAGI is under $100k (phasing out to $0 by $150k); unused losses carry forward. On sale, claimed depreciation is recaptured at up to 25%, and gains may owe capital-gains tax (a 1031 exchange can defer both). Figures are a year-1 estimate at your 24.0% rate — not tax advice; consult a CPA.
Schools (NCES district)
- District
- Oakland Unified
- NCES district ID
- 0628050
- Math proficiency
- 27% ▬ 0.00%
- Reading proficiency
- 33% ▬ 0.00%
- Median HH income
- $55,194
- Composite
- 29.52/100
- National rank
- #11769
- State rank
- #1007 of 1400 in CA
Livability — Oakland
- Score
- 71/100
- State rank
- #224
- US rank
- #7245
Category grades
Schools grade is shown separately in the Schools card above.
Census & demographics
- Census place
- Oakland, CA
- County
- Alameda County · 1,614,355 people
- City population
- 385,993
- Metro
- San Francisco-Oakland-Berkeley, CA
- Population (ZIP)
- 31,759
- Household income
- $122,263
- Rent vs Own
- Severe rent burden
- 1018.0
Population outlook (Alameda County) Hauer SSP2
- Today (2025)
- 1,928,884 people
- By 2030
- 2,069,146 · +7.3%
- By 2040
- 2,338,405 · +21.2%
- By 2050
- 2,586,608 · +34.1%
- By 2075
- 3,061,911 · +58.7%
- By 2100
- 3,234,133 · +67.7%
Race, ethnicity, and origin ACS 2023
- Neighborhood character
- Highly diverse neighborhood (Simpson 0.75)
- Race & ethnicity
- White 41% Hispanic / Latino 20% Asian 16% Black 15% Two or more races 11% Pacific Islander 1%
- Hispanic origin (detail)
- Mexican 11% Puerto Rican 2%
- Common ancestry
- Italian 3% Lithuanian 2% Romanian 1%
- Foreign-born
- 24% · Canada, China, Vietnam
- Languages at home
- 67% English-only · Spanish 14% Chinese 8% Other Asian/Pacific 2%
Political lean MEDSL · Alameda
- 2024 margin
- Solid D (+53.6) · D 74.6% · R 21.0% · Other 4.4%
- 2008→2024 swing
- -5.9pp toward R · 2008: 59.5pp · 2024: 53.6pp
- All cycles
- 2024: D+53.6 2020: D+62.5 2016: D+64.4 2012: D+59.8 2008: D+59.5
Not yet ingested
- Civics
- —
Market trends
- HPI YoY
- ▼ -1108.77%
- Current HPI
- 275.7267
- Rent YoY
- ▲ 5.50%
- Metro
- San Francisco-Oakland-Berkeley, CA
- State GDP YoY
- ▲ 3.21%
- F500 in state
- 116
Industry mix (Fortune 500 HQ in CA)
| Industry | F500 HQs | Revenue |
|---|---|---|
| Technology | 27 | $1,492B |
|
||
| Financial Services | 3 | $174B |
|
||
| Retail | 3 | $44B |
|
||
| Insurance | 3 | $26B |
|
||
| Media / Entertainment | 2 | $115B |
|
||
| Pharmaceuticals / Biotech | 2 | $62B |
|
||
Price history
+1279.3% since first listed22 events — show timeline
- 2026-04-19 Pending — bridgeMLS, Bay East AOR, or Contra Costa AOR
- 2026-03-09 Price Changed $1,600,000 bridgeMLS, Bay East AOR, or Contra Costa AOR
- 2026-01-08 Relisted — bridgeMLS, Bay East AOR, or Contra Costa AOR
- 2026-01-01 Contingent — bridgeMLS, Bay East AOR, or Contra Costa AOR
- 2025-12-31 Pending — bridgeMLS, Bay East AOR, or Contra Costa AOR
- 2025-01-15 Relisted — bridgeMLS, Bay East AOR, or Contra Costa AOR
- 2025-01-03 Listing Removed — bridgeMLS, Bay East AOR, or Contra Costa AOR
- 2024-12-02 Relisted — bridgeMLS, Bay East AOR, or Contra Costa AOR
- 2024-11-30 Listing Removed — bridgeMLS, Bay East AOR, or Contra Costa AOR
- 2024-08-25 Listed $1,750,000 bridgeMLS, Bay East AOR, or Contra Costa AOR
- 2020-02-10 Sold (MLS) $1,300,000 bridgeMLS, Bay East AOR, or Contra Costa AOR
- 2020-02-07 Sold (Public Records) $1,300,000 Public Records
- 2020-02-06 Pending — bridgeMLS, Bay East AOR, or Contra Costa AOR
- 2020-02-05 Contingent — bridgeMLS, Bay East AOR, or Contra Costa AOR
- 2019-04-25 Relisted — bridgeMLS, Bay East AOR, or Contra Costa AOR
- 2019-04-24 Price Changed $1,399,000 bridgeMLS, Bay East AOR, or Contra Costa AOR
- 2019-04-24 Listing Removed — bridgeMLS, Bay East AOR, or Contra Costa AOR
- 2019-04-24 Relisted — bridgeMLS, Bay East AOR, or Contra Costa AOR
- 2018-10-08 Listing Removed — bridgeMLS, Bay East AOR, or Contra Costa AOR
- 2018-07-10 Listed $1,488,000 bridgeMLS, Bay East AOR, or Contra Costa AOR
- 2000-06-26 Sold (Public Records) $240,000 Public Records
- 1999-12-03 Sold (Public Records) $116,000 Public Records
Property tax history
+10.2%/yrLatest (2025): $23,199 · +11.9% YoY. Source: county tax records.
Cash-flow waterfall
monthlySold comps — $/sqft
last 12 mo · ≤1 miLoading sold comps…