416 Marietta St · Crowell, TX
Flood risk 1/10 · Minimal
- FEMA flood zone
- —
- Chance of flooding over 30 yrs
- 0.0%
- Est. flood insurance / yr
- —
Fire risk 5/10 · Moderate
- Est. fire insurance / yr
- $1,222 – $2,270
Heat risk 7/10 · Major
- Hot days now (above 109°F)
- 6 days/yr
- Hot days in 30 yrs
- 17 days/yr
Wind risk 3/10 · Minor
- Chance of severe wind over 30 yrs
- 6.0%
Air-quality risk 1/10 · Minimal
- Unhealthy air days now
- 0 days/yr
- Unhealthy air days in 30 yrs
- 0 days/yr
Risk factors via First Street. Map © Google.
Why this score? — see what drove the D+ grade
The composite is a weighted blend of 9 inputs, each scored 0–100. Each bar is that input's sub-score; the figure is the points it added to the 100-point composite (weight × sub-score).
- Cash flow +15.0/30.0
- ARV discount +7.5/15.0
- Appreciation +5.4/10.0
- 1% rule +5.0/10.0
- DSCR +5.0/10.0
- Livability +3.4/5.0
- Schools +3.2/10.0
- Rent growth +2.5/5.0
- Condition / age +2.5/5.0
$12,500
🖨 Deal sheet 📄 Offer letter ✓ Due diligence
Listing remarks MLS
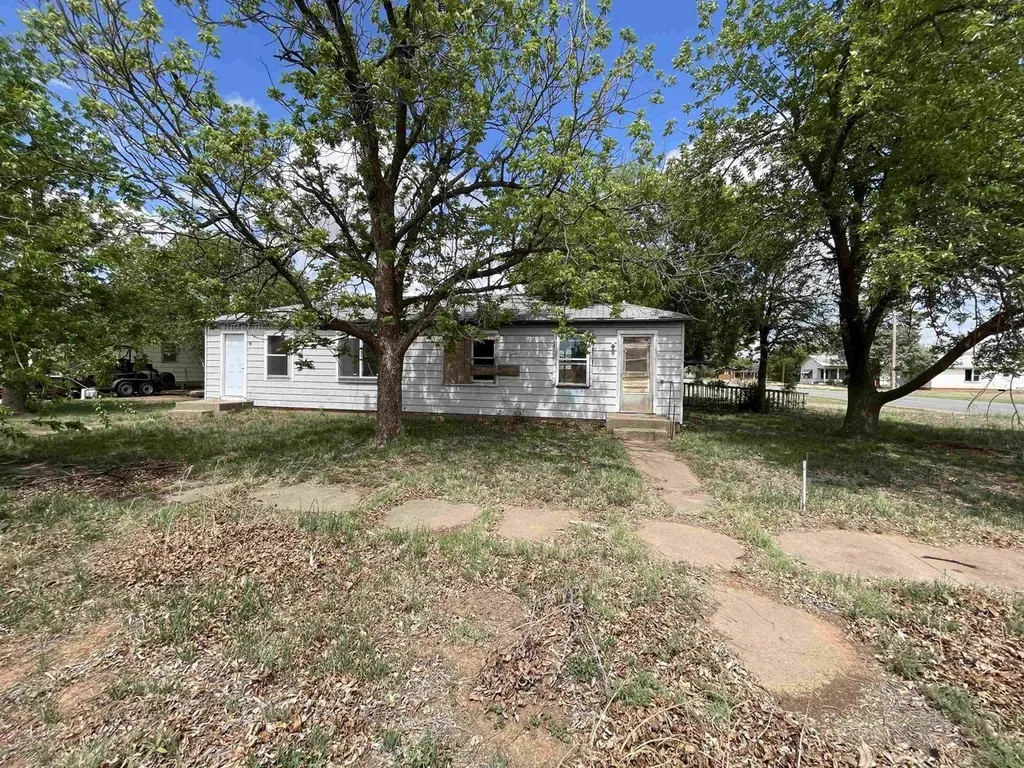
Originally a duplex, now opened into one residence—easily convert back if desired. Ideal investment or renovation project with partial updates already underway. One bath features a new tub and toilet; second one is bare bones. Some new windows installed, others included. New electrical mast in place (not yet connected). Partial electrical and plumbing updates completed. Situated on a corner lot with strong potential. Located a few blocks from the school and a couple of blocks from HWY 70.
Key facts
- New tub
- Corner lot
- New toilet
Tags
Neighborhood map
What this means for you Summary
Snapshot
- This is a 2-bed/2.0-bath single-family listed at $12k.
Deal economics
- At list price, monthly cash flow is $668 ($8k/yr) — positive.
- The deal already cash-flows at list — no discount required.
- Meets the 1% rule at list price ($954 rent vs $12k).
- Recommended offer: $12k (3.0% below list) — sets the bar for market timing.
Location & tenants
- Location reads 67/100 on livability (#511 in TX) — a middle-class / working-renter tenant base. Strengths: crime A+, cost of living A+, housing A+; Watch: health & safety C-, schools F, amenities F.
- Crowell ISD (rural): math 40% / reading 30% proficiency, ranked #917 of 1,141 in TX (top 80%) — families likely to look elsewhere, expect single-tenant / working-renter base with shorter leases.
- Market conditions: 8 active listings in the ZIP.
Forward outlook
- In year one you build about $180 of equity ($86 loan paydown + $94 appreciation (0.8% local appreciation)).
- Foard County population projected at -14% by 2050 — secular population decline; favor cash flow + early exit over multi-decade hold.
- At projected returns (0.8% appreciation + 3.0% rent growth), your $4k cash investment doubles in ~1 year — after that, you're playing with house money.
Negotiation context
- It's been on market 46 days — a 3% lower offer ($12k) is reasonable based on typical stale-listing flexibility.
Risks & watch-outs
- Watch-outs: built in 1950 — expect roof / HVAC / electrical / plumbing capex.
- Climate carrying-cost: moderate wildfire risk; extreme-heat days projected 6→17/yr by 2055 (HVAC capex compounding) — expect insurance premiums to compound above CPI over the hold.
Questions for the listing agent
- It's been on market 46 days. Have you received any prior offers? Is the seller open to a 3% concession, seller financing, or rate buy-down credit?
- Built in 1950 — when were the roof, HVAC, electrical panel, plumbing, and water heater last replaced?
- Is there a deadline driving the sale (1031 exchange, divorce, estate, relocation)? That informs how much negotiation room exists.
- Schools are F-rated, which usually means shorter tenancies and higher turnover. Who's the typical renter profile here, and what's been the actual vacancy rate?
- The area grade is low — what's the realistic commute time and amenity access for the typical tenant pool here? Any planned neighborhood developments (good or bad) we should know about?
- What's the average days-on-market for RENTAL listings here right now (not sales)? A rising rental-DOM trend means longer vacancies and softer asking-rent achievability than the comps imply.
- What's the recent tenant-quality profile in this submarket — average credit score on applications, eviction rate, late-payment / NSF rate, and stable-employment percentage? A property-management company in the area should have these aggregated.
- How much new for-sale + rental construction is in the pipeline within 1–3 miles? Heavy new supply typically softens prices + rents 12–24 months out; constrained supply supports both.
Investment metrics
- 1% rule
- 7.63% ✓
- Cap rate
- 70.37%
- Cash-on-cash
- 228.86%
- DSCR
- 11.18
- GRM
- 1.1
CMA / ARV
- ARV (median comp)
- $30,160
- List price
- $12,500
- Delta
- -58.55%
- Verdict
- UNDERPRICED
- Comps
- 2 within 1.0 mi
Projected returns pro-forma
0.75% appreciation · 3.0% rent growth · sell at horizon
- IRR
- —
- Equity multiple
- 13.17×
- Total profit
- $42,611
- Equity at exit
- $4,106
- IRR
- —
- Equity multiple
- 27.88×
- Total profit
- $94,071
- Equity at exit
- $5,334
Cash invested: $3,500 (down + closing). Projections, not guarantees.
Landlord ↔ Tenant lean methodology
- Overall (STATE)
- 87 Strongly Landlord-Friendly
- State Texas
- 87 Strongly Landlord-Friendly · R+5
- County
- — inherits STATE
- City
- — inherits STATE
ZIP-level market 79227
- Home prices YoY
- 1.2%
- Active inventory
- 8
- Price-to-rent
- 1.1×
Monthly cashflow live
- Estimated rent
- $954 medium interval (Pro) →
- Mortgage (P&I)
- −$66
- Tax est. 1.5%
- −$16 /mo · $188/yr
- Insurance
- −$5
- HOA
- −$0
- Vacancy / Maint / Mgmt
- −$200
- Net cashflow
- $668
Break-even live
UW: 25.0% down · 7.5% · 30yr · 1.5% tax · 5.0% vac · 8.0% maint · 8.0% mgmt
Financing live
Cash to close
- Down payment
- $3,125
- Closing costs
- $375
- Reserves months
- —
- Total cash needed
- —
Loan-product check · same deal, 3 products live
Conventional
25% down · 7.5% · 30yr
- Down + closing
- —
- Monthly P&I
- —
- Monthly cashflow
- —
- DSCR
- —
- Eligible?
- —
Personal DTI + credit; lowest rate.
DSCR
20% down · 8.5% · 30yr
- Down + closing
- —
- Monthly P&I
- —
- Monthly cashflow
- —
- DSCR
- —
- Eligible?
- —
No personal income docs; deal must DSCR.
Hard money
10% down · 12.0% · 12mo
- Down + closing
- —
- Monthly P&I
- —
- Monthly cashflow
- —
- DSCR
- —
- Eligible?
- —
Short-term bridge; refi at stabilization.
Listing history 1 events
-
2026-04-11$12,500 Active 499-char remark
Show marketing remark (499 chars)
Originally a duplex, now opened into one residence—easily convert back if desired. Ideal investment or renovation project with partial updates already underway. One bath features a new tub and toilet; second one is bare bones. Some new windows installed, others included. New electrical mast in place (not yet connected). Partial electrical and plumbing updates completed. Situated on a corner lot with strong potential. Located a few blocks from the school and a couple of blocks from HWY 70.
ⓘ Source: listings_history table (triggers on properties + properties_extension) + one-shot
backfill from property_details.listing_events for pre-trigger history.
Climate risk First Street
- Flood 1/10 Low 0% chance over 30 yrs
- Wildfire 5/10 Major
- Heat 7/10 Severe 6 d/yr ≥109°F today · 17 d/yr by 30 yrs out
- Wind 3/10 Moderate 6% chance of damaging wind over 30 yrs
- Air quality 1/10 Low 0 unhealthy d/yr today · 0 by 30 yrs out
Nearby sold comps map
Loading sold comps map…
Walkable amenities ~0.75 mi
Loading nearby amenities…
Taxation est. · year 1
- Rental income
- $11,452
- − Mortgage interest
- −$700
- − Property taxes
- −$188
- − Insurance
- −$62
- − Repairs & maintenance
- −$916
- − Management
- −$916
- − Depreciation
- −$364
- Taxable income
- $8,306
- Est. tax owed @ 24.0%
- −$1,993
- After-tax cash flow
- $6,017/yr
For passive investors: Depreciation is non-cash, so a rental often shows a tax loss while cash-flowing — sheltering income. Rental losses are passive: they offset passive income freely, and up to $25,000/yr can offset ordinary (W-2) income if you actively participate and your MAGI is under $100k (phasing out to $0 by $150k); unused losses carry forward. On sale, claimed depreciation is recaptured at up to 25%, and gains may owe capital-gains tax (a 1031 exchange can defer both). Figures are a year-1 estimate at your 24.0% rate — not tax advice; consult a CPA.
Schools (NCES district)
- District
- Crowell ISD
- NCES district ID
- 4815870
- Math proficiency
- 40% ▲ 5.00%
- Reading proficiency
- 30% ▬ 0.00%
- Median HH income
- $37,747
- Composite
- 31.83/100
- National rank
- #11074
- State rank
- #917 of 1141 in TX
Livability — Crowell
- Score
- 67/100
- State rank
- #511
- US rank
- #10114
Category grades
Schools grade is shown separately in the Schools card above.
Census & demographics
- Census place
- Crowell, TX
- Population (ZIP)
- 1,155
Population outlook (Foard County) Hauer SSP2
- Today (2025)
- 1,129 people
- By 2030
- 1,083 · -4.1%
- By 2040
- 1,008 · -10.7%
- By 2050
- 965 · -14.5%
- By 2075
- 1,012 · -10.4%
- By 2100
- 1,089 · -3.5%
Race, ethnicity, and origin ACS 2023
- Neighborhood character
- Predominantly White (70%)
- Race & ethnicity
- White 70% Two or more races 22% Hispanic / Latino 10%
- Hispanic origin (detail)
- Mexican 8%
- Common ancestry
- Italian 4% Serbian 1% Hungarian 1%
- Foreign-born
- 1% · Canada
- Languages at home
- 97% English-only · Spanish 3% Russian/Polish/Slavic 1%
Political lean MEDSL · Foard
- 2024 margin
- Solid R (+65.3) · D 16.9% · R 82.2%
- 2008→2024 swing
- -41.3pp toward R · 2008: -24.0pp · 2024: -65.3pp
- All cycles
- 2024: R+65.3 2020: R+62.8 2016: R+52.8 2012: R+41.8 2008: R+24.0
Not yet ingested
- Civics
- —
Market trends
- HPI YoY
- ▲ 0.75%
- Current HPI
- 62.2371
- Rent YoY
- —
- Metro
- —
- State GDP YoY
- ▲ 3.95%
- F500 in state
- 110
Industry mix (Fortune 500 HQ in TX)
| Industry | F500 HQs | Revenue |
|---|---|---|
| Energy | 16 | $1,198B |
|
||
| Technology | 5 | $198B |
|
||
| Engineering / Construction | 4 | $72B |
|
||
| Energy Services | 3 | $60B |
|
||
| Utilities | 3 | $41B |
|
||
| Healthcare | 2 | $330B |
|
||
Price history
1 event — show timeline
- 2026-04-11 Listed $12,500 WFAOR
Cash-flow waterfall
monthlySold comps — $/sqft
last 12 mo · ≤1 miLoading sold comps…