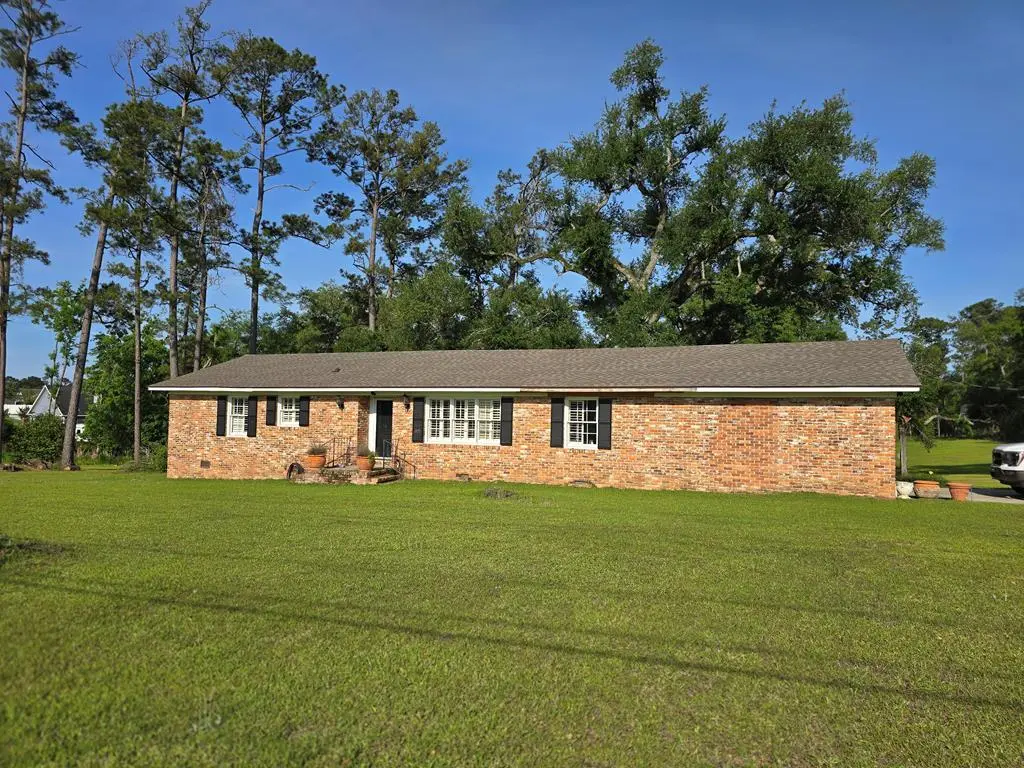
3921 Cat Creek Rd · Bemiss, GA
Flood risk No data
- FEMA flood zone
- —
- Chance of flooding over 30 yrs
- —
- Est. flood insurance / yr
- —
Fire risk No data
- Est. fire insurance / yr
- —
Heat risk No data
- Hot days now (above threshold)
- —
- Hot days in 30 yrs
- —
Wind risk No data
- Chance of severe wind over 30 yrs
- —
Air-quality risk No data
- Unhealthy air days now
- —
- Unhealthy air days in 30 yrs
- —
Risk factors via First Street. Map © Google.
Why this score? — see what drove the C grade
The composite is a weighted blend of 9 inputs, each scored 0–100. Each bar is that input's sub-score; the figure is the points it added to the 100-point composite (weight × sub-score).
- Cash flow +19.5/30.0
- ARV discount +12.2/15.0
- DSCR +6.2/10.0
- Schools +4.7/10.0
- 1% rule +4.3/10.0
- Rent growth +3.8/5.0
- Livability +2.5/5.0
- Condition / age +2.5/5.0
- Appreciation +0.0/10.0
$199,900
🖨 Deal sheet 📄 Offer letter ✓ Due diligence
Key facts
- 4.25 acre lot
- Built 1969
- Listed 38 days
Property features AI
Exterior
- Utilities: Private well water; Septic tank sewer
- Home design: Single-family residence; One-story house; Brick veneer construction
- Construction: Brick veneer construction; Built as a house (single family)
- Exterior features: Irregular lot; Approximately 4.25 acres; Zoned R-10
Interior
- Kitchen: Refrigerator
- Flooring: Carpet
- Bathrooms: 2 full bathrooms
- Heating & cooling: Heat pump heating
- Interior features: Refrigerator included; Carpet flooring
- Laundry & utility: Dedicated laundry room
Neighborhood map
What this means for you Summary
Snapshot
- This is a 3-bed/2.0-bath single-family listed at $200k.
Deal economics
- At list price, monthly cash flow is $227 ($3k/yr) — positive.
- The deal already cash-flows at list — no discount required.
- To meet the 1% rule (rent ≥ 1% of price), the offer needs to be $185k (7.4% below list).
- Recommended offer: $185k (7.4% below list) — sets the bar for 1% rule.
- Cap rate 7.7% vs local median 4.7% in Bemiss — top-decile yield for the area; either an underpriced asset or a hidden risk that comps aren't pricing in. Stress-test before assuming the spread holds.
Location & tenants
- Location reads: area grade C — affects rentability + tenant quality, not the cash-flow math above.
- Lowndes County (rural): math 59% / reading 52% proficiency, ranked #8 of 174 in GA (top 5%) — acceptable for families but not a draw, mixed tenant base, ~2y average lease.
- Market conditions: Rents rising fast (+5.1%/yr); 228 active listings in the ZIP; 23 comparable units currently listed for rent nearby; rentals at typical pace (median 21d on market — plan ~3-4 weeks tenant-placement turnaround); solid renter incomes; 896 units permitted in Lowndes County in 2024 (0 in 5+ unit buildings).
Forward outlook
- Local home prices are declining (-3.0%/yr); year-one equity from $1k of loan paydown is wiped out by about $6k of value loss. Plan a longer hold.
- Lowndes County population projected at +10% by 2050 — modest demand growth; plan on rents tracking national, not racing it.
Negotiation context
- It's been on market 39 days — a 3% lower offer ($194k) is reasonable based on typical stale-listing flexibility.
Questions for the listing agent
- It's been on market 39 days. Have you received any prior offers? Is the seller open to a 7% concession, seller financing, or rate buy-down credit?
- Built in 1969 — when were the roof, HVAC, electrical panel, plumbing, and water heater last replaced?
- Is there a deadline driving the sale (1031 exchange, divorce, estate, relocation)? That informs how much negotiation room exists.
- What's the average days-on-market for RENTAL listings here right now (not sales)? A rising rental-DOM trend means longer vacancies and softer asking-rent achievability than the comps imply.
- What's the recent tenant-quality profile in this submarket — average credit score on applications, eviction rate, late-payment / NSF rate, and stable-employment percentage? A property-management company in the area should have these aggregated.
- How much new for-sale + rental construction is in the pipeline within 1–3 miles? Heavy new supply typically softens prices + rents 12–24 months out; constrained supply supports both.
Investment metrics
- 1% rule
- 0.93% ✗
- Cap rate
- 7.66%
- Cash-on-cash
- 4.87%
- DSCR
- 1.22
- GRM
- 9.0
CMA / ARV
- ARV (median comp)
- $222,945
- List price
- $199,900
- Delta
- -10.34%
- Verdict
- UNDERPRICED
- Comps
- 20 within 1.0 mi
Show comp detail 12 sales within ~0.75 mi
| Address | Dist | Beds/Ba | Sqft | Sold | Price | $/sf | Match |
|---|---|---|---|---|---|---|---|
| 3705 Cross Creek Cir | 0.31mi | 3/2.0 | 1,726 (+5%) | 2mo | $256,900 | $149 | 75 |
| 4192 Bowen Way | 0.49mi | 4/2.0 (+1) | 1,689 (+3%) | 1mo | $295,000 | $175 | 66 |
| 4221 Buckhead Dr | 0.58mi | 4/2.0 (+1) | 1,562 (-5%) | 0mo | $250,000 | $160 | 60 |
| 4145 Conway Cir | 0.41mi | 3/2.0 | 1,834 (+12%) | 2mo | $280,000 | $153 | 60 |
| 4052 Glen Laurel Dr E | 0.63mi | 3/2.0 | 1,530 (-6%) | 2mo | $269,000 | $176 | 58 |
| 3968 W Glen Laurel Dr | 0.66mi | 4/2.5 (+1) | 1,680 (+3%) | 4mo | $260,000 | $155 | 55 |
| 5209 N Northridge Rd | 0.73mi | 3/2.0 | 1,541 (-6%) | 4mo | $229,000 | $149 | 53 |
| 3966 Newbury Dr | 0.69mi | 3/2.0 | 1,520 (-7%) | 4mo | $266,000 | $175 | 52 |
| 3679 Newbury Dr | 0.68mi | 3/2.0 | 1,454 (-11%) | 0mo | $232,500 | $160 | 49 |
| 4035 Gramercy Dr | 0.69mi | 4/2.0 (+1) | 1,755 (+7%) | 4mo | $350,000 | $199 | 47 |
| 4031 Gramercy Dr | 0.69mi | 4/2.0 (+1) | 1,787 (+9%) | 3mo | $304,900 | $171 | 45 |
| 4098 Gramercy Dr | 0.65mi | 4/2.0 (+1) | 1,843 (+13%) | 3mo | $317,000 | $172 | 41 |
Match score weights: distance 35% · size 25% · config 20% · recency 20%. Top-matched comps best support the ARV.
Projected returns pro-forma
-3.0% appreciation · 5.07% rent growth · sell at horizon
- IRR
- -6.6%
- Equity multiple
- 0.75×
- Total profit
- $-14,038
- Equity at exit
- $29,806
- IRR
- 5.1%
- Equity multiple
- 1.41×
- Total profit
- $23,024
- Equity at exit
- $17,284
Cash invested: $55,972 (down + closing). Projections, not guarantees.
Landlord ↔ Tenant lean methodology
- Overall (STATE)
- 90 Strongly Landlord-Friendly
- State Georgia
- 90 Strongly Landlord-Friendly · R+3
- County
- — inherits STATE
- City
- — inherits STATE
ZIP-level market 31605
- Home prices YoY
- -11.5%
- Rents YoY
- 5.1%
- Active inventory
- 228
- Price-to-rent
- 9.0×
Monthly cashflow live
- Estimated rent
- $1,852 high interval (Pro) →
- Mortgage (P&I)
- −$1,048
- Tax from tax record
- −$104 /mo · $1,249/yr
- Insurance
- −$83
- HOA
- −$0
- Vacancy / Maint / Mgmt
- −$389
- Net cashflow
- $227
Break-even live
UW: 25.0% down · 7.5% · 30yr · 1.5% tax · 5.0% vac · 8.0% maint · 8.0% mgmt
Financing live
Cash to close
- Down payment
- $49,975
- Closing costs
- $5,997
- Reserves months
- —
- Total cash needed
- —
Loan-product check · same deal, 3 products live
Conventional
25% down · 7.5% · 30yr
- Down + closing
- —
- Monthly P&I
- —
- Monthly cashflow
- —
- DSCR
- —
- Eligible?
- —
Personal DTI + credit; lowest rate.
DSCR
20% down · 8.5% · 30yr
- Down + closing
- —
- Monthly P&I
- —
- Monthly cashflow
- —
- DSCR
- —
- Eligible?
- —
No personal income docs; deal must DSCR.
Hard money
10% down · 12.0% · 12mo
- Down + closing
- —
- Monthly P&I
- —
- Monthly cashflow
- —
- DSCR
- —
- Eligible?
- —
Short-term bridge; refi at stabilization.
Rent comps 23 comps
| Address | Beds | Baths | Sqft | Rent | $/sqft | DOM | Units | Dist |
|---|---|---|---|---|---|---|---|---|
| 4001 Conway Cir Valdosta, GA | 3.0 | 2.0 | 1797 | $2,000 | $1.11 | 21d | 1 | 0.28mi |
| 4007 Foxridge Ln Valdosta, GA | 4.0 | 2.0 | 1450 | $1,750 | $1.21 | 21d | 1 | 0.35mi |
| 5026 Pearl Davis Rd Valdosta, GA | 3.0 | 2.0 | 1207 | $1,200 | $0.99 | 21d | 1 | 0.37mi |
| 4125 Barrington Dr Valdosta, GA | 3.0 | 2.0 | 1212 | $1,500 | $1.24 | 44d | 1 | 0.51mi |
| 4141 Pebble Creek Dr Valdosta, GA | 3.0 | 2.0 | 1189 | $1,295 | $1.09 | 21d | 1 | 0.53mi |
| 6023 Bemiss Towns Dr Valdosta, GA | 3.0 | 2.5 | 1498 | $1,550 | $1.03 | 21d | 1 | 0.53mi |
| 6042 Bemiss Towns Dr Valdosta, GA | 3.0 | 2.0 | 1537 | $1,700 | $1.11 | 21d | 1 | 0.53mi |
| 4032 Case Pt Valdosta, GA | 4.0 | 2.0 | 1664 | $2,050 | $1.23 | 21d | 1 | 0.55mi |
| 4120 Clay Dr Valdosta, GA | 4.0 | 2.0 | 1806 | $2,000 | $1.11 | 21d | 1 | 0.61mi |
| 3912 Duke Ct Valdosta, GA | 4.0 | 2.0 | 1850 | $2,000 | $1.08 | 21d | 1 | 0.63mi |
| 4051 Gramercy Dr Valdosta, GA | 4.0 | 2.5 | 1771 | $2,300 | $1.30 | 21d | 1 | 0.65mi |
| 5124 Northridge Rd S Valdosta, GA | 3.0 | 2.0 | 1454 | $1,700 | $1.17 | 21d | 1 | 0.65mi |
| 3925 Glen Laurel Dr S Valdosta, GA | 3.0 | 2.0 | 1510 | $1,850 | $1.23 | 21d | 1 | 0.69mi |
| 3908 Countess Ct Valdosta, GA | 4.0 | 2.0 | 1917 | $2,250 | $1.17 | 44d | 1 | 0.69mi |
| 3919 Stratford Cir Valdosta, GA | 4.0 | 2.0 | 2024 | $1,900 | $0.94 | 44d | 1 | 0.76mi |
| 3964 Crusader Ct Valdosta, GA | 4.0 | 2.0 | 1851 | $2,400 | $1.30 | 21d | 1 | 0.88mi |
| 3844 Coventry Dr Valdosta, GA | 4.0 | 2.0 | 1765 | $1,950 | $1.10 | 21d | 1 | 0.95mi |
| 6416 Abney Ct Valdosta, GA | 3.0 | 2.5 | 1459 | $1,500 | $1.03 | 44d | 1 | 1.05mi |
| 6412 Abney Ct Valdosta, GA | 3.0 | 2.5 | 1459 | $1,500 | $1.03 | 21d | 1 | 1.05mi |
| 3824 Brookfield Dr Valdosta, GA | 3.0 | 2.0 | 1517 | $2,000 | $1.32 | 21d | 1 | 1.07mi |
| 6043 Bemiss Towns Dr Bemiss, GA | 3.0 | 2.5 | 1498 | $1,675 | $1.12 | 21d | 1 | 1.16mi |
| 3875 Trotters Ridge Cir Valdosta, GA | 3.0 | 2.0 | 1292 | $1,700 | $1.32 | 21d | 1 | 1.21mi |
| 3905 Greenridge Rd Valdosta, GA | 3.0 | 2.0 | 1398 | $1,400 | $1.00 | 44d | 1 | 1.37mi |
Listing history 19 events
-
2026-06-19days on market $199,900 Active 39 DOM
-
2026-06-18days on market $199,900 Active 38 DOM
-
2026-06-17days on market $199,900 Active 37 DOM
-
2026-06-16days on market $199,900 Active 36 DOM
-
2026-06-15days on market $199,900 Active 35 DOM
-
2026-06-14pricedays on market $199,900 Active 33 DOM
-
2026-06-13days on market $219,900 Active 32 DOM
-
2026-06-10days on market $219,900 Active 30 DOM
-
2026-06-09days on market $219,900 Active 29 DOM
-
2026-06-09price $219,900 Active 28 DOM
-
2026-06-08days on market $249,900 Active 28 DOM
-
2026-06-07days on market $249,900 Active 27 DOM
-
2026-06-05days on market $249,900 Active 24 DOM
-
2026-06-03days on market $249,900 Active 23 DOM
-
2026-06-02days on market $249,900 Active 22 DOM
-
2026-06-01days on market $249,900 Active 21 DOM
-
2026-05-31days on market $249,900 Active 20 DOM
-
2026-05-30days on market $249,900 Active 19 DOM
-
2026-05-11$249,900 Active 315-char remark
ⓘ Source: listings_history table (triggers on properties + properties_extension) + one-shot
backfill from property_details.listing_events for pre-trigger history.
Tax reassessment forecast GA · Resets to sale price
- Current annual tax
- $1,249 · $104/mo
- Projected year-2 tax
- $1,839 · $153/mo
- Expected delta
- +$590/yr (+$49/mo · 47.2%)
ⓘ Screening estimate from a state-policy table — verify with the county assessor before closing.
Nearby sold comps map
Loading sold comps map…
Walkable amenities ~0.75 mi
Loading nearby amenities…
Taxation est. · year 1
- Rental income
- $22,223
- − Mortgage interest
- −$11,198
- − Property taxes
- −$1,249
- − Insurance
- −$1,000
- − Repairs & maintenance
- −$1,778
- − Management
- −$1,778
- − Depreciation
- −$5,815
- Taxable loss
- −$594
- Est. tax savings @ 24.0%
- +$143
- After-tax cash flow
- $2,871/yr
For passive investors: Depreciation is non-cash, so a rental often shows a tax loss while cash-flowing — sheltering income. Rental losses are passive: they offset passive income freely, and up to $25,000/yr can offset ordinary (W-2) income if you actively participate and your MAGI is under $100k (phasing out to $0 by $150k); unused losses carry forward. On sale, claimed depreciation is recaptured at up to 25%, and gains may owe capital-gains tax (a 1031 exchange can defer both). Figures are a year-1 estimate at your 24.0% rate — not tax advice; consult a CPA.
Schools (NCES district)
- District
- Lowndes County
- NCES district ID
- 1303390
- Math proficiency
- 59% ▼ -1.00%
- Reading proficiency
- 52% ▼ -2.00%
- Median HH income
- $48,221
- Composite
- 47.21/100
- National rank
- #2317
- State rank
- #8 of 174 in GA
Livability — Bemiss
No livability data for this city. (Only ~50 U.S. cities are tracked.)
Census & demographics
- Census place
- Bemiss, GA
- County
- Lowndes County · 107,801 people
- City population
- 24,280
- Metro
- Valdosta, GA
- Population (ZIP)
- 24,829
- Household income
- $79,156
- Rent vs Own
- Severe rent burden
- 642.0
Population outlook (Lowndes County) Hauer SSP2
- Today (2025)
- 120,348 people
- By 2030
- 123,469 · +2.6%
- By 2040
- 128,482 · +6.8%
- By 2050
- 131,907 · +9.6%
- By 2075
- 139,080 · +15.6%
- By 2100
- 133,649 · +11.1%
Race, ethnicity, and origin ACS 2023
- Neighborhood character
- Diverse neighborhood (Simpson 0.58)
- Race & ethnicity
- White 58% Black 27% Two or more races 7% Hispanic / Latino 7% Asian 2%
- Hispanic origin (detail)
- Mexican 3% Puerto Rican 3%
- Common ancestry
- Italian 2% Slovak 2% Lithuanian 2%
- Foreign-born
- 4% · Canada, South Korea, Vietnam
- Languages at home
- 93% English-only · Spanish 3% German/W. Germanic 1%
Political lean MEDSL · Lowndes
- 2024 margin
- R (+18.0) · D 40.8% · R 58.8%
- 2008→2024 swing
- -8.6pp toward R · 2008: -9.4pp · 2024: -18.0pp
- All cycles
- 2024: R+18.0 2020: R+12.0 2016: R+18.2 2012: R+10.5 2008: R+9.4
Not yet ingested
- Civics
- —
Market trends
- HPI YoY
- ▼ -24.74%
- Current HPI
- 189.8471
- Rent YoY
- ▲ 5.07%
- Metro
- Valdosta, GA
- State GDP YoY
- ▲ 2.66%
- F500 in state
- 28
Industry mix (Fortune 500 HQ in GA)
| Industry | F500 HQs | Revenue |
|---|---|---|
| Paper / Packaging | 2 | $29B |
|
||
| Retail | 1 | $160B |
|
||
| Transportation / Logistics | 1 | $91B |
|
||
| Airlines | 1 | $62B |
|
||
| Consumer Goods | 1 | $47B |
|
||
| Utilities | 1 | $25B |
|
||
Price history
-20.0% since first listed3 events — show timeline
- 2026-06-13 Price Changed $199,900 SGMLS
- 2026-06-08 Price Changed $219,900 SGMLS
- 2026-05-11 Listed $249,900 SGMLS
Property tax history
+4.6%/yrLatest (2025): $1,249 · +5.4% YoY. Source: county tax records.
Cash-flow waterfall
monthlySold comps — $/sqft
last 12 mo · ≤1 miLoading sold comps…