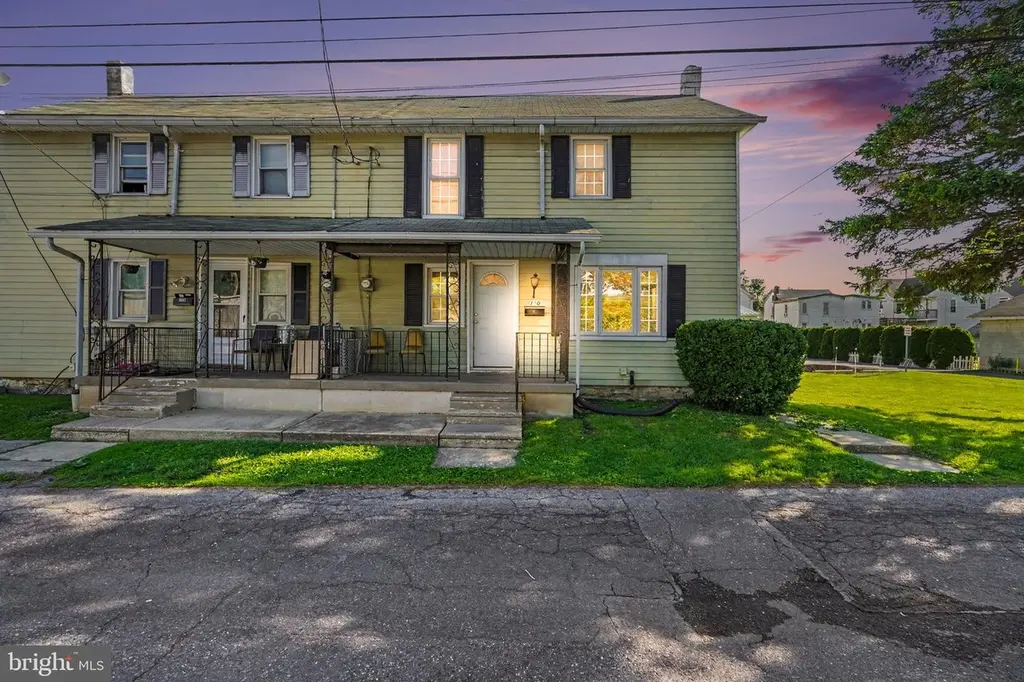
120 Lusk Ave · Highspire, PA
Flood risk 10/10 · Severe
- FEMA flood zone
- X (shaded)
- Chance of flooding over 30 yrs
- 0.99%
- Est. flood insurance / yr
- $473 – $860
Fire risk 1/10 · Minimal
- Est. fire insurance / yr
- $511 – $949
Heat risk 6/10 · Moderate
- Hot days now (above 102°F)
- 7 days/yr
- Hot days in 30 yrs
- 16 days/yr
Wind risk 3/10 · Minor
- Chance of severe wind over 30 yrs
- 6.0%
Air-quality risk 3/10 · Minor
- Unhealthy air days now
- 3 days/yr
- Unhealthy air days in 30 yrs
- 5 days/yr
Risk factors via First Street. Map © Google.
Why this score? — see what drove the D+ grade
The composite is a weighted blend of 9 inputs, each scored 0–100. Each bar is that input's sub-score; the figure is the points it added to the 100-point composite (weight × sub-score).
- Cash flow +13.7/30.0
- ARV discount +10.5/15.0
- Appreciation +5.8/10.0
- DSCR +4.2/10.0
- 1% rule +4.1/10.0
- Livability +3.2/5.0
- Rent growth +2.5/5.0
- Condition / age +2.5/5.0
- Schools +0.5/10.0
$142,000
🖨 Deal sheet (PDF) 📄 Offer letter ✓ Due diligence
Listing remarks MLS
Just right as a first home or an investment.
Key facts
- Built 1900
- Listed 39 days
Property features AI
Finance
- Other: Above-grade finished area per assessor: 1,050 (finished); Improvement and land assessed values available
- Financial info: Ownership: Fee simple
Exterior
- Parking: On-street parking
- Utilities: Public water; Electric hot water
- Home design: Semi-detached frame residence; Single entry level
- Construction: Frame construction; Block foundation; Built year per assessor
- Exterior features: Not in a federal flood zone; Above-grade and below-grade structures
Interior
- Bedrooms: 2 bedrooms on the first upper level
- Bathrooms: 1 full bathroom
- Heating & cooling: Baseboard hot water heating (oil-fired); Central air conditioning (electric)
- Interior features: Full basement
Neighborhood map
What this means for you Summary
Snapshot
- This is a 2-bed/1.0-bath townhouse listed at $142k.
Deal economics
- At list price, monthly cash flow is $-44 ($-532/yr) — negative.
- To cash-flow at today's rent, offer at most $134k (5.5% below list).
- To meet the 1% rule (rent ≥ 1% of price), the offer needs to be $130k (8.7% below list).
- Recommended offer: $130k (8.7% below list) — sets the bar for 1% rule.
- Cap rate 6.4% vs local median 4.0% in Highspire — top-decile yield for the area; either an underpriced asset or a hidden risk that comps aren't pricing in. Stress-test before assuming the spread holds.
Location & tenants
- Location reads 63/100 on livability (#1,272 in PA) — a middle-class / working-renter tenant base. Strengths: cost of living A+, housing A+; Watch: amenities F, commute F, employment D-.
- Steelton-Highspire SD (suburban): math 2% / reading 9% proficiency, ranked #538 of 539 in PA (top 100%) — low school quality limits family demand, transient renter base, plan for 1-2y turnover; 68% free/reduced lunch — lower-income household profile, screen leases tightly.
- Zoned schools: Steelton-Highspire El Sch (math 2% / reading 12%, grade F, #1,491 of 1,518 statewide, top 98%, 738 students, 100% FRL); Steelton-Highspire Hs (math 2% / reading 6%, grade F, #434 of 437 statewide, top 99%, 599 students, 100% FRL) — zoned schools average 100% FRL vs 68% district-wide (32 pts higher); higher-poverty schools than district average — tighter screening recommended.
- Market conditions: 17 active listings in the ZIP; 5 comparable units currently listed for rent nearby; rentals at typical pace (median 25d on market — plan ~3-4 weeks tenant-placement turnaround); 540 units permitted in Dauphin County in 2024 (194 in 5+ unit buildings).
Forward outlook
- In year one you build about $3k of equity ($982 loan paydown + $2k appreciation (1.5% local appreciation)).
- At projected returns (1.5% appreciation + 3.0% rent growth), your $40k cash investment doubles in ~10 years — after that, you're playing with house money.
- By year 10, paydown + projected appreciation supports a ~$31k cash-out refi (75% LTV) — recoverable capital for the next deal without selling this one.
Negotiation context
- It's been on market 39 days — a 3% lower offer ($138k) is reasonable based on typical stale-listing flexibility.
- 2 sale attempts since 17y ago; this cycle's ask has dropped $18k (11%) from the opening price — seller is motivated, your offer sets the floor, not the list.
- Current owner paid $52k; list at $142k implies a 171% gain — meaningful room to come down on a strong offer.
Risks & watch-outs
- Watch-outs: flood insurance adds $56/mo; built in 1900 — expect roof / HVAC / electrical / plumbing capex.
- Climate carrying-cost: severe flood risk; extreme-heat days projected 7→16/yr by 2055 (HVAC capex compounding) — expect insurance premiums to compound above CPI over the hold.
Questions for the listing agent
- What do current leases actually rent for vs. the listed asking? Can we see a recent rent roll and the last 12 months of T-12 income?
- It's been on market 39 days. Have you received any prior offers? Is the seller open to a 9% concession, seller financing, or rate buy-down credit?
- Built in 1900 — when were the roof, HVAC, electrical panel, plumbing, and water heater last replaced?
- What's the actual annual flood-insurance premium (NFIP or private), and is the property in a SFHA with mandatory coverage?
- Is there a deadline driving the sale (1031 exchange, divorce, estate, relocation)? That informs how much negotiation room exists.
- Schools are F-rated, which usually means shorter tenancies and higher turnover. Who's the typical renter profile here, and what's been the actual vacancy rate?
- The area grade is low — what's the realistic commute time and amenity access for the typical tenant pool here? Any planned neighborhood developments (good or bad) we should know about?
- What's the average days-on-market for RENTAL listings here right now (not sales)? A rising rental-DOM trend means longer vacancies and softer asking-rent achievability than the comps imply.
- What's the recent tenant-quality profile in this submarket — average credit score on applications, eviction rate, late-payment / NSF rate, and stable-employment percentage? A property-management company in the area should have these aggregated.
- How much new for-sale + rental construction is in the pipeline within 1–3 miles? Heavy new supply typically softens prices + rents 12–24 months out; constrained supply supports both.
Investment metrics
- 1% rule
- 0.91% ✗
- Cap rate
- 6.39%
- Cash-on-cash
- 0.34%
- DSCR
- 1.02
- GRM
- 9.1
CMA / ARV
- ARV (median comp)
- $151,992
- List price
- $142,000
- Delta
- -6.57%
- Verdict
- FAIR
- Comps
- 20 within 1.0 mi
Show comp detail 5 sales within ~0.75 mi
| Address | Dist | Beds/Ba | Sqft | Sold | Price | $/sf | Match |
|---|---|---|---|---|---|---|---|
| 109 Legion Ave | 0.08mi | 2/1.5 | 1,120 (+12%) | 18mo | $146,000 | $130 | 59 |
| 19 Race St | 0.10mi | 3/1.0 (+1) | 1,118 (+12%) | 18mo | $175,000 | $157 | 55 |
| 525 Mountain View Rd | 0.72mi | 2/1.5 | 1,024 (+2%) | 13mo | $170,000 | $166 | 50 |
| 227 Penn St | 0.20mi | 3/1.0 (+1) | 1,118 (+12%) | 22mo | $170,000 | $152 | 47 |
| 537 Mountain View Rd | 0.74mi | 2/1.5 | 1,024 (+2%) | 16mo | $167,000 | $163 | 46 |
Match score weights: distance 35% · size 25% · config 20% · recency 20%. Top-matched comps best support the ARV.
Projected returns pro-forma
1.52% appreciation · 3.0% rent growth · sell at horizon
- IRR
- 1.7%
- Equity multiple
- 1.09×
- Total profit
- $3,526
- Equity at exit
- $52,330
- IRR
- 6.0%
- Equity multiple
- 1.78×
- Total profit
- $30,954
- Equity at exit
- $72,625
Cash invested: $39,760 (down + closing). Projections, not guarantees.
Landlord ↔ Tenant lean methodology
- Overall (STATE)
- 62 Landlord-Friendly
- State Pennsylvania
- 62 Landlord-Friendly · EVEN
- County
- — inherits STATE
- City
- — inherits STATE
ZIP-level market 17034
- Home prices YoY
- 0.6%
- Active inventory
- 17
- Price-to-rent
- 9.1×
Monthly cashflow live
- Estimated rent
- $1,296 high interval (Pro) →
- Mortgage (P&I)
- −$745
- Tax from tax record
- −$209 /mo · $2,506/yr
- Insurance
- −$59
- Flood insurance flood zone
- −$56 /mo · $666/yr
- HOA
- −$0
- Vacancy / Maint / Mgmt
- −$272
- Net cashflow
- $-44
Break-even live
Sensitivity live
| Price | -10% $36 | -5% $-4 | +0% $-44 | +5% $-85 | +10% $-125 |
|---|---|---|---|---|---|
| Rent | -10% $-147 | -5% $-96 | +0% $-44 | +5% $7 | +10% $58 |
| Rate | -1.0pp $27 | -0.5pp $-8 | base $-44 | +0.5pp $-81 | +1.0pp $-119 |
UW: 25.0% down · 7.5% · 30yr · 1.5% tax · 5.0% vac · 8.0% maint · 8.0% mgmt
Financing live
Cash to close
- Down payment
- $35,500
- Closing costs
- $4,260
- Reserves months
- —
- Total cash needed
- —
Loan-product check · same deal, 3 products live
Conventional
25% down · 7.5% · 30yr
- Down + closing
- —
- Monthly P&I
- —
- Monthly cashflow
- —
- DSCR
- —
- Eligible?
- —
Personal DTI + credit; lowest rate.
DSCR
20% down · 8.5% · 30yr
- Down + closing
- —
- Monthly P&I
- —
- Monthly cashflow
- —
- DSCR
- —
- Eligible?
- —
No personal income docs; deal must DSCR.
Hard money
10% down · 12.0% · 12mo
- Down + closing
- —
- Monthly P&I
- —
- Monthly cashflow
- —
- DSCR
- —
- Eligible?
- —
Short-term bridge; refi at stabilization.
Rent comps 5 comps
| Address | Beds | Baths | Sqft | Rent | $/sqft | DOM | Units | Dist |
|---|---|---|---|---|---|---|---|---|
| 502 Eshelman St Highspire, PA | 3.0 | 1.5 | 1300 | $1,585 | $1.22 | 23d | 1 | 0.81mi |
| 599 2nd St Unit 2 Highspire, PA | 1.0 | 1.0 | 900 | $850 | $0.94 | 25d | 1 | 1.04mi |
| 625 Willow St Unit 605D *U/S Highspire, PA | 1.0 | 1.0 | 900 | $1,050 | $1.17 | 25d | 1 | 1.05mi |
| 625 Willow St Unit 610J *U/R Highspire, PA | 2.0 | 1.0 | 1008 | $1,250 | $1.24 | 25d | 1 | 1.05mi |
| 1239 Amber Ln Harrisburg, PA | 2.0–3.0 | 2.5 | 1414 | $1,930 | $1.36 | 15d | 9 | 1.23mi |
Listing history 22 events
-
2026-06-22pricedays on market $142,000 Active 39 DOM
-
2026-06-18days on market $159,900 Active 36 DOM
-
2026-06-17days on market $159,900 Active 35 DOM
-
2026-06-16days on market $159,900 Active 34 DOM
-
2026-06-15days on market $159,900 Active 33 DOM
-
2026-06-14days on market $159,900 Active 31 DOM
-
2026-06-10days on market $159,900 Active 28 DOM
-
2026-06-09days on market $159,900 Active 27 DOM
-
2026-06-08days on market $159,900 Active 26 DOM
-
2026-06-07days on market $159,900 Active 25 DOM
-
2026-06-05days on market $159,900 Active 22 DOM
-
2026-06-03days on market $159,900 Active 21 DOM
-
2026-06-02days on market $159,900 Active 20 DOM
-
2026-06-01days on market $159,900 Active 19 DOM
-
2026-05-31days on market $159,900 Active 18 DOM
-
2026-05-31days on market $159,900 Active 17 DOM
-
2026-05-14$159,900 Active 2014-char remark
-
2026-05-10historical $159,900 2014-char remark
-
2010-02-05soldstatus $52,320
-
2010-01-29soldstatus $52,320 44-char remark
Show marketing remark (44 chars)
Just right as a first home or an investment.
-
2009-12-17historical 44-char remark
Show marketing remark (44 chars)
Just right as a first home or an investment.
-
2009-06-07$54,900 44-char remark
Show marketing remark (44 chars)
Just right as a first home or an investment.
ⓘ Source: listings_history table (triggers on properties + properties_extension) + one-shot
backfill from property_details.listing_events for pre-trigger history.
Tax reassessment forecast PA · Partial reset (capped growth)
- Current annual tax
- $2,506 · $209/mo
- Projected year-2 tax
- $2,506 · $209/mo
- Expected delta
- $0/yr ($0/mo · 0.0%)
ⓘ Screening estimate from a state-policy table — verify with the county assessor before closing.
Climate risk First Street
- Flood 10/10 Extreme FEMA zone X (shaded) · 99% chance over 30 yrs
- Wildfire 1/10 Low
- Heat 6/10 Major 7 d/yr ≥102°F today · 16 d/yr by 30 yrs out
- Wind 3/10 Moderate 6% chance of damaging wind over 30 yrs
- Air quality 3/10 Moderate 3 unhealthy d/yr today · 5 by 30 yrs out
Nearby sold comps map
Loading sold comps map…
Walkable amenities ~0.75 mi
Loading nearby amenities…
Taxation est. · year 1
- Rental income
- $15,553
- − Mortgage interest
- −$7,954
- − Property taxes
- −$2,506
- − Insurance
- −$1,376
- − Repairs & maintenance
- −$1,244
- − Management
- −$1,244
- − Depreciation
- −$4,131
- Taxable loss
- −$2,904
- Est. tax savings @ 24.0%
- +$697
- After-tax cash flow
- $165/yr
For passive investors: Depreciation is non-cash, so a rental often shows a tax loss while cash-flowing — sheltering income. Rental losses are passive: they offset passive income freely, and up to $25,000/yr can offset ordinary (W-2) income if you actively participate and your MAGI is under $100k (phasing out to $0 by $150k); unused losses carry forward. On sale, claimed depreciation is recaptured at up to 25%, and gains may owe capital-gains tax (a 1031 exchange can defer both). Figures are a year-1 estimate at your 24.0% rate — not tax advice; consult a CPA.
Schools (NCES district)
- District
- Steelton-Highspire SD
- NCES district ID
- 4222800
- Math proficiency
- 2% ▼ -4.00%
- Reading proficiency
- 9% ▼ -12.00%
- Median HH income
- $40,685
- Composite
- 4.98/100
- National rank
- #10040
- State rank
- #538 of 539 in PA
Livability — Highspire
- Score
- 63/100
- State rank
- #1272
- US rank
- #15383
Category grades
Schools grade is shown separately in the Schools card above.
Census & demographics
- Census place
- Highspire, PA
- City population
- 2,988
- Population (ZIP)
- 2,988
Population outlook (Dauphin County) Hauer SSP2
- Today (2025)
- 281,628 people
- By 2030
- 283,549 · +0.7%
- By 2040
- 285,385 · +1.3%
- By 2050
- 286,188 · +1.6%
- By 2075
- 291,053 · +3.3%
- By 2100
- 282,374 · +0.3%
Race, ethnicity, and origin ACS 2023
- Neighborhood character
- Predominantly White (66%)
- Race & ethnicity
- White 66% Black 16% Hispanic / Latino 14% Two or more races 10%
- Hispanic origin (detail)
- Mexican 1% Puerto Rican 5% Cuban 7%
- Common ancestry
- Polish 2% Lithuanian 1% Italian 1%
- Foreign-born
- 4% · Canada
- Languages at home
- 91% English-only · Spanish 6% Russian/Polish/Slavic 1% Other Asian/Pacific 1%
Political lean MEDSL · Dauphin
- 2024 margin
- Lean D (+5.9) · D 52.4% · R 46.5% · Other 1.1%
- 2008→2024 swing
- -3.1pp toward R · 2008: 9.1pp · 2024: 5.9pp
- All cycles
- 2024: D+5.9 2020: D+8.5 2016: D+2.8 2012: D+6.0 2008: D+9.1
Not yet ingested
- Civics
- —
Market trends
- HPI YoY
- ▲ 1.52%
- Current HPI
- 266.3558
- Rent YoY
- —
- Metro
- —
- State GDP YoY
- ▲ 1.68%
- F500 in state
- 34
Industry mix (Fortune 500 HQ in PA)
| Industry | F500 HQs | Revenue |
|---|---|---|
| Healthcare | 2 | $309B |
|
||
| Insurance | 2 | $27B |
|
||
| Telecommunications / Media | 1 | $124B |
|
||
| Industrial Distribution | 1 | $22B |
|
||
| Financial Services | 1 | $20B |
|
||
| Chemicals / Materials | 1 | $18B |
|
||
Price history
+191.3% since first listed6 events — show timeline
- 2026-05-14 Listed $159,900 BRIGHT MLS
- 2026-05-10 Coming Soon $159,900 BRIGHT MLS
- 2010-02-05 Sold (Public Records) $52,320 Public Records
- 2010-01-29 Sold (MLS) $52,320 BRIGHT MLS
- 2009-12-17 Listing Removed — BRIGHT MLS
- 2009-06-07 Listed $54,900 BRIGHT MLS
Property tax history
+1.5%/yrLatest (2026): $2,506 · +4.0% YoY. Source: county tax records.
Cash-flow waterfall
monthlySold comps — $/sqft
last 12 mo · ≤1 miLoading sold comps…