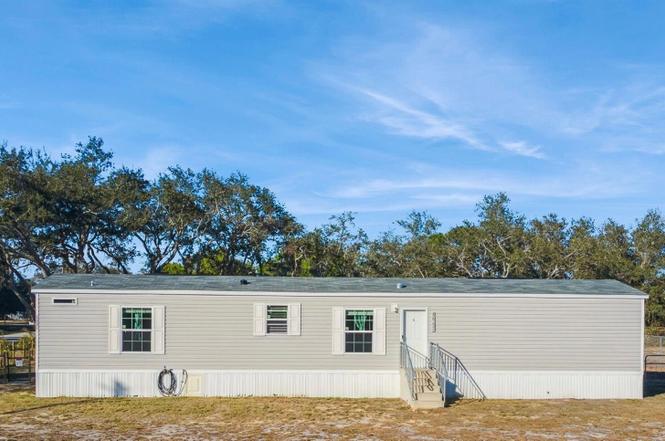
3001 Holiday Beach Dr · Avon Park, FL
Flood risk 1/10 · Minimal
- FEMA flood zone
- X (unshaded)
- Chance of flooding over 30 yrs
- 0.0%
- Est. flood insurance / yr
- $507 – $1,088
Fire risk 5/10 · Moderate
- Est. fire insurance / yr
- $947 – $1,759
Heat risk 8/10 · Major
- Hot days now (above 108°F)
- 7 days/yr
- Hot days in 30 yrs
- 24 days/yr
Wind risk 9/10 · Severe
- Chance of severe wind over 30 yrs
- 99.0%
Air-quality risk 2/10 · Minimal
- Unhealthy air days now
- 2 days/yr
- Unhealthy air days in 30 yrs
- 2 days/yr
Risk factors via First Street. Map © Google.
Why this score? — see what drove the D grade
The composite is a weighted blend of 9 inputs, each scored 0–100. Each bar is that input's sub-score; the figure is the points it added to the 100-point composite (weight × sub-score).
- Cash flow +13.5/30.0
- ARV discount +7.5/15.0
- DSCR +4.1/10.0
- Schools +3.6/10.0
- Livability +3.6/5.0
- 1% rule +2.9/10.0
- Rent growth +2.5/5.0
- Condition / age +2.5/5.0
- Appreciation +0.0/10.0
$175,000
🖨 Deal sheet (PDF) 📄 Offer letter ✓ Due diligence
Listing remarks
SELLER MOTIVATED BRING ALL OFFERS! WELCOME TO YOUR DREAM GETAWAY! Nestled in the SERENE HEART of Central Florida, this BETTER-THAN-NEW HOME sits on nearly HALF AN ACRE with ACCESS TO LITTLE RED WATER LAKE—perfect for enjoying peace and privacy under the stars. Built to WIND ZONE THREE standards, this home offers SAFETY AND SECURITY while still providing the comfort and charm of a private retreat. Inside, you’ll find VINYL FLOORING throughout, DOUBLE-PANE WINDOWS that let in abundant natural light, and an open, functional layout. The property is supported by a 175’ WELL with an 80-GALLON PRESSURE TANK and SUBMERGED PUMP, plus a MODERN AERATED septic system installed
Key facts
- Vinyl flooring
- 175 well
- Submerged pump
Tags
Property features AI
Finance
- Other: Homestead exempt; Cleared lot with trees/landscaping; Lot dimensions approximately 110 x 175 (0.44 acres); Asphalt road frontage; Lake view and lake access; One well and one septic; Unfurnished
- HOA & community: Not in development; No association
Exterior
- Parking: Boat parking; Covered parking; Driveway; On-street parking; Oversized parking; RV access/parking; Carport with 2 spaces
- Utilities: Well water; Septic tank; Broadband/high-speed internet available; Cable available; Electricity connected; Sewer connected; Water connected
- Home design: Modular home; One story; Facing south; Residential property
- Construction: Vinyl siding; Shingle roof; Crawlspace foundation; Built as modular home
- Exterior features: Private mailbox; Storage; Gazebo; Shed(s)
Interior
- Kitchen: Dishwasher; Disposal; Freezer; Ice maker; Microwave; Range; Refrigerator; Water filtration system; Exhaust fan; Electric water heater
- Bedrooms: 3 bedrooms
- Bathrooms: 2 full bathrooms
- Heating & cooling: Central heating; Central air
- Interior features: Thermostat; Walk-in closet(s); Double pane windows; Fire alarm
- Laundry & utility: Washer; Dryer; Laundry room
Neighborhood map
What this means for you Summary
Snapshot
- This is a 3-bed/2.0-bath manufactured listed at $175k.
Deal economics
- At list price, monthly cash flow is $7 ($88/yr) — positive.
- The deal already cash-flows at list — no discount required.
- To meet the 1% rule (rent ≥ 1% of price), the offer needs to be $138k (21.2% below list).
- Recommended offer: $138k (21.2% below list) — sets the bar for 1% rule.
- Cap rate 6.3% vs local median 3.8% in Avon Park — top-decile yield for the area; either an underpriced asset or a hidden risk that comps aren't pricing in. Stress-test before assuming the spread holds.
Location & tenants
- Location reads 71/100 on livability (#407 in FL) — a middle-class / working-renter tenant base. Strengths: cost of living A+, housing A+, health & safety A+; Watch: crime D+, amenities F, commute F.
- Highlands (other): math 45% / reading 43% proficiency, ranked #54 of 73 in FL (top 74%) — families likely to look elsewhere, expect single-tenant / working-renter base with shorter leases; 68% free/reduced lunch — lower-income household profile, screen leases tightly.
- Zoned schools: Hill-Gustat Middle School (math 53% / reading 50%, grade C, #232 of 571 statewide, top 41%, 705 students, 63% FRL); Avon Park High School (math 35% / reading 39%, grade F, #340 of 667 statewide, top 52%, 928 students, 67% FRL) — zoned schools at 65% FRL track the district average.
- Market conditions: 478 active listings in the ZIP; 980 units permitted in Highlands County in 2024 (80 in 5+ unit buildings).
- This rent runs 35% of the median local income ($47k/yr) — at the standard rent-burdened threshold; future hikes will face affordability resistance.
Forward outlook
- Local home prices are declining (-3.0%/yr); year-one equity from $1k of loan paydown is wiped out by about $5k of value loss. Plan a longer hold.
Negotiation context
- It's been on market 149 days — a 12% lower offer ($154k) is reasonable based on typical stale-listing flexibility.
- 4 sale attempts since 3y ago; this cycle's ask has dropped $90k (34%) from the opening price — seller is motivated, your offer sets the floor, not the list.
- Current owner paid $18k; list at $175k implies a 846% gain — meaningful room to come down on a strong offer.
Risks & watch-outs
- Climate carrying-cost: severe wind risk, 99% chance of damaging wind over 30y; moderate wildfire risk; extreme-heat days projected 7→24/yr by 2055 (HVAC capex compounding) — expect insurance premiums to compound above CPI over the hold.
Questions for the listing agent
- It's been on market 149 days. Have you received any prior offers? Is the seller open to a 21% concession, seller financing, or rate buy-down credit?
- Why hasn't it sold? Are there any deal-killer items the seller is aware of (foundation, flood, title, zoning, code violations)?
- Is there a deadline driving the sale (1031 exchange, divorce, estate, relocation)? That informs how much negotiation room exists.
- Schools are F-rated, which usually means shorter tenancies and higher turnover. Who's the typical renter profile here, and what's been the actual vacancy rate?
- Crime grade is D in this area — have there been break-ins, vandalism, or insurance claims at this property in the last 3 years? What carrier currently insures it and at what premium?
- The area grade is low — what's the realistic commute time and amenity access for the typical tenant pool here? Any planned neighborhood developments (good or bad) we should know about?
- What's the average days-on-market for RENTAL listings here right now (not sales)? A rising rental-DOM trend means longer vacancies and softer asking-rent achievability than the comps imply.
- What's the recent tenant-quality profile in this submarket — average credit score on applications, eviction rate, late-payment / NSF rate, and stable-employment percentage? A property-management company in the area should have these aggregated.
- How much new for-sale + rental construction is in the pipeline within 1–3 miles? Heavy new supply typically softens prices + rents 12–24 months out; constrained supply supports both.
Investment metrics
- 1% rule
- 0.79% ✗
- Cap rate
- 6.34%
- Cash-on-cash
- 0.18%
- DSCR
- 1.01
- GRM
- 10.6
CMA / ARV
No comps found within radius.
Projected returns pro-forma
-3.0% appreciation · 3.0% rent growth · sell at horizon
- IRR
- -16.1%
- Equity multiple
- 0.43×
- Total profit
- $-27,946
- Equity at exit
- $26,093
- IRR
- -7.8%
- Equity multiple
- 0.51×
- Total profit
- $-23,966
- Equity at exit
- $15,131
Cash invested: $49,000 (down + closing). Projections, not guarantees.
Landlord ↔ Tenant lean methodology
- Overall (STATE)
- 87 Strongly Landlord-Friendly
- State Florida
- 87 Strongly Landlord-Friendly · R+3
- County
- — inherits STATE
- City
- — inherits STATE
ZIP-level market 33825
- Home prices YoY
- -25.9%
- Active inventory
- 478
- Price-to-rent
- 10.6×
Monthly cashflow live
- Estimated rent
- $1,378 medium interval (Pro) →
- Mortgage (P&I)
- −$918
- Tax from tax record
- −$91 /mo · $1,090/yr
- Insurance
- −$73
- HOA
- −$0
- Vacancy / Maint / Mgmt
- −$289
- Net cashflow
- $7
Break-even live
Sensitivity live
| Price | -10% $106 | -5% $57 | +0% $7 | +5% $-42 | +10% $-92 |
|---|---|---|---|---|---|
| Rent | -10% $-102 | -5% $-47 | +0% $7 | +5% $62 | +10% $116 |
| Rate | -1.0pp $95 | -0.5pp $52 | base $7 | +0.5pp $-38 | +1.0pp $-84 |
UW: 25.0% down · 7.5% · 30yr · 1.5% tax · 5.0% vac · 8.0% maint · 8.0% mgmt
Financing live
Cash to close
- Down payment
- $43,750
- Closing costs
- $5,250
- Reserves months
- —
- Total cash needed
- —
Loan-product check · same deal, 3 products live
Conventional
25% down · 7.5% · 30yr
- Down + closing
- —
- Monthly P&I
- —
- Monthly cashflow
- —
- DSCR
- —
- Eligible?
- —
Personal DTI + credit; lowest rate.
DSCR
20% down · 8.5% · 30yr
- Down + closing
- —
- Monthly P&I
- —
- Monthly cashflow
- —
- DSCR
- —
- Eligible?
- —
No personal income docs; deal must DSCR.
Hard money
10% down · 12.0% · 12mo
- Down + closing
- —
- Monthly P&I
- —
- Monthly cashflow
- —
- DSCR
- —
- Eligible?
- —
Short-term bridge; refi at stabilization.
Listing history 37 events
-
2026-06-21days on market $175,000 Active 149 DOM
-
2026-06-19days on market $175,000 Active 147 DOM
-
2026-06-18days on market $175,000 Active 146 DOM
-
2026-06-17days on market $175,000 Active 145 DOM
-
2026-06-16days on market $175,000 Active 144 DOM
-
2026-06-15price $175,000 Active 143 DOM
-
2026-06-15days on market $180,000 Active 143 DOM
-
2026-06-14days on market $180,000 Active 141 DOM
-
2026-06-10days on market $180,000 Active 138 DOM
-
2026-06-09days on market $180,000 Active 137 DOM
-
2026-06-08days on market $180,000 Active 136 DOM
-
2026-06-07days on market $180,000 Active 135 DOM
-
2026-06-02days on market $180,000 Active 130 DOM
-
2026-06-01days on market $180,000 Active 129 DOM
-
2026-06-01remarks 681-char remark
-
2026-05-31days on market $180,000 Active 128 DOM
-
2026-05-30days on market $180,000 Active 127 DOM
-
2026-05-18price $180,000
-
2026-05-06price $195,000
-
2026-04-23price $200,000
-
2026-04-15price $210,000
-
2026-03-20price $220,000
-
2026-03-09price $230,000
-
2026-02-24price $245,000
-
2026-02-11price $259,000
-
2026-01-23$265,000 Active
-
2024-01-22soldstatus $18,500
-
2024-01-02status Pending
-
2023-12-31historical
-
2023-12-05$19,995 Active
-
2023-12-01soldstatus $8,100
-
2023-06-05status Pending
-
2023-06-02historical
-
2023-05-24price $20,900
-
2023-05-18status Active
-
2023-04-27status Pending
-
2023-04-12$21,900 Active
ⓘ Source: listings_history table (triggers on properties + properties_extension) + one-shot
backfill from property_details.listing_events for pre-trigger history.
Tax reassessment forecast FL · Resets to sale price
- Current annual tax
- $1,090 · $91/mo
- Projected year-2 tax
- $1,452 · $121/mo
- Expected delta
- +$362/yr (+$30/mo · 33.2%)
ⓘ Screening estimate from a state-policy table — verify with the county assessor before closing.
Climate risk First Street
- Flood 1/10 Low FEMA zone X (unshaded) · 0% chance over 30 yrs
- Wildfire 5/10 Major
- Heat 8/10 Severe 7 d/yr ≥108°F today · 24 d/yr by 30 yrs out
- Wind 9/10 Extreme 99% chance of damaging wind over 30 yrs
- Air quality 2/10 Low 2 unhealthy d/yr today · 2 by 30 yrs out
Nearby sold comps map
Loading sold comps map…
Walkable amenities ~0.75 mi
Loading nearby amenities…
Taxation est. · year 1
- Rental income
- $16,540
- − Mortgage interest
- −$9,803
- − Property taxes
- −$1,090
- − Insurance
- −$875
- − Repairs & maintenance
- −$1,323
- − Management
- −$1,323
- − Depreciation
- −$5,091
- Taxable loss
- −$2,966
- Est. tax savings @ 24.0%
- +$712
- After-tax cash flow
- $800/yr
For passive investors: Depreciation is non-cash, so a rental often shows a tax loss while cash-flowing — sheltering income. Rental losses are passive: they offset passive income freely, and up to $25,000/yr can offset ordinary (W-2) income if you actively participate and your MAGI is under $100k (phasing out to $0 by $150k); unused losses carry forward. On sale, claimed depreciation is recaptured at up to 25%, and gains may owe capital-gains tax (a 1031 exchange can defer both). Figures are a year-1 estimate at your 24.0% rate — not tax advice; consult a CPA.
Schools (NCES district)
- District
- Highlands
- NCES district ID
- 1200840
- Math proficiency
- 45% ▼ -7.00%
- Reading proficiency
- 43% ▼ -3.00%
- Median HH income
- $35,276
- Composite
- 36.42/100
- National rank
- #4672
- State rank
- #54 of 73 in FL
Livability — Avon Park
- Score
- 71/100
- State rank
- #407
- US rank
- #7205
Category grades
Schools grade is shown separately in the Schools card above.
Census & demographics
- County
- Highlands County · 98,898 people
- City population
- 25,501
- Metro
- Sebring-Avon Park, FL
- Population (ZIP)
- 25,501
- Household income
- $46,949
- Rent vs Own
- Severe rent burden
- 691.0
Population outlook (Highlands County) Hauer SSP2
- Today (2025)
- 99,674 people
- By 2030
- 99,615 · -0.1%
- By 2040
- 99,342 · -0.3%
- By 2050
- 98,242 · -1.4%
- By 2075
- 93,291 · -6.4%
- By 2100
- 79,894 · -19.8%
Race, ethnicity, and origin ACS 2023
- Neighborhood character
- Diverse neighborhood (Simpson 0.64)
- Race & ethnicity
- White 51% Hispanic / Latino 27% Black 17% Two or more races 11% Asian 1%
- Hispanic origin (detail)
- Mexican 8% Puerto Rican 13% Cuban 2%
- Common ancestry
- Slovak 2% Lithuanian 2% Iranian 1%
- Foreign-born
- 10% · Canada, Vietnam, Guatemala
- Languages at home
- 74% English-only · Spanish 24% Tagalog/Filipino 1%
Political lean MEDSL · Highlands
- 2024 margin
- Solid R (+40.8) · D 29.3% · R 70.1%
- 2008→2024 swing
- -22.7pp toward R · 2008: -18.1pp · 2024: -40.8pp
- All cycles
- 2024: R+40.8 2020: R+34.4 2016: R+32.0 2012: R+23.0 2008: R+18.1
Not yet ingested
- Civics
- —
Market trends
- HPI YoY
- ▼ -98.54%
- Current HPI
- 281.8067
- Rent YoY
- —
- Metro
- Sebring-Avon Park, FL
- State GDP YoY
- ▲ 3.28%
- F500 in state
- 36
Industry mix (Fortune 500 HQ in FL)
| Industry | F500 HQs | Revenue |
|---|---|---|
| Industrial Technology | 2 | $29B |
|
||
| Insurance | 2 | $17B |
|
||
| Retail | 1 | $60B |
|
||
| Technology Distribution | 1 | $58B |
|
||
| Homebuilding | 1 | $35B |
|
||
| Technology Manufacturing | 1 | $35B |
|
||
Price history
+721.9% since first listed20 events — show timeline
- 2026-05-18 Price Changed $180,000 Stellar MLS as Distributed by MLS Grid
- 2026-05-06 Price Changed $195,000 Stellar MLS as Distributed by MLS Grid
- 2026-04-23 Price Changed $200,000 Stellar MLS as Distributed by MLS Grid
- 2026-04-15 Price Changed $210,000 Stellar MLS as Distributed by MLS Grid
- 2026-03-20 Price Changed $220,000 Stellar MLS as Distributed by MLS Grid
- 2026-03-09 Price Changed $230,000 Stellar MLS as Distributed by MLS Grid
- 2026-02-24 Price Changed $245,000 Stellar MLS as Distributed by MLS Grid
- 2026-02-11 Price Changed $259,000 Stellar MLS as Distributed by MLS Grid
- 2026-01-23 Listed $265,000 Stellar MLS as Distributed by MLS Grid
- 2024-01-22 Sold (Public Records) $18,500 Public Records
- 2024-01-02 Pending — Stellar MLS as Distributed by MLS Grid
- 2023-12-31 Listing Removed — Stellar MLS as Distributed by MLS Grid
- 2023-12-05 Listed $19,995 Stellar MLS as Distributed by MLS Grid
- 2023-12-01 Sold (Public Records) $8,100 Public Records
- 2023-06-05 Pending — Stellar MLS as Distributed by MLS Grid
- 2023-06-02 Listing Removed — Stellar MLS as Distributed by MLS Grid
- 2023-05-24 Price Changed $20,900 Stellar MLS as Distributed by MLS Grid
- 2023-05-18 Relisted — Stellar MLS as Distributed by MLS Grid
- 2023-04-27 Pending — Stellar MLS as Distributed by MLS Grid
- 2023-04-12 Listed $21,900 Stellar MLS as Distributed by MLS Grid
Property tax history
+21.9%/yrLatest (2025): $1,090 · +125.8% YoY. Source: county tax records.
Cash-flow waterfall
monthlySold comps — $/sqft
last 12 mo · ≤1 miLoading sold comps…