 6-Plex
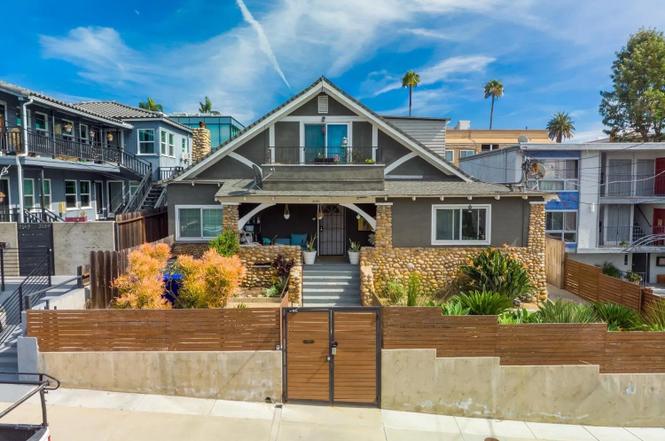
2141 Front St · San Diego, CA
Flood risk 1/10 · Minimal
- FEMA flood zone
- X (unshaded)
- Chance of flooding over 30 yrs
- 0.0%
- Est. flood insurance / yr
- $507 – $1,088
Fire risk 1/10 · Minimal
- Est. fire insurance / yr
- $659 – $1,223
Heat risk 4/10 · Minor
- Hot days now (above 84°F)
- 7 days/yr
- Hot days in 30 yrs
- 20 days/yr
Wind risk 1/10 · Minimal
- Chance of severe wind over 30 yrs
- —
Air-quality risk 4/10 · Minor
- Unhealthy air days now
- 4 days/yr
- Unhealthy air days in 30 yrs
- 4 days/yr
Risk factors via First Street. Map © Google.
Why this score? — see what drove the C- grade
The composite is a weighted blend of 9 inputs, each scored 0–100. Each bar is that input's sub-score; the figure is the points it added to the 100-point composite (weight × sub-score).
- Cash flow +19.5/30.0
- ARV discount +7.5/15.0
- DSCR +6.2/10.0
- 1% rule +4.7/10.0
- Appreciation +4.1/10.0
- Livability +3.8/5.0
- Rent growth +2.6/5.0
- Condition / age +2.5/5.0
- Schools +2.2/10.0
$2,100,000
🖨 Deal sheet 📄 Offer letter ✓ Due diligence
Multi-family units
County records classify this as Multi-Family (5+ Unit). Listing-text estimate: 6 units. confirmed
5+ unit building — per-unit beds/baths from public records are typically unavailable; the breakdown below (if shown) is an estimate from the listing text.
Listing remarks MLS
This is the only Value-Add property in Bankers Hills offered at a 5 CAP on actuals. Appraised for $1.6M 5/6/2020 - (4) of the (6) units have been renovated turn-key which leaves room for the investor to increase the cap rate to the mid 5's upon renovating the (2) units. 100% OCCUPIED, with the option to maximize your returns as a vacation rental or corporate housing. UNIT MIX TWO 2BD/1BT UNITS + 4 STUDIOS!! BAY VIEWS, NEW LANDSCAPING, NEW STAINLESS STEEL APPLIANCES, AC/HEATING UNITS, CEILING FANS, NEW WINDOWS, NEW FLOORING, NEW OWNED LAUNDRY, GATED ENTRY, SECURE, AND MUCH MORE!! Walking distance to Little Italy and Mission Hills which offers some of the best dining & entertainment in the city! Easy access to transit and freeways. 5000sqft lot. NOI $74,746 - Current Gross Rents - $9,680 per month!
Key facts
- Secure fenced entry
- Recently renovated
- Functional layouts
Tags
Property features AI
Finance
- Other: Listing broker: Apartment Realty Group (ARG); Listing agent: Jordan Concepcion
Exterior
- Home design: Residential income property (commercial-residential income subtype)
- Construction: 3, >2,700 total building size
- Exterior features: Partial fencing; Composition roof
Interior
- Bathrooms: Six full bathrooms
- Heating & cooling: Wall/Window cooling units
- Interior features: Wall/window air conditioning units
Neighborhood map
What this means for you Summary
Snapshot
- This is a 6 × 4-bed/6.0-bath units multifamily listed at $2.10M.
Deal economics
- At list price, monthly cash flow is $2k ($29k/yr) — positive. Per door: $396/mo.
- The deal already cash-flows at list — no discount required.
- To meet the 1% rule (rent ≥ 1% of price), the offer needs to be $2.03M (3.3% below list).
- Recommended offer: $1.91M (9.0% below list) — sets the bar for market timing.
- Cap rate 7.7% vs local median 2.0% in San Diego — top-decile yield for the area; either an underpriced asset or a hidden risk that comps aren't pricing in. Stress-test before assuming the spread holds.
Location & tenants
- Location reads 75/100 on livability (#123 in CA, #4,206 nationally) — a middle-class / working-renter tenant base. Strengths: amenities A+, commute A+, employment A+; Watch: health & safety C-, crime D+, cost of living F.
- San Diego Unified (urban): math 19% / reading 29% proficiency, ranked #393 of 517 in CA (top 76%) — low school quality limits family demand, transient renter base, plan for 1-2y turnover.
- Market conditions: Rents flat; 515 active listings in the ZIP; 11 comparable units currently listed for rent nearby; rentals leasing fast (median 2d on market — plan ~1-2 weeks tenant-placement turnaround); solid renter incomes; 11,759 units permitted in San Diego County in 2024 (7,244 in 5+ unit buildings).
- At $20,302/mo this rent would consume 266% of the median local household income ($92k/yr) (locally 5603% of renters already pay >50% of income on rent) — very limited rent-growth headroom before tenants either downsize or default.
Forward outlook
- Local home prices are declining (-1.8%/yr); year-one equity from $15k of loan paydown is wiped out by about $38k of value loss. Plan a longer hold.
- San Diego County population projected at +20% by 2050 — long-run rental-demand tailwind backs the buy-and-hold thesis.
Negotiation context
- It's been on market 106 days — a 9% lower offer ($1.91M) is reasonable based on typical stale-listing flexibility.
- 4 sale attempts since 6y ago with the ask held roughly flat each time — persistent listings suggest the price (not the market) is what's stuck; bring a comps-based counter.
- Current owner paid $1.44M; 46% above their basis — modest negotiation headroom, anchor on the comps not their cost.
Questions for the listing agent
- It's been on market 106 days. Have you received any prior offers? Is the seller open to a 9% concession, seller financing, or rate buy-down credit?
- Can we see the unit-by-unit rent roll, current vacancy, and any below-market leases? What's the average tenancy length?
- What capital expenditures (roof, boiler, parking lot, exteriors) have been made in the last 5 years, and what's planned in the next 2?
- Why hasn't it sold? Are there any deal-killer items the seller is aware of (foundation, flood, title, zoning, code violations)?
- Is there a deadline driving the sale (1031 exchange, divorce, estate, relocation)? That informs how much negotiation room exists.
- Schools are B-rated — typically a magnet for longer-tenancy family renters. What's the average tenant stay here, and is there a school-zone premium baked into asking?
- Crime grade is D in this area — have there been break-ins, vandalism, or insurance claims at this property in the last 3 years? What carrier currently insures it and at what premium?
- What's the average days-on-market for RENTAL listings here right now (not sales)? A rising rental-DOM trend means longer vacancies and softer asking-rent achievability than the comps imply.
- What's the recent tenant-quality profile in this submarket — average credit score on applications, eviction rate, late-payment / NSF rate, and stable-employment percentage? A property-management company in the area should have these aggregated.
- How much new apartment / multifamily construction is in the pipeline within 1–3 miles? Heavy new supply (>2% of stock underway) typically softens rents 12–24 months out; light construction supports rent growth.
Investment metrics
- 1% rule
- 0.97% ✗
- Cap rate
- 7.65%
- Cash-on-cash
- 4.85%
- DSCR
- 1.22
- GRM
- 8.6
CMA / ARV
- ARV (on-the-fly)
- $1,087,383
- Comps found
- 2
Show comp detail 2 sales within ~0.75 mi
| Address | Dist | Beds/Ba | Sqft | Sold | Price | $/sf | Match |
|---|---|---|---|---|---|---|---|
| 2311 State St | 0.25mi | 4/2.0 | 2,339 (-15%) | 8mo | $900,000 | $385 | 41 |
| 2442 State St | 0.34mi | 4/2.0 | 3,147 (+15%) | 23mo | $1,250,000 | $397 | 24 |
Match score weights: distance 35% · size 25% · config 20% · recency 20%. Top-matched comps best support the ARV.
Projected returns pro-forma
-1.82% appreciation · 0.35% rent growth · sell at horizon
- IRR
- -5.8%
- Equity multiple
- 0.77×
- Total profit
- $-135,838
- Equity at exit
- $425,955
- IRR
- -0.8%
- Equity multiple
- 0.94×
- Total profit
- $-34,008
- Equity at exit
- $381,428
Cash invested: $588,000 (down + closing). Projections, not guarantees.
Landlord ↔ Tenant lean methodology
- Overall (STATE)
- 18 Strongly Tenant-Friendly
- State California
- 18 Strongly Tenant-Friendly · D+13
- County
- — inherits STATE
- City
- — inherits STATE
ZIP-level market 92101
- Home prices YoY
- -0.8%
- Rents YoY
- 0.3%
- Active inventory
- 515
- Price-to-rent
- 51.7×
Monthly cashflow live
- Estimated rent
- $20,302 medium interval (Pro) →
- Mortgage (P&I)
- −$11,013
- Tax from tax record
- −$1,775 /mo · $21,298/yr
- Insurance
- −$875
- HOA
- −$0
- Vacancy / Maint / Mgmt
- −$4,263
- Net cashflow
- $2,376
Break-even live
6-unit breakdown (identical units grouped — click to expand)
| Units | Beds | Baths | Est. rent |
|---|---|---|---|
| 6× units | 4 | 6 | $20,304 |
| #1 | 4 | 6 | $3,384 |
| #2 | 4 | 6 | $3,384 |
| #3 | 4 | 6 | $3,384 |
| #4 | 4 | 6 | $3,384 |
| #5 | 4 | 6 | $3,384 |
| #6 | 4 | 6 | $3,384 |
| Total (6 units) | $20,302 | ||
UW: 25.0% down · 7.5% · 30yr · 1.5% tax · 5.0% vac · 8.0% maint · 8.0% mgmt
Financing live
Cash to close
- Down payment
- $525,000
- Closing costs
- $63,000
- Reserves months
- —
- Total cash needed
- —
Loan-product check · same deal, 3 products live
Conventional
25% down · 7.5% · 30yr
- Down + closing
- —
- Monthly P&I
- —
- Monthly cashflow
- —
- DSCR
- —
- Eligible?
- —
Personal DTI + credit; lowest rate.
DSCR
20% down · 8.5% · 30yr
- Down + closing
- —
- Monthly P&I
- —
- Monthly cashflow
- —
- DSCR
- —
- Eligible?
- —
No personal income docs; deal must DSCR.
Hard money
10% down · 12.0% · 12mo
- Down + closing
- —
- Monthly P&I
- —
- Monthly cashflow
- —
- DSCR
- —
- Eligible?
- —
Short-term bridge; refi at stabilization.
Rent comps 11 comps
| Address | Beds | Baths | Sqft | Rent | $/sqft | DOM | Units | Dist |
|---|---|---|---|---|---|---|---|---|
| 750 W Fir St San Diego, CA | 4.0 | 1.0–4.0 | 4775 | $14,995 | $3.14 | 1d | 4 | 0.34mi |
| 1331 Columbia St San Diego, CA | 3.0 | 1.0–3.0 | 1245 | $15,451 | $12.41 | 3d | 25 | 0.60mi |
| 1200 Front St San Diego, CA | 3.0 | 1.0–3.0 | 1401 | $13,988 | $9.98 | 1d | 309 | 0.69mi |
| 1011 Union St San Diego, CA | 3.0 | 1.0–2.5 | 1496 | $14,566 | $9.73 | 1d | 27 | 0.80mi |
| 504 Thorn St San Diego, CA | 5.0 | 1.0–4.0 | 2255 | $7,997 | $3.55 | 2d | 5 | 0.87mi |
| 800 Broadway San Diego, CA | 3.0 | 1.0–2.5 | 1125 | $12,060 | $10.72 | 1d | 84 | 0.95mi |
| 706 Kettner Blvd San Diego, CA | 3.0 | 2.5 | 1870 | $5,895 | $3.15 | 24d | 1 | 1.05mi |
| 645 Front St #101 San Diego, CA | 3.0 | 3.0 | 2500 | $7,495 | $3.00 | 24d | 1 | 1.09mi |
| 725 Pennsylvania Ave San Diego, CA | 4.0 | 2.5 | 1900 | $14,900 | $7.84 | 24d | 1 | 1.23mi |
| 601 11th Ave San Diego, CA | 3.0 | 1.0–3.5 | 1867 | $16,051 | $8.60 | 1d | 38 | 1.24mi |
| 1208 24th St San Diego, CA | 4.0 | 2.0 | 2400 | $7,000 | $2.92 | 24d | 1 | 1.46mi |
Listing history 21 events
-
2026-06-18days on market $2,100,000 Active 106 DOM
-
2026-06-17days on market $2,100,000 Active 105 DOM
-
2026-06-16days on market $2,100,000 Active 104 DOM
-
2026-06-15days on market $2,100,000 Active 103 DOM
-
2026-06-13days on market $2,100,000 Active 101 DOM
-
2026-06-09days on market $2,100,000 Active 97 DOM
-
2026-06-08days on market $2,100,000 Active 96 DOM
-
2026-06-07days on market $2,100,000 Active 95 DOM
-
2026-06-04days on market $2,100,000 Active 92 DOM
-
2026-06-03days on market $2,100,000 Active 91 DOM
-
2026-06-02days on market $2,100,000 Active 90 DOM
-
2026-06-01days on market $2,100,000 Active 89 DOM
-
2026-05-31days on market $2,100,000 Active 88 DOM
-
2026-03-04$2,100,000 Active
-
2020-07-30soldstatus $1,440,000 814-char remark
Show marketing remark (814 chars)
This is the only Value-Add property in Bankers Hills offered at a 5 CAP on actuals. Appraised for $1.6M 5/6/2020 - (4) of the (6) units have been renovated turn-key which leaves room for the investor to increase the cap rate to the mid 5's upon renovating the (2) units. 100% OCCUPIED, with the option to maximize your returns as a vacation rental or corporate housing. UNIT MIX TWO 2BD/1BT UNITS + 4 STUDIOS!! BAY VIEWS, NEW LANDSCAPING, NEW STAINLESS STEEL APPLIANCES, AC/HEATING UNITS, CEILING FANS, NEW WINDOWS, NEW FLOORING, NEW OWNED LAUNDRY, GATED ENTRY, SECURE, AND MUCH MORE!! Walking distance to Little Italy and Mission Hills which offers some of the best dining & entertainment in the city! Easy access to transit and freeways. 5000sqft lot. NOI $74,746 - Current Gross Rents - $9,680 per month!
-
2020-05-05$1,295,000 814-char remark
Show marketing remark (814 chars)
This is the only Value-Add property in Bankers Hills offered at a 5 CAP on actuals. Appraised for $1.6M 5/6/2020 - (4) of the (6) units have been renovated turn-key which leaves room for the investor to increase the cap rate to the mid 5's upon renovating the (2) units. 100% OCCUPIED, with the option to maximize your returns as a vacation rental or corporate housing. UNIT MIX TWO 2BD/1BT UNITS + 4 STUDIOS!! BAY VIEWS, NEW LANDSCAPING, NEW STAINLESS STEEL APPLIANCES, AC/HEATING UNITS, CEILING FANS, NEW WINDOWS, NEW FLOORING, NEW OWNED LAUNDRY, GATED ENTRY, SECURE, AND MUCH MORE!! Walking distance to Little Italy and Mission Hills which offers some of the best dining & entertainment in the city! Easy access to transit and freeways. 5000sqft lot. NOI $74,746 - Current Gross Rents - $9,680 per month!
-
2020-04-01historical
-
2020-02-28$1,495,000
-
2020-02-27historical
-
2020-01-01$1,595,000
-
2019-07-02soldstatus $1,045,000
ⓘ Source: listings_history table (triggers on properties + properties_extension) + one-shot
backfill from property_details.listing_events for pre-trigger history.
Tax reassessment forecast CA · Resets to sale price
- Current annual tax
- $21,298 · $1,775/mo
- Projected year-2 tax
- $21,298 · $1,775/mo
- Expected delta
- $0/yr ($0/mo · 0.0%)
ⓘ Screening estimate from a state-policy table — verify with the county assessor before closing.
Climate risk First Street
- Flood 1/10 Low FEMA zone X (unshaded) · 0% chance over 30 yrs
- Wildfire 1/10 Low
- Heat 4/10 Moderate 7 d/yr ≥84°F today · 20 d/yr by 30 yrs out
- Wind 1/10 Low
- Air quality 4/10 Moderate 4 unhealthy d/yr today · 4 by 30 yrs out
Nearby sold comps map
Loading sold comps map…
Walkable amenities ~0.75 mi
Loading nearby amenities…
Taxation est. · year 1
- Rental income
- $243,624
- − Mortgage interest
- −$117,633
- − Property taxes
- −$21,298
- − Insurance
- −$10,500
- − Repairs & maintenance
- −$19,490
- − Management
- −$19,490
- − Depreciation
- −$61,091
- Taxable loss
- −$5,877
- Est. tax savings @ 24.0%
- +$1,410
- After-tax cash flow
- $29,924/yr
For passive investors: Depreciation is non-cash, so a rental often shows a tax loss while cash-flowing — sheltering income. Rental losses are passive: they offset passive income freely, and up to $25,000/yr can offset ordinary (W-2) income if you actively participate and your MAGI is under $100k (phasing out to $0 by $150k); unused losses carry forward. On sale, claimed depreciation is recaptured at up to 25%, and gains may owe capital-gains tax (a 1031 exchange can defer both). Figures are a year-1 estimate at your 24.0% rate — not tax advice; consult a CPA.
Schools (NCES district)
- District
- San Diego Unified
- NCES district ID
- 0634320
- Math proficiency
- 19% ▼ -29.00%
- Reading proficiency
- 29% ▼ -28.00%
- Median HH income
- $61,673
- Composite
- 22.31/100
- National rank
- #8135
- State rank
- #393 of 517 in CA
Livability — San Diego
- Score
- 75/100
- State rank
- #123
- US rank
- #4206
Category grades
Schools grade is shown separately in the Schools card above.
Census & demographics
- Census place
- San Diego, CA
- County
- San Diego County · 3,178,799 people
- City population
- 1,397,612
- Metro
- San Diego-Chula Vista-Carlsbad, CA
- Population (ZIP)
- 51,805
- Household income
- $91,566
- Rent vs Own
- Severe rent burden
- 5603.0
Population outlook (San Diego County) Hauer SSP2
- Today (2025)
- 3,678,185 people
- By 2030
- 3,856,546 · +4.8%
- By 2040
- 4,171,407 · +13.4%
- By 2050
- 4,421,607 · +20.2%
- By 2075
- 4,831,599 · +31.4%
- By 2100
- 4,832,502 · +31.4%
Race, ethnicity, and origin ACS 2023
- Neighborhood character
- Diverse neighborhood (Simpson 0.64)
- Race & ethnicity
- White 54% Hispanic / Latino 24% Two or more races 12% Asian 10% Black 8%
- Hispanic origin (detail)
- Mexican 16%
- Common ancestry
- Romanian 3% Lithuanian 2% Italian 2%
- Foreign-born
- 19% · Canada, China, Vietnam
- Languages at home
- 74% English-only · Spanish 15% Other Indo-European 3% Other Asian/Pacific 1%
Political lean MEDSL · San Diego
- 2024 margin
- D (+16.8) · D 56.9% · R 40.1% · Other 2.9%
- 2008→2024 swing
- +6.6pp toward D · 2008: 10.2pp · 2024: 16.8pp
- All cycles
- 2024: D+16.8 2020: D+22.8 2016: D+17.8 2012: D+5.1 2008: D+10.2
Not yet ingested
- Civics
- —
Market trends
- HPI YoY
- ▼ -1.82%
- Current HPI
- 224.0762
- Rent YoY
- ▲ 0.35%
- Metro
- San Diego-Chula Vista-Carlsbad, CA
- State GDP YoY
- ▲ 3.21%
- F500 in state
- 116
Industry mix (Fortune 500 HQ in CA)
| Industry | F500 HQs | Revenue |
|---|---|---|
| Technology | 27 | $1,492B |
|
||
| Financial Services | 3 | $174B |
|
||
| Retail | 3 | $44B |
|
||
| Insurance | 3 | $26B |
|
||
| Media / Entertainment | 2 | $115B |
|
||
| Pharmaceuticals / Biotech | 2 | $62B |
|
||
Price history
+101.0% since first listed8 events — show timeline
- 2026-03-04 Listed $2,100,000 SDMLS
- 2020-07-30 Sold (MLS) $1,440,000 SDMLS
- 2020-05-05 Listed $1,295,000 SDMLS
- 2020-04-01 Listing Removed — SDMLS
- 2020-02-28 Listed $1,495,000 SDMLS
- 2020-02-27 Listing Removed — SDMLS
- 2020-01-01 Listed $1,595,000 SDMLS
- 2019-07-02 Sold (Public Records) $1,045,000 Public Records
Property tax history
+14.6%/yrLatest (2025): $21,298 · +3.9% YoY. Source: county tax records.
Cash-flow waterfall
monthlySold comps — $/sqft
last 12 mo · ≤1 miLoading sold comps…