136 Pine St · Mead, OK
Flood risk 1/10 · Minimal
- FEMA flood zone
- X (unshaded)
- Chance of flooding over 30 yrs
- 0.0%
- Est. flood insurance / yr
- $507 – $1,088
Fire risk 5/10 · Moderate
- Est. fire insurance / yr
- $2,463 – $4,575
Heat risk 6/10 · Moderate
- Hot days now (above 110°F)
- 7 days/yr
- Hot days in 30 yrs
- 20 days/yr
Wind risk 4/10 · Minor
- Chance of severe wind over 30 yrs
- 16.0%
Air-quality risk 3/10 · Minor
- Unhealthy air days now
- 3 days/yr
- Unhealthy air days in 30 yrs
- 3 days/yr
Risk factors via First Street. Map © Google.
Why this score? — see what drove the D+ grade
The composite is a weighted blend of 9 inputs, each scored 0–100. Each bar is that input's sub-score; the figure is the points it added to the 100-point composite (weight × sub-score).
- ARV discount +15.0/15.0
- Appreciation +10.0/10.0
- Cash flow +7.4/30.0
- Livability +2.8/5.0
- Rent growth +2.5/5.0
- Schools +2.5/10.0
- Condition / age +2.5/5.0
- 1% rule +2.1/10.0
- DSCR +1.6/10.0
$185,000
🖨 Deal sheet 📄 Offer letter ✓ Due diligence
Listing remarks
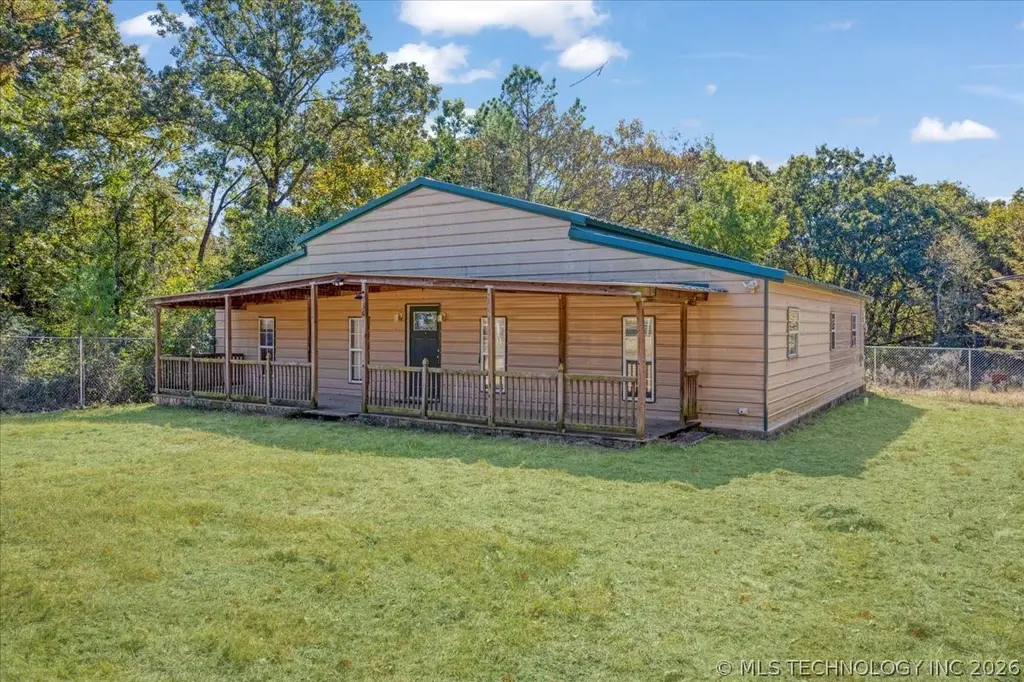
Welcome to 136 Pine Street, Mead, OK—a beautifully upgraded home that’s ready for you to move in and enjoy! This inviting property is nestled in a quiet neighborhood just minutes from Lake Texoma, making it perfect for outdoor enthusiasts and families alike. Step inside and discover a host of recent improvements: new appliances and cabinets (2021) give the kitchen a fresh, modern feel. The bedrooms feature new flooring (2025) for added comfort. And a new electrical panel (2020) ensures safety and reliability for all your modern needs. Outside a new aerobic septic system (2020), chain link fence (2022), and metal roof (2023) ensure lasting value and peace of mind. Relax on the la
Key facts
- New flooring
- New cabinets
- New appliances
Tags
Property features AI
Exterior
- Parking: Gravel driveway parking
- Security: Smoke detector(s); No safety shelter
- Utilities: Electricity available; Water available (rural); Aerobic septic system
- Home design: Single-story home; Faces north; Slab foundation
- Construction: Built as wood frame with wood siding; Metal roof; Year built sourced from public records
- Exterior features: Covered porch; Gravel driveway; Satellite dish; Chain link fencing; Mature trees on the lot
Interior
- Kitchen: Kitchen with island; Breakfast nook; Pantry; Oven; Range; Microwave; Dishwasher; Garbage disposal; Electric oven/range connections
- Bedrooms: Bedroom on the first floor
- Flooring: Tile flooring; Wood flooring
- Bathrooms: 2 full bathrooms
- Heating & cooling: Central heating (electric); Central air conditioning
- Interior features: Vaulted ceilings; Ceiling fan(s); Laminate counters; Vinyl window frames
- Laundry & utility: Utility room with sink (first floor); Washer hookup; Electric dryer hookup; Electric water heater
Neighborhood map
What this means for you Summary
Snapshot
- This is a 4-bed/2.0-bath single-family listed at $185k.
Deal economics
- At list price, monthly cash flow is $-237 ($-3k/yr) — negative.
- To cash-flow at today's rent, offer at most $151k (18.6% below list).
- To meet the 1% rule (rent ≥ 1% of price), the offer needs to be $132k (28.8% below list).
- Recommended offer: $132k (28.8% below list) — sets the bar for 1% rule.
Location & tenants
- Location reads 55/100 on livability (#562 in OK) — a working-class tenant base; expect higher turnover. Strengths: cost of living A+, housing A+, employment B; Watch: schools F, crime F, amenities F.
- Silo (rural): math 24% / reading 35% proficiency, ranked #64 of 270 in OK (top 24%) — low school quality limits family demand, transient renter base, plan for 1-2y turnover; 64% free/reduced lunch — lower-income household profile, screen leases tightly.
- Market conditions: 45 active listings in the ZIP; 176 units permitted in Bryan County in 2024 (80 in 5+ unit buildings).
Forward outlook
- In year one you build about $20k of equity ($1k loan paydown + $18k appreciation (10.0% local appreciation)).
- Bryan County population projected at +26% by 2050 — long-run rental-demand tailwind backs the buy-and-hold thesis.
- By year 2, paydown + projected appreciation supports a ~$32k cash-out refi (75% LTV) — recoverable capital for the next deal without selling this one.
Negotiation context
- It's been on market 30 days — a 2% lower offer ($182k) is reasonable based on typical stale-listing flexibility.
- 9 sale attempts since 12y ago; this cycle's ask has dropped $10k (5%) from the opening price — seller is motivated, your offer sets the floor, not the list.
- Current owner paid $81k; list at $185k implies a 128% gain — meaningful room to come down on a strong offer.
Risks & watch-outs
- Climate carrying-cost: moderate wildfire risk; extreme-heat days projected 7→20/yr by 2055 (HVAC capex compounding) — expect insurance premiums to compound above CPI over the hold.
Questions for the listing agent
- What do current leases actually rent for vs. the listed asking? Can we see a recent rent roll and the last 12 months of T-12 income?
- Is there a deadline driving the sale (1031 exchange, divorce, estate, relocation)? That informs how much negotiation room exists.
- Schools are F-rated, which usually means shorter tenancies and higher turnover. Who's the typical renter profile here, and what's been the actual vacancy rate?
- Crime grade is F in this area — have there been break-ins, vandalism, or insurance claims at this property in the last 3 years? What carrier currently insures it and at what premium?
- The area grade is low — what's the realistic commute time and amenity access for the typical tenant pool here? Any planned neighborhood developments (good or bad) we should know about?
- What's the average days-on-market for RENTAL listings here right now (not sales)? A rising rental-DOM trend means longer vacancies and softer asking-rent achievability than the comps imply.
- What's the recent tenant-quality profile in this submarket — average credit score on applications, eviction rate, late-payment / NSF rate, and stable-employment percentage? A property-management company in the area should have these aggregated.
- How much new for-sale + rental construction is in the pipeline within 1–3 miles? Heavy new supply typically softens prices + rents 12–24 months out; constrained supply supports both.
Investment metrics
- 1% rule
- 0.71% ✗
- Cap rate
- 4.75%
- Cash-on-cash
- -5.50%
- DSCR
- 0.76
- GRM
- 11.7
CMA / ARV
- ARV (on-the-fly)
- $358,176
- Comps found
- 1
Show comp detail 1 sale within ~0.75 mi
| Address | Dist | Beds/Ba | Sqft | Sold | Price | $/sf | Match |
|---|---|---|---|---|---|---|---|
| 2132 N Ranchette Rd | 0.57mi | 3/2.5 (-1) | 1,960 (-0%) | 23mo | $356,000 | $182 | 46 |
Match score weights: distance 35% · size 25% · config 20% · recency 20%. Top-matched comps best support the ARV.
Projected returns pro-forma
10.0% appreciation · 3.0% rent growth · sell at horizon
- IRR
- 20.4%
- Equity multiple
- 2.65×
- Total profit
- $85,661
- Equity at exit
- $166,663
- IRR
- 18.6%
- Equity multiple
- 6.10×
- Total profit
- $264,183
- Equity at exit
- $359,414
Cash invested: $51,800 (down + closing). Projections, not guarantees.
Landlord ↔ Tenant lean methodology
- Overall (STATE)
- 83 Strongly Landlord-Friendly
- State Oklahoma
- 83 Strongly Landlord-Friendly · R+20
- County
- — inherits STATE
- City
- — inherits STATE
ZIP-level market 73449
- Home prices YoY
- 13.3%
- Active inventory
- 45
- Price-to-rent
- 11.7×
Monthly cashflow live
- Estimated rent
- $1,318 medium interval (Pro) →
- Mortgage (P&I)
- −$970
- Tax est. 1.5%
- −$231 /mo · $2,775/yr
- Insurance
- −$77
- HOA
- −$0
- Vacancy / Maint / Mgmt
- −$277
- Net cashflow
- $-237
Break-even live
UW: 25.0% down · 7.5% · 30yr · 1.5% tax · 5.0% vac · 8.0% maint · 8.0% mgmt
Financing live
Cash to close
- Down payment
- $46,250
- Closing costs
- $5,550
- Reserves months
- —
- Total cash needed
- —
Loan-product check · same deal, 3 products live
Conventional
25% down · 7.5% · 30yr
- Down + closing
- —
- Monthly P&I
- —
- Monthly cashflow
- —
- DSCR
- —
- Eligible?
- —
Personal DTI + credit; lowest rate.
DSCR
20% down · 8.5% · 30yr
- Down + closing
- —
- Monthly P&I
- —
- Monthly cashflow
- —
- DSCR
- —
- Eligible?
- —
No personal income docs; deal must DSCR.
Hard money
10% down · 12.0% · 12mo
- Down + closing
- —
- Monthly P&I
- —
- Monthly cashflow
- —
- DSCR
- —
- Eligible?
- —
Short-term bridge; refi at stabilization.
Listing history 26 events
-
2026-06-07statusdays on market $185,000 Pending 30 DOM
-
2026-06-03days on market $185,000 Active 27 DOM
-
2026-06-02days on market $185,000 Active 26 DOM
-
2026-06-01days on market $185,000 Active 25 DOM
-
2026-05-31days on market $185,000 Active 24 DOM
-
2026-05-30days on market $185,000 Active 23 DOM
-
2026-05-12price $185,000
-
2026-05-07$195,000 Active
-
2026-05-04historical
-
2026-04-16status Active
-
2026-04-12status Pending
-
2026-02-23$195,000 Active
-
2026-02-23historical
-
2026-02-20price $195,000
-
2025-11-04$210,000 Active
-
2025-09-05historical
-
2025-03-17$249,000 Active
-
2021-07-14historical
-
2021-05-31$225,000 Active
-
2020-12-10soldstatus $81,000
-
2020-05-11$84,900
-
2020-03-06historical
-
2019-09-12$116,760
-
2015-04-06soldstatus $100,000
-
2015-04-01soldstatus $100,000
-
2014-04-23$99,900
ⓘ Source: listings_history table (triggers on properties + properties_extension) + one-shot
backfill from property_details.listing_events for pre-trigger history.
Climate risk First Street
- Flood 1/10 Low FEMA zone X (unshaded) · 0% chance over 30 yrs
- Wildfire 5/10 Major
- Heat 6/10 Major 7 d/yr ≥110°F today · 20 d/yr by 30 yrs out
- Wind 4/10 Moderate 16% chance of damaging wind over 30 yrs
- Air quality 3/10 Moderate 3 unhealthy d/yr today · 3 by 30 yrs out
Nearby sold comps map
Loading sold comps map…
Walkable amenities ~0.75 mi
Loading nearby amenities…
Taxation est. · year 1
- Rental income
- $15,815
- − Mortgage interest
- −$10,363
- − Property taxes
- −$2,775
- − Insurance
- −$925
- − Repairs & maintenance
- −$1,265
- − Management
- −$1,265
- − Depreciation
- −$5,382
- Taxable loss
- −$6,160
- Est. tax savings @ 24.0%
- +$1,478
- After-tax cash flow
- $-1,369/yr
For passive investors: Depreciation is non-cash, so a rental often shows a tax loss while cash-flowing — sheltering income. Rental losses are passive: they offset passive income freely, and up to $25,000/yr can offset ordinary (W-2) income if you actively participate and your MAGI is under $100k (phasing out to $0 by $150k); unused losses carry forward. On sale, claimed depreciation is recaptured at up to 25%, and gains may owe capital-gains tax (a 1031 exchange can defer both). Figures are a year-1 estimate at your 24.0% rate — not tax advice; consult a CPA.
Schools (NCES district)
- District
- Silo
- NCES district ID
- 4027640
- Math proficiency
- 24% ▼ -7.00%
- Reading proficiency
- 35% ▬ 0.00%
- Median HH income
- $46,297
- Composite
- 25.4/100
- National rank
- #7463
- State rank
- #64 of 270 in OK
Livability — Mead
- Score
- 55/100
- State rank
- #562
- US rank
- #23551
Category grades
Schools grade is shown separately in the Schools card above.
Census & demographics
- Population (ZIP)
- 3,063
Population outlook (Bryan County) Hauer SSP2
- Today (2025)
- 50,265 people
- By 2030
- 52,866 · +5.2%
- By 2040
- 58,018 · +15.4%
- By 2050
- 63,073 · +25.5%
- By 2075
- 74,439 · +48.1%
- By 2100
- 81,743 · +62.6%
Race, ethnicity, and origin ACS 2023
- Neighborhood character
- Predominantly White (75%)
- Race & ethnicity
- White 75% Native American 12% Two or more races 11% Hispanic / Latino 5%
- Common ancestry
- Slovak 3% Lithuanian 2% Italian 1%
- Foreign-born
- 1% · Canada
- Languages at home
- 96% English-only · Spanish 3% Russian/Polish/Slavic 1%
Political lean MEDSL · Bryan
- 2024 margin
- Solid R (+58.5) · D 20.0% · R 78.6% · Other 1.4%
- 2008→2024 swing
- -23.0pp toward R · 2008: -35.5pp · 2024: -58.5pp
- All cycles
- 2024: R+58.5 2020: R+56.5 2016: R+55.6 2012: R+44.5 2008: R+35.5
Not yet ingested
- Civics
- —
Market trends
- HPI YoY
- ▲ 44.61%
- Current HPI
- 378.9559
- Rent YoY
- —
- Metro
- —
- State GDP YoY
- ▲ 1.55%
- F500 in state
- 6
Industry mix (Fortune 500 HQ in OK)
| Industry | F500 HQs | Revenue |
|---|---|---|
| Energy | 3 | $48B |
|
||
Price history
+85.2% since first listed20 events — show timeline
- 2026-05-12 Price Changed $185,000 MLS Technology, Inc.
- 2026-05-07 Listed $195,000 MLS Technology, Inc.
- 2026-05-04 Listing Removed — MLS Technology, Inc.
- 2026-04-16 Relisted — MLS Technology, Inc.
- 2026-04-12 Pending — MLS Technology, Inc.
- 2026-02-23 Listing Removed — MLS Technology, Inc.
- 2026-02-23 Listed $195,000 MLS Technology, Inc.
- 2026-02-20 Price Changed $195,000 MLS Technology, Inc.
- 2025-11-04 Listed $210,000 MLS Technology, Inc.
- 2025-09-05 Listing Removed — MLS Technology, Inc.
- 2025-03-17 Listed $249,000 MLS Technology, Inc.
- 2021-07-14 Listing Removed — MLS Technology, Inc.
- 2021-05-31 Listed $225,000 MLS Technology, Inc.
- 2020-12-10 Sold (MLS) $81,000 MLS Technology, Inc.
- 2020-05-11 Listed $84,900 MLS Technology, Inc.
- 2020-03-06 Listing Removed — MLS Technology, Inc.
- 2019-09-12 Listed $116,760 MLS Technology, Inc.
- 2015-04-06 Sold (Public Records) $100,000 Public Records
- 2015-04-01 Sold (MLS) $100,000 MLS Technology, Inc.
- 2014-04-23 Listed $99,900 MLS Technology, Inc.
Property tax history
-20.1%/yrLatest (2025): $60 · +5.3% YoY. Source: county tax records.
Cash-flow waterfall
monthlySold comps — $/sqft
last 12 mo · ≤1 miLoading sold comps…