 Multi-family
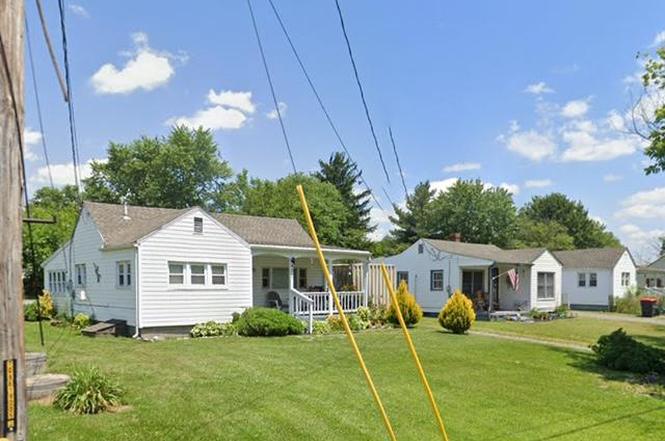
437, 441, 445 Stephenson Rd · Brucetown, VA
Flood risk 1/10 · Minimal
- FEMA flood zone
- X (unshaded)
- Chance of flooding over 30 yrs
- 0.0%
- Est. flood insurance / yr
- $507 – $1,088
Fire risk 3/10 · Minor
- Est. fire insurance / yr
- $666 – $1,236
Heat risk 5/10 · Moderate
- Hot days now (above 103°F)
- 7 days/yr
- Hot days in 30 yrs
- 16 days/yr
Wind risk 2/10 · Minimal
- Chance of severe wind over 30 yrs
- 2.0%
Air-quality risk 2/10 · Minimal
- Unhealthy air days now
- 0 days/yr
- Unhealthy air days in 30 yrs
- 1 days/yr
Risk factors via First Street. Map © Google.
Why this score? — see what drove the C grade
The composite is a weighted blend of 9 inputs, each scored 0–100. Each bar is that input's sub-score; the figure is the points it added to the 100-point composite (weight × sub-score).
- Cash flow +22.5/30.0
- ARV discount +7.5/15.0
- DSCR +7.2/10.0
- 1% rule +5.9/10.0
- Schools +5.0/10.0
- Rent growth +2.5/5.0
- Livability +2.5/5.0
- Condition / age +2.5/5.0
- Appreciation +0.0/10.0
$575,000
🖨 Deal sheet (PDF) 📄 Offer letter ✓ Due diligence
Multi-family units
County records classify this as Multi-Family (2-4 Unit). Listing-text estimate: 1 unit. estimate disagrees with records
Listing remarks MLS
Excellent investment opportunity featuring three separate detached homes on one parcel. Each home offers central air with efficient heat pumps and newer roofs, providing peace of mind and reduced capital expenses. Property is serviced by public water with pump-and-haul septic systems in place. Ideal setup for investors seeking multiple income streams with well-maintained improvements already in place. Turnkey opportunity for investors seeking immediate income with leases already in place.
Key facts
- 0.69 acre lot
- Built 1950
- Listed 134 days
Property features AI
Finance
- Other: Fee simple ownership; Property condition listed as average; Year built estimated
Exterior
- Parking: Driveway
- Utilities: Public water; Private septic tank
- Home design: Detached property
- Construction: Vinyl siding; Block and stone foundation; Shingle roof
- Exterior features: Cleared lot; Corner lot; Shed on property; Above-grade other structures
Interior
- Bedrooms: 6 bedrooms on main level
- Bathrooms: 3 full bathrooms on main level; 3 full bathrooms total
- Heating & cooling: Heat pump(s) heating; Central air conditioning; Electric heating and cooling; Electric hot water
- Interior features: Estimated living area; No basement
Neighborhood map
What this means for you Summary
Snapshot
- This is a 6-bed/3.0-bath multifamily listed at $575k.
Deal economics
- At list price, monthly cash flow is $966 ($12k/yr) — positive.
- The deal already cash-flows at list — no discount required.
- Meets the 1% rule at list price ($6k rent vs $575k).
- Recommended offer: $506k (12.0% below list) — sets the bar for market timing.
- Cap rate 8.3% vs local median 3.2% in Brucetown — top-decile yield for the area; either an underpriced asset or a hidden risk that comps aren't pricing in. Stress-test before assuming the spread holds.
Location & tenants
- Location reads: area grade C — affects rentability + tenant quality, not the cash-flow math above.
- Frederick County Public School District (rural): math 49% / reading 64% proficiency, ranked #65 of 131 in VA (top 50%) — acceptable for families but not a draw, mixed tenant base, ~2y average lease.
- Market conditions: 58 active listings in the ZIP; solid renter incomes; 872 units permitted in Frederick County in 2024 (0 in 5+ unit buildings).
- At $6,253/mo this rent would consume 70% of the median local household income ($107k/yr) — very limited rent-growth headroom before tenants either downsize or default.
Forward outlook
- Local home prices are declining (-3.0%/yr); year-one equity from $4k of loan paydown is wiped out by about $17k of value loss. Plan a longer hold.
- Frederick County population projected at +17% by 2050 — long-run rental-demand tailwind backs the buy-and-hold thesis.
Negotiation context
- It's been on market 135 days — a 12% lower offer ($506k) is reasonable based on typical stale-listing flexibility.
- 2 sale attempts with the ask held roughly flat each time — persistent listings suggest the price (not the market) is what's stuck; bring a comps-based counter.
Risks & watch-outs
- Watch-outs: built in 1950 — expect roof / HVAC / electrical / plumbing capex.
- Climate carrying-cost: extreme-heat days projected 7→16/yr by 2055 (HVAC capex compounding) — expect insurance premiums to compound above CPI over the hold.
Questions for the listing agent
- It's been on market 135 days. Have you received any prior offers? Is the seller open to a 12% concession, seller financing, or rate buy-down credit?
- Built in 1950 — when were the roof, HVAC, electrical panel, plumbing, and water heater last replaced?
- Why hasn't it sold? Are there any deal-killer items the seller is aware of (foundation, flood, title, zoning, code violations)?
- Is there a deadline driving the sale (1031 exchange, divorce, estate, relocation)? That informs how much negotiation room exists.
- What's the average days-on-market for RENTAL listings here right now (not sales)? A rising rental-DOM trend means longer vacancies and softer asking-rent achievability than the comps imply.
- What's the recent tenant-quality profile in this submarket — average credit score on applications, eviction rate, late-payment / NSF rate, and stable-employment percentage? A property-management company in the area should have these aggregated.
- How much new apartment / multifamily construction is in the pipeline within 1–3 miles? Heavy new supply (>2% of stock underway) typically softens rents 12–24 months out; light construction supports rent growth.
Investment metrics
- 1% rule
- 1.09% ✓
- Cap rate
- 8.31%
- Cash-on-cash
- 7.20%
- DSCR
- 1.32
- GRM
- 7.7
CMA / ARV
No comps found within radius.
Projected returns pro-forma
-3.0% appreciation · 3.0% rent growth · sell at horizon
- IRR
- -5.3%
- Equity multiple
- 0.80×
- Total profit
- $-31,544
- Equity at exit
- $85,734
- IRR
- 4.4%
- Equity multiple
- 1.32×
- Total profit
- $52,153
- Equity at exit
- $49,715
Cash invested: $161,000 (down + closing). Projections, not guarantees.
Landlord ↔ Tenant lean methodology
- Overall (STATE)
- 55 Moderately Landlord-Leaning
- State Virginia
- 55 Moderately Landlord-Leaning · D+2
- County
- — inherits STATE
- City
- — inherits STATE
ZIP-level market 22656
- Home prices YoY
- -26.6%
- Active inventory
- 58
- Price-to-rent
- 23.0×
Monthly cashflow live
- Estimated rent
- $6,253 medium interval (Pro) →
- Mortgage (P&I)
- −$3,015
- Tax est. 1.5%
- −$719 /mo · $8,625/yr
- Insurance
- −$240
- HOA
- −$0
- Vacancy / Maint / Mgmt
- −$1,313
- Net cashflow
- $966
Break-even live
Sensitivity live
| Price | -10% $1,364 | -5% $1,165 | +0% $966 | +5% $767 | +10% $569 |
|---|---|---|---|---|---|
| Rent | -10% $472 | -5% $719 | +0% $966 | +5% $1,213 | +10% $1,460 |
| Rate | -1.0pp $1,256 | -0.5pp $1,112 | base $966 | +0.5pp $817 | +1.0pp $666 |
3-unit breakdown (identical units grouped — click to expand)
| Units | Beds | Baths | Est. rent |
|---|---|---|---|
| 3× units | 3 | 1 | $6,252 |
| #1 | 3 | 1 | $2,084 |
| #2 | 3 | 1 | $2,084 |
| #3 | 3 | 1 | $2,084 |
| Total (3 units) | $6,253 | ||
UW: 25.0% down · 7.5% · 30yr · 1.5% tax · 5.0% vac · 8.0% maint · 8.0% mgmt
Financing live
Cash to close
- Down payment
- $143,750
- Closing costs
- $17,250
- Reserves months
- —
- Total cash needed
- —
Loan-product check · same deal, 3 products live
Conventional
25% down · 7.5% · 30yr
- Down + closing
- —
- Monthly P&I
- —
- Monthly cashflow
- —
- DSCR
- —
- Eligible?
- —
Personal DTI + credit; lowest rate.
DSCR
20% down · 8.5% · 30yr
- Down + closing
- —
- Monthly P&I
- —
- Monthly cashflow
- —
- DSCR
- —
- Eligible?
- —
No personal income docs; deal must DSCR.
Hard money
10% down · 12.0% · 12mo
- Down + closing
- —
- Monthly P&I
- —
- Monthly cashflow
- —
- DSCR
- —
- Eligible?
- —
Short-term bridge; refi at stabilization.
Listing history 20 events
-
2026-06-19days on market $575,000 Active 135 DOM
-
2026-06-18days on market $575,000 Active 134 DOM
-
2026-06-17days on market $575,000 Active 133 DOM
-
2026-06-16days on market $575,000 Active 132 DOM
-
2026-06-15days on market $575,000 Active 131 DOM
-
2026-06-14days on market $575,000 Active 129 DOM
-
2026-06-13days on market $575,000 Active 128 DOM
-
2026-06-10days on market $575,000 Active 126 DOM
-
2026-06-09days on market $575,000 Active 125 DOM
-
2026-06-08days on market $575,000 Active 124 DOM
-
2026-06-07days on market $575,000 Active 123 DOM
-
2026-06-05days on market $575,000 Active 120 DOM
-
2026-06-02days on market $575,000 Active 118 DOM
-
2026-06-01days on market $575,000 Active 117 DOM
-
2026-05-31days on market $575,000 Active 116 DOM
-
2026-05-30days on market $575,000 Active 115 DOM
-
2026-02-05$575,000 Active
Show marketing remark (493 chars)
Excellent investment opportunity featuring three separate detached homes on one parcel. Each home offers central air with efficient heat pumps and newer roofs, providing peace of mind and reduced capital expenses. Property is serviced by public water with pump-and-haul septic systems in place. Ideal setup for investors seeking multiple income streams with well-maintained improvements already in place. Turnkey opportunity for investors seeking immediate income with leases already in place.
-
2026-02-05$575,000 Active 493-char remark
Show marketing remark (493 chars)
Excellent investment opportunity featuring three separate detached homes on one parcel. Each home offers central air with efficient heat pumps and newer roofs, providing peace of mind and reduced capital expenses. Property is serviced by public water with pump-and-haul septic systems in place. Ideal setup for investors seeking multiple income streams with well-maintained improvements already in place. Turnkey opportunity for investors seeking immediate income with leases already in place.
-
2026-01-29historical $575,000
Show marketing remark (493 chars)
Excellent investment opportunity featuring three separate detached homes on one parcel. Each home offers central air with efficient heat pumps and newer roofs, providing peace of mind and reduced capital expenses. Property is serviced by public water with pump-and-haul septic systems in place. Ideal setup for investors seeking multiple income streams with well-maintained improvements already in place. Turnkey opportunity for investors seeking immediate income with leases already in place.
-
2026-01-29historical $575,000 493-char remark
Show marketing remark (493 chars)
Excellent investment opportunity featuring three separate detached homes on one parcel. Each home offers central air with efficient heat pumps and newer roofs, providing peace of mind and reduced capital expenses. Property is serviced by public water with pump-and-haul septic systems in place. Ideal setup for investors seeking multiple income streams with well-maintained improvements already in place. Turnkey opportunity for investors seeking immediate income with leases already in place.
ⓘ Source: listings_history table (triggers on properties + properties_extension) + one-shot
backfill from property_details.listing_events for pre-trigger history.
Climate risk First Street
- Flood 1/10 Low FEMA zone X (unshaded) · 0% chance over 30 yrs
- Wildfire 3/10 Moderate
- Heat 5/10 Major 7 d/yr ≥103°F today · 16 d/yr by 30 yrs out
- Wind 2/10 Low 2% chance of damaging wind over 30 yrs
- Air quality 2/10 Low 0 unhealthy d/yr today · 1 by 30 yrs out
Nearby sold comps map
Loading sold comps map…
Walkable amenities ~0.75 mi
Loading nearby amenities…
Taxation est. · year 1
- Rental income
- $75,036
- − Mortgage interest
- −$32,209
- − Property taxes
- −$8,625
- − Insurance
- −$2,875
- − Repairs & maintenance
- −$6,003
- − Management
- −$6,003
- − Depreciation
- −$16,727
- Taxable income
- $2,594
- Est. tax owed @ 24.0%
- −$623
- After-tax cash flow
- $10,972/yr
For passive investors: Depreciation is non-cash, so a rental often shows a tax loss while cash-flowing — sheltering income. Rental losses are passive: they offset passive income freely, and up to $25,000/yr can offset ordinary (W-2) income if you actively participate and your MAGI is under $100k (phasing out to $0 by $150k); unused losses carry forward. On sale, claimed depreciation is recaptured at up to 25%, and gains may owe capital-gains tax (a 1031 exchange can defer both). Figures are a year-1 estimate at your 24.0% rate — not tax advice; consult a CPA.
Schools (NCES district)
- District
- Frederick County Public School District
- NCES district ID
- 5101470
- Math proficiency
- 49% ▼ -30.00%
- Reading proficiency
- 64% ▼ -10.00%
- Median HH income
- $67,049
- Composite
- 49.75/100
- National rank
- #1964
- State rank
- #65 of 131 in VA
Livability — Brucetown
No livability data for this city. (Only ~50 U.S. cities are tracked.)
Census & demographics
- County
- Frederick County · 60,887 people
- Metro
- Winchester, VA-WV
- Population (ZIP)
- 5,360
- Household income
- $107,135
- Rent vs Own
Population outlook (Frederick County) Hauer SSP2
- Today (2025)
- 92,976 people
- By 2030
- 97,195 · +4.5%
- By 2040
- 104,149 · +12.0%
- By 2050
- 108,407 · +16.6%
- By 2075
- 116,431 · +25.2%
- By 2100
- 114,323 · +23.0%
Race, ethnicity, and origin ACS 2023
- Neighborhood character
- Predominantly White (77%)
- Race & ethnicity
- White 77% Hispanic / Latino 8% Asian 8% Black 4% Two or more races 3%
- Hispanic origin (detail)
- Mexican 2%
- Common ancestry
- Italian 5% Romanian 4% Serbian 2%
- Foreign-born
- 12% · Canada, China
- Languages at home
- 86% English-only · Spanish 6% Other Indo-European 3% Tagalog/Filipino 2%
Political lean MEDSL · Frederick
- 2024 margin
- Strong R (+28.4) · D 35.2% · R 63.6% · Other 1.1%
- 2008→2024 swing
- -7.0pp toward R · 2008: -21.4pp · 2024: -28.4pp
- All cycles
- 2024: R+28.4 2020: R+27.4 2016: R+35.3 2012: R+28.0 2008: R+21.4
Not yet ingested
- Civics
- —
Market trends
- HPI YoY
- ▼ -69.04%
- Current HPI
- 190.5857
- Rent YoY
- —
- Metro
- Winchester, VA-WV
- State GDP YoY
- ▲ 2.40%
- F500 in state
- 50
Industry mix (Fortune 500 HQ in VA)
| Industry | F500 HQs | Revenue |
|---|---|---|
| Aerospace / Defense | 4 | $236B |
|
||
| Technology / Defense | 3 | $32B |
|
||
| Financial Services | 2 | $176B |
|
||
| Utilities | 2 | $27B |
|
||
| Insurance | 2 | $25B |
|
||
| Technology | 2 | $15B |
|
||
Price history
+0.0% since first listed4 events — show timeline
- 2026-02-05 Listed $575,000 BRIGHT MLS
- 2026-02-05 Listed $575,000 BRIGHT MLS
- 2026-01-29 Coming Soon $575,000 BRIGHT MLS
- 2026-01-29 Coming Soon $575,000 BRIGHT MLS
Cash-flow waterfall
monthlySold comps — $/sqft
last 12 mo · ≤1 miLoading sold comps…