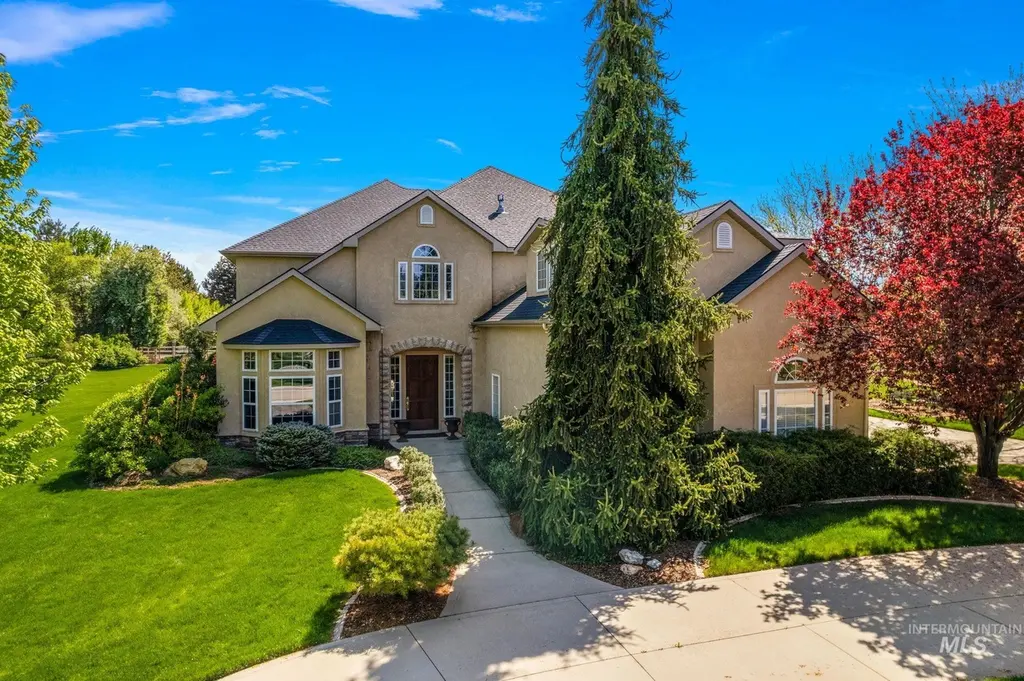
3236 S Kingsbury Way · Eagle, ID
Flood risk 1/10 · Minimal
- FEMA flood zone
- X (unshaded)
- Chance of flooding over 30 yrs
- 0.0%
- Est. flood insurance / yr
- $507 – $1,088
Fire risk 4/10 · Minor
- Est. fire insurance / yr
- $584 – $1,086
Heat risk 4/10 · Minor
- Hot days now (above 97°F)
- 7 days/yr
- Hot days in 30 yrs
- 17 days/yr
Wind risk 1/10 · Minimal
- Chance of severe wind over 30 yrs
- —
Air-quality risk 9/10 · Severe
- Unhealthy air days now
- 19 days/yr
- Unhealthy air days in 30 yrs
- 20 days/yr
Risk factors via First Street. Map © Google.
Why this score? — see what drove the D- grade
The composite is a weighted blend of 9 inputs, each scored 0–100. Each bar is that input's sub-score; the figure is the points it added to the 100-point composite (weight × sub-score).
- ARV discount +15.0/15.0
- Schools +5.2/10.0
- Appreciation +5.0/10.0
- Cash flow +4.0/30.0
- Livability +3.9/5.0
- Rent growth +2.5/5.0
- Condition / age +2.5/5.0
- 1% rule +0.0/10.0
- DSCR +0.0/10.0
$1,850,000
🖨 Deal sheet 📄 Offer letter ✓ Due diligence
Listing remarks
Exceptional one-acre estate in Eagle’s highly desirable Castlebury neighborhood. This stunning home offers 5 bedrooms, 4 baths, and a main-level executive office that could easily serve as a 6th bedroom. The gourmet kitchen boasts a granite island with prep sink and storage, double oven, 5-burner cooktop, and generous pantry, flowing seamlessly into the sun-drenched eating area and formal dining room—perfect for family meals or entertaining. The main-level master suite is a true retreat with a coffered lit ceiling, wine cooler, jetted tub, dual vanity, walk-in shower, wall of windows, and private patio access. Enjoy gatherings in the great room with fireplace and built-in cherry
Key facts
- Formal dining room
- Gourmet kitchen
- Granite island
Tags
Property features AI
Finance
- Other: Zoning: R-1; Current use: Single family; Subdivision: Castlebury; MLS area: Eagle - 0900
- HOA & community: Annual association fee of $1,500
Exterior
- Parking: Attached garage with 4 covered spaces; RV access/parking; Finished driveway
- Utilities: Septic tank; City water service and shared well; Cable connected; Broadband internet
- Home design: Single-family home with acreage; Built in 2002
- Construction: Frame, stone and stucco exterior; Crawl space foundation; Architectural-style roof
- Exterior features: Partial metal fencing; Covered patio/deck; 1–4.99 acre lot; Garden; Irrigation available; Auto sprinkler/full sprinkler/pressurized irrigation system; Sidewalks; Public paved road frontage
Interior
- Kitchen: Dishwasher; Double oven; Microwave; Built-in oven/range; Gas range; Refrigerator; Kitchen island; Pantry; Granite counters; Breakfast bar
- Bedrooms: 5 bedrooms (primary on main level; others on upper level)
- Flooring: Hardwood; Engineered wood; Tile
- Bathrooms: 4 bathrooms
- Fireplace: One gas fireplace
- Heating & cooling: Forced air heating (natural gas); Central air conditioning
- Interior features: Primary bedroom on main level; Bath in primary bedroom; Guest room; Den/office; Formal dining room; Great room; Recreation/bonus room; Double vanity; Walk-in closets; Breakfast bar; Pantry; Kitchen island; Granite counters
- Laundry & utility: Washer; Dryer; Owned water softener
Neighborhood map
What this means for you Summary
Snapshot
- This is a 4-bed/4.0-bath single-family listed at $1.85M.
Deal economics
- At list price, monthly cash flow is $-5k ($-62k/yr) — negative.
- To cash-flow at today's rent, offer at most $939k (49.3% below list).
- To meet the 1% rule (rent ≥ 1% of price), the offer needs to be $738k (60.1% below list).
- Recommended offer: $738k (60.1% below list) — sets the bar for 1% rule.
- Cap rate 2.9% vs local median 1.1% in Eagle — top-decile yield for the area; either an underpriced asset or a hidden risk that comps aren't pricing in. Stress-test before assuming the spread holds.
Location & tenants
- Location reads 78/100 on livability (#18 in ID, #2,702 nationally) — a middle-class / working-renter tenant base. Strengths: crime A+, employment A+, housing A+; Watch: amenities D+, commute F, cost of living F.
- Joint School District No. 2 (suburban): math 53% / reading 67% proficiency, ranked #11 of 92 in ID (top 12%) — acceptable for families but not a draw, mixed tenant base, ~2y average lease.
- Zoned schools: Paramount Elementary School (math 81% / reading 77%, grade A, #7 of 357 statewide, top 2%, 501 students, 11% FRL); Rocky Mountain High School (math 47% / reading 76%, grade B-, #18 of 169 statewide, top 10%, 1,917 students, 8% FRL).
- Market conditions: 1 active listings in the ZIP; 1 comparable units currently listed for rent nearby; 5,129 units permitted in Ada County in 2024 (414 in 5+ unit buildings).
Forward outlook
- In year one you build about $68k of equity ($13k loan paydown + $56k appreciation (3.0% local appreciation)).
- Ada County population projected at +45% by 2050 — long-run rental-demand tailwind backs the buy-and-hold thesis.
- By year 2, paydown + projected appreciation supports a ~$111k cash-out refi (75% LTV) — recoverable capital for the next deal without selling this one.
Negotiation context
- It's been on market 84 days — a 6% lower offer ($1.74M) is reasonable based on typical stale-listing flexibility.
- 4 sale attempts since 20y ago with the ask held roughly flat each time — persistent listings suggest the price (not the market) is what's stuck; bring a comps-based counter.
Questions for the listing agent
- What do current leases actually rent for vs. the listed asking? Can we see a recent rent roll and the last 12 months of T-12 income?
- It's been on market 84 days. Have you received any prior offers? Is the seller open to a 60% concession, seller financing, or rate buy-down credit?
- What does the HOA fee cover, when was the last increase, and are there any pending special assessments or reserve-fund shortfalls?
- Why hasn't it sold? Are there any deal-killer items the seller is aware of (foundation, flood, title, zoning, code violations)?
- Is there a deadline driving the sale (1031 exchange, divorce, estate, relocation)? That informs how much negotiation room exists.
- Schools are A-rated — typically a magnet for longer-tenancy family renters. What's the average tenant stay here, and is there a school-zone premium baked into asking?
- The area grade is low — what's the realistic commute time and amenity access for the typical tenant pool here? Any planned neighborhood developments (good or bad) we should know about?
- What's the average days-on-market for RENTAL listings here right now (not sales)? A rising rental-DOM trend means longer vacancies and softer asking-rent achievability than the comps imply.
- What's the recent tenant-quality profile in this submarket — average credit score on applications, eviction rate, late-payment / NSF rate, and stable-employment percentage? A property-management company in the area should have these aggregated.
- How much new for-sale + rental construction is in the pipeline within 1–3 miles? Heavy new supply typically softens prices + rents 12–24 months out; constrained supply supports both.
Investment metrics
- 1% rule
- 0.40% ✗
- Cap rate
- 2.95%
- Cash-on-cash
- -11.95%
- DSCR
- 0.47
- GRM
- 20.9
CMA / ARV
- ARV (on-the-fly)
- $2,730,684
- Comps found
- 12
Show comp detail 12 sales within ~0.75 mi
| Address | Dist | Beds/Ba | Sqft | Sold | Price | $/sf | Match |
|---|---|---|---|---|---|---|---|
| 1976 W Oakhampton Dr | 0.52mi | 4/4.5 | 4,766 (-4%) | 1mo | $3,950,000 | $829 | 66 |
| 1948 W Oakhampton Dr | 0.52mi | 4/4.5 | 4,803 (-4%) | 5mo | $3,499,000 | $729 | 64 |
| 1892 W Oakhampton Dr | 0.52mi | 4/4.5 | 4,819 (-3%) | 6mo | $3,325,000 | $690 | 63 |
| 2345 S Mallard Wing Way | 0.58mi | 4/5.0 | 4,759 (-4%) | 6mo | $3,375,000 | $709 | 57 |
| 2270 S Trout Stone Way | 0.61mi | 5/5.5 (+1) | 5,111 (+3%) | 0mo | $2,800,000 | $548 | 56 |
| 1923 E Golden Oak Ct | 0.63mi | 5/3.5 (+1) | 4,768 (-4%) | 1mo | $1,760,000 | $369 | 56 |
| 2124 W Clear Creek Dr | 0.73mi | 4/4.5 | 5,220 (+5%) | 5mo | $3,500,000 | $670 | 52 |
| 3343 S Donnington | 0.64mi | 4/3.5 | 4,439 (-11%) | 2mo | $1,524,990 | $344 | 48 |
| 1479 W Oakhampton Dr | 0.57mi | 4/3.5 | 4,348 (-13%) | 3mo | $1,295,000 | $298 | 48 |
| 2279 S Trout Stone Way | 0.63mi | 4/3.5 | 4,303 (-14%) | 2mo | $2,350,000 | $546 | 44 |
| 1775 E Dunwoody Ct | 0.67mi | 5/4.0 (+1) | 4,572 (-8%) | 8mo | $1,380,000 | $302 | 44 |
| 2248 S Trout Stone Way | 0.63mi | 4/5.0 | 4,366 (-12%) | 4mo | $2,175,000 | $498 | 43 |
Match score weights: distance 35% · size 25% · config 20% · recency 20%. Top-matched comps best support the ARV.
Projected returns pro-forma
3.0% appreciation · 3.0% rent growth · sell at horizon
- IRR
- -3.6%
- Equity multiple
- 0.79×
- Total profit
- $-106,677
- Equity at exit
- $831,840
- IRR
- 1.0%
- Equity multiple
- 1.15×
- Total profit
- $79,613
- Equity at exit
- $1,281,965
Cash invested: $518,000 (down + closing). Projections, not guarantees.
Landlord ↔ Tenant lean methodology
- Overall (STATE)
- 91 Strongly Landlord-Friendly
- State Idaho
- 91 Strongly Landlord-Friendly · R+18
- County
- — inherits STATE
- City
- — inherits STATE
ZIP-level market 83616-6781
- Active inventory
- 1
- Price-to-rent
- 20.9×
Monthly cashflow live
- Estimated rent
- $7,384 medium interval (Pro) →
- Mortgage (P&I)
- −$9,702
- Tax from tax record
- −$394 /mo · $4,733/yr
- Insurance
- −$771
- HOA
- −$125
- Vacancy / Maint / Mgmt
- −$1,551
- Net cashflow
- $-5,158
Break-even live
UW: 25.0% down · 7.5% · 30yr · 1.5% tax · 5.0% vac · 8.0% maint · 8.0% mgmt
Financing live
Cash to close
- Down payment
- $462,500
- Closing costs
- $55,500
- Reserves months
- —
- Total cash needed
- —
Loan-product check · same deal, 3 products live
Conventional
25% down · 7.5% · 30yr
- Down + closing
- —
- Monthly P&I
- —
- Monthly cashflow
- —
- DSCR
- —
- Eligible?
- —
Personal DTI + credit; lowest rate.
DSCR
20% down · 8.5% · 30yr
- Down + closing
- —
- Monthly P&I
- —
- Monthly cashflow
- —
- DSCR
- —
- Eligible?
- —
No personal income docs; deal must DSCR.
Hard money
10% down · 12.0% · 12mo
- Down + closing
- —
- Monthly P&I
- —
- Monthly cashflow
- —
- DSCR
- —
- Eligible?
- —
Short-term bridge; refi at stabilization.
Rent comps 1 comps
| Address | Beds | Baths | Sqft | Rent | $/sqft | DOM | Units | Dist |
|---|---|---|---|---|---|---|---|---|
| 5327 N Red Hills Pl Unit 1460932P Meridian, ID | 5.0 | 2.5 | 3390 | $7,384 | $2.18 | 13d | 1 | 0.89mi |
HOA detail
- Monthly dues
- $125 · $1,500/yr
Listing history 22 events
-
2026-06-18days on market $1,850,000 Active 84 DOM
-
2026-06-17days on market $1,850,000 Active 83 DOM
-
2026-06-16days on market $1,850,000 Active 82 DOM
-
2026-06-15days on market $1,850,000 Active 81 DOM
-
2026-06-13days on market $1,850,000 Active 79 DOM
-
2026-06-10days on market $1,850,000 Active 76 DOM
-
2026-06-09days on market $1,850,000 Active 75 DOM
-
2026-06-08days on market $1,850,000 Active 74 DOM
-
2026-06-07days on market $1,850,000 Active 73 DOM
-
2026-06-03days on market $1,850,000 Active 69 DOM
-
2026-06-03days on market $1,850,000 Active 68 DOM
-
2026-06-01days on market $1,850,000 Active 67 DOM
-
2026-05-31days on market $1,850,000 Active 66 DOM
-
2026-05-14price $1,850,000
-
2026-03-26$1,875,000 Active
-
2025-08-02historical
-
2025-05-16status Active
-
2025-05-15historical
-
2025-05-02$1,899,990 Active
-
2006-06-09soldstatus
-
2006-06-09soldstatus
-
2006-03-20$899,900
ⓘ Source: listings_history table (triggers on properties + properties_extension) + one-shot
backfill from property_details.listing_events for pre-trigger history.
Tax reassessment forecast ID · Resets to sale price
- Current annual tax
- $4,733 · $394/mo
- Projected year-2 tax
- $12,765 · $1,064/mo
- Expected delta
- +$8,032/yr (+$669/mo · 169.7%)
ⓘ Screening estimate from a state-policy table — verify with the county assessor before closing.
Climate risk First Street
- Flood 1/10 Low FEMA zone X (unshaded) · 0% chance over 30 yrs
- Wildfire 4/10 Moderate
- Heat 4/10 Moderate 7 d/yr ≥97°F today · 17 d/yr by 30 yrs out
- Wind 1/10 Low
- Air quality 9/10 Extreme 19 unhealthy d/yr today · 20 by 30 yrs out
Nearby sold comps map
Loading sold comps map…
Walkable amenities ~0.75 mi
Loading nearby amenities…
Taxation est. · year 1
- Rental income
- $88,608
- − Mortgage interest
- −$103,629
- − Property taxes
- −$4,733
- − Insurance
- −$9,250
- − Repairs & maintenance
- −$7,089
- − Management
- −$7,089
- − HOA
- −$1,500
- − Depreciation
- −$53,818
- Taxable loss
- −$98,499
- Est. tax savings @ 24.0%
- +$23,640
- After-tax cash flow
- $-38,262/yr
For passive investors: Depreciation is non-cash, so a rental often shows a tax loss while cash-flowing — sheltering income. Rental losses are passive: they offset passive income freely, and up to $25,000/yr can offset ordinary (W-2) income if you actively participate and your MAGI is under $100k (phasing out to $0 by $150k); unused losses carry forward. On sale, claimed depreciation is recaptured at up to 25%, and gains may owe capital-gains tax (a 1031 exchange can defer both). Figures are a year-1 estimate at your 24.0% rate — not tax advice; consult a CPA.
Schools (NCES district)
- District
- Joint School District No. 2
- NCES district ID
- 1602100
- Math proficiency
- 53% ▼ -6.00%
- Reading proficiency
- 67% ▼ -1.00%
- Median HH income
- $64,573
- Composite
- 52.42/100
- National rank
- #1576
- State rank
- #11 of 92 in ID
Livability — Eagle
- Score
- 78/100
- State rank
- #18
- US rank
- #2702
Category grades
Schools grade is shown separately in the Schools card above.
Census & demographics
- Census place
- Eagle, ID
Population outlook (Ada County) Hauer SSP2
- Today (2025)
- 535,818 people
- By 2030
- 585,751 · +9.3%
- By 2040
- 682,435 · +27.4%
- By 2050
- 775,818 · +44.8%
- By 2075
- 994,458 · +85.6%
- By 2100
- 1,148,884 · +114.4%
Not yet ingested
- Political lean
- —
- Race & ethnicity
- —
- Common origin
- —
- Civics
- —
Market trends
- HPI YoY
- —
- Current HPI
- —
- Rent YoY
- —
- Metro
- —
- State GDP YoY
- ▲ 4.51%
- F500 in state
- 6
Industry mix (Fortune 500 HQ in ID)
| Industry | F500 HQs | Revenue |
|---|---|---|
| Retail | 1 | $79B |
|
||
| Technology | 1 | $25B |
|
||
| Food / Agriculture | 1 | $6B |
|
||
Price history
+105.6% since first listed9 events — show timeline
- 2026-05-14 Price Changed $1,850,000 IMLS
- 2026-03-26 Listed $1,875,000 IMLS
- 2025-08-02 Listing Removed — IMLS
- 2025-05-16 Relisted — IMLS
- 2025-05-15 Listing Removed — IMLS
- 2025-05-02 Listed $1,899,990 IMLS
- 2006-06-09 Sold (Public Records) — Public Records
- 2006-06-09 Sold (MLS) — IMLS
- 2006-03-20 Listed $899,900 IMLS
Property tax history
-0.7%/yrLatest (2025): $4,733 · -11.1% YoY. Source: county tax records.
Cash-flow waterfall
monthlySold comps — $/sqft
last 12 mo · ≤1 miLoading sold comps…