9524 SW 25th St · Oklahoma City, OK
Flood risk 1/10 · Minimal
- FEMA flood zone
- X (unshaded)
- Chance of flooding over 30 yrs
- 0.0%
- Est. flood insurance / yr
- $507 – $1,088
Fire risk 4/10 · Minor
- Est. fire insurance / yr
- $2,463 – $4,575
Heat risk 6/10 · Moderate
- Hot days now (above 106°F)
- 7 days/yr
- Hot days in 30 yrs
- 20 days/yr
Wind risk 2/10 · Minimal
- Chance of severe wind over 30 yrs
- 4.0%
Air-quality risk 1/10 · Minimal
- Unhealthy air days now
- 0 days/yr
- Unhealthy air days in 30 yrs
- 0 days/yr
Risk factors via First Street. Map © Google.
Why this score? — see what drove the D grade
The composite is a weighted blend of 9 inputs, each scored 0–100. Each bar is that input's sub-score; the figure is the points it added to the 100-point composite (weight × sub-score).
- Cash flow +10.1/30.0
- ARV discount +7.2/15.0
- Appreciation +5.4/10.0
- Livability +4.0/5.0
- Schools +3.1/10.0
- DSCR +2.9/10.0
- 1% rule +2.7/10.0
- Rent growth +2.5/5.0
- Condition / age +2.5/5.0
$189,000
🖨 Deal sheet (PDF) 📄 Offer letter ✓ Due diligence
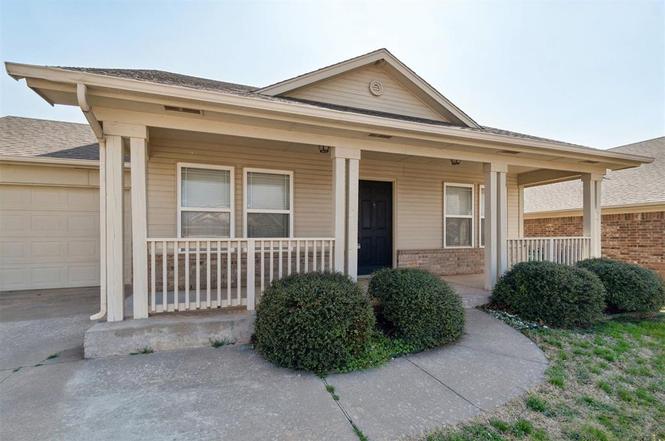
Listing remarks
One of a very limited 2 bed 2 bath homes in the Fountain Grass addition. Located within MUSTANG SCHOOL district, this home has new carpet, a wonderful front porch, an open living/dining concept with lots of natural light. The galley kitchen has black appliances with an electric cook range, tiled backsplash and stained wood cabinets. The neighborhood is very welcoming and includes walking trails, large open park, and multiple ponds, all along Mustang Creek, perfect for evening strolls, morning exercise, or enjoying time outdoors.
Key facts
- Black appliances
- Galley kitchen
- Tiled backsplash
Tags
Property features AI
Finance
- Other: Property listed as residential use in Fountaingrass Addition Section 3
- HOA & community: Mandatory association dues; Association fee of $215 (includes greenbelt and common area maintenance)
Exterior
- Parking: 1-car garage
- Utilities: Homestead exemption eligible
- Home design: Single family residence; One-level home; North-facing
- Construction: Brick and frame construction; Composition roof; Slab foundation; Built as existing property
- Exterior features: Covered porch; Open patio; Rain gutters; Wood fencing; Interior lot
Interior
- Kitchen: Free-standing electric range
- Bedrooms: 2 bedrooms
- Flooring: Carpet; Tile
- Bathrooms: 2 full bathrooms
- Interior features: Dishwasher; Disposal; Microwave; Carpet flooring; Tile flooring
Neighborhood map
What this means for you Summary
Snapshot
- This is a 2-bed/2.0-bath single-family listed at $189k.
Deal economics
- At list price, monthly cash flow is $-111 ($-1k/yr) — negative.
- To cash-flow at today's rent, offer at most $169k (10.4% below list).
- To meet the 1% rule (rent ≥ 1% of price), the offer needs to be $146k (22.8% below list).
- Recommended offer: $146k (22.8% below list) — sets the bar for 1% rule.
- Cap rate 5.6% vs local median 3.7% in Oklahoma City — top-decile yield for the area; either an underpriced asset or a hidden risk that comps aren't pricing in. Stress-test before assuming the spread holds.
Location & tenants
- Location reads 80/100 on livability (#3 in OK, #1,635 nationally) — a professional / high-income tenant draw. Strengths: amenities A+, commute A+, cost of living A+; Watch: crime F.
- Mustang (suburban): math 35% / reading 33% proficiency, ranked #28 of 270 in OK (top 10%) — families likely to look elsewhere, expect single-tenant / working-renter base with shorter leases.
- Zoned schools: Mustang Valley Es (math 50% / reading 40%, grade D-, #60 of 845 statewide, top 7%, 652 students, 0% FRL); Canyon Ridge Ies (math 43% / reading 36%, grade F, #8 of 345 statewide, top 2%, 749 students, 0% FRL); Mustang Hs (math 28% / reading 39%, grade F, #65 of 447 statewide, top 14%, 3,756 students, 0% FRL) — zoned schools average 0% FRL vs 28% district-wide (28 pts lower); this property's tenant base skews higher-income than the district average.
- Market conditions: 41 active listings in the ZIP; 17 comparable units currently listed for rent nearby; rentals at typical pace (median 23d on market — plan ~3-4 weeks tenant-placement turnaround); 260 units permitted in Canadian County in 2024 (0 in 5+ unit buildings).
Forward outlook
- In year one you build about $3k of equity ($1k loan paydown + $1k appreciation (0.7% local appreciation)).
- Canadian County population projected at +64% by 2050 — long-run rental-demand tailwind backs the buy-and-hold thesis.
Negotiation context
- It's been on market 45 days — a 3% lower offer ($183k) is reasonable based on typical stale-listing flexibility.
- 3 sale attempts since 16y ago with the ask held roughly flat each time — persistent listings suggest the price (not the market) is what's stuck; bring a comps-based counter.
Risks & watch-outs
- Climate carrying-cost: extreme-heat days projected 7→20/yr by 2055 (HVAC capex compounding) — expect insurance premiums to compound above CPI over the hold.
Questions for the listing agent
- What do current leases actually rent for vs. the listed asking? Can we see a recent rent roll and the last 12 months of T-12 income?
- It's been on market 45 days. Have you received any prior offers? Is the seller open to a 23% concession, seller financing, or rate buy-down credit?
- What does the HOA fee cover, when was the last increase, and are there any pending special assessments or reserve-fund shortfalls?
- Is there a deadline driving the sale (1031 exchange, divorce, estate, relocation)? That informs how much negotiation room exists.
- Schools are F-rated, which usually means shorter tenancies and higher turnover. Who's the typical renter profile here, and what's been the actual vacancy rate?
- Crime grade is F in this area — have there been break-ins, vandalism, or insurance claims at this property in the last 3 years? What carrier currently insures it and at what premium?
- The area grade is low — what's the realistic commute time and amenity access for the typical tenant pool here? Any planned neighborhood developments (good or bad) we should know about?
- What's the average days-on-market for RENTAL listings here right now (not sales)? A rising rental-DOM trend means longer vacancies and softer asking-rent achievability than the comps imply.
- What's the recent tenant-quality profile in this submarket — average credit score on applications, eviction rate, late-payment / NSF rate, and stable-employment percentage? A property-management company in the area should have these aggregated.
- How much new for-sale + rental construction is in the pipeline within 1–3 miles? Heavy new supply typically softens prices + rents 12–24 months out; constrained supply supports both.
Investment metrics
- 1% rule
- 0.77% ✗
- Cap rate
- 5.59%
- Cash-on-cash
- -2.52%
- DSCR
- 0.89
- GRM
- 10.8
CMA / ARV
- ARV (on-the-fly)
- $187,775
- Comps found
- 6
Show comp detail 6 sales within ~0.75 mi
| Address | Dist | Beds/Ba | Sqft | Sold | Price | $/sf | Match |
|---|---|---|---|---|---|---|---|
| 9524 SW 25th St | 0.00mi | 2/2.0 | 1,015 (0%) | 1mo | $188,000 | $185 | 99 |
| 2909 Fennel Rd | 0.23mi | 2/2.0 | 1,015 (0%) | 6mo | $185,000 | $182 | 84 |
| 9525 SW 25th St | 0.03mi | 3/2.0 (+1) | 1,083 (+7%) | 4mo | $172,000 | $159 | 79 |
| 2501 Flame Lily Rd | 0.26mi | 3/2.0 (+1) | 1,091 (+8%) | 2mo | $205,000 | $188 | 68 |
| 2820 Fountaingrass Rd | 0.17mi | 3/2.0 (+1) | 1,117 (+10%) | 7mo | $210,000 | $188 | 65 |
| 2701 Fennel Rd | 0.15mi | 3/2.0 (+1) | 1,083 (+7%) | 21mo | $200,000 | $185 | 60 |
Match score weights: distance 35% · size 25% · config 20% · recency 20%. Top-matched comps best support the ARV.
Projected returns pro-forma
0.73% appreciation · 3.0% rent growth · sell at horizon
- IRR
- -2.3%
- Equity multiple
- 0.89×
- Total profit
- $-6,003
- Equity at exit
- $61,924
- IRR
- 2.9%
- Equity multiple
- 1.34×
- Total profit
- $18,145
- Equity at exit
- $80,318
Cash invested: $52,920 (down + closing). Projections, not guarantees.
Landlord ↔ Tenant lean methodology
- Overall (STATE)
- 83 Strongly Landlord-Friendly
- State Oklahoma
- 83 Strongly Landlord-Friendly · R+20
- County
- — inherits STATE
- City
- — inherits STATE
ZIP-level market 73128
- Home prices YoY
- 0.3%
- Active inventory
- 41
- Price-to-rent
- 10.8×
Monthly cashflow live
- Estimated rent
- $1,460 high interval (Pro) →
- Mortgage (P&I)
- −$991
- Tax from tax record
- −$176 /mo · $2,118/yr
- Insurance
- −$79
- HOA
- −$18
- Vacancy / Maint / Mgmt
- −$307
- Net cashflow
- $-111
Break-even live
Sensitivity live
| Price | -10% $-4 | -5% $-58 | +0% $-111 | +5% $-165 | +10% $-218 |
|---|---|---|---|---|---|
| Rent | -10% $-227 | -5% $-169 | +0% $-111 | +5% $-54 | +10% $4 |
| Rate | -1.0pp $-16 | -0.5pp $-63 | base $-111 | +0.5pp $-160 | +1.0pp $-210 |
UW: 25.0% down · 7.5% · 30yr · 1.5% tax · 5.0% vac · 8.0% maint · 8.0% mgmt
Financing live
Cash to close
- Down payment
- $47,250
- Closing costs
- $5,670
- Reserves months
- —
- Total cash needed
- —
Loan-product check · same deal, 3 products live
Conventional
25% down · 7.5% · 30yr
- Down + closing
- —
- Monthly P&I
- —
- Monthly cashflow
- —
- DSCR
- —
- Eligible?
- —
Personal DTI + credit; lowest rate.
DSCR
20% down · 8.5% · 30yr
- Down + closing
- —
- Monthly P&I
- —
- Monthly cashflow
- —
- DSCR
- —
- Eligible?
- —
No personal income docs; deal must DSCR.
Hard money
10% down · 12.0% · 12mo
- Down + closing
- —
- Monthly P&I
- —
- Monthly cashflow
- —
- DSCR
- —
- Eligible?
- —
Short-term bridge; refi at stabilization.
Rent comps 17 comps
| Address | Beds | Baths | Sqft | Rent | $/sqft | DOM | Units | Dist |
|---|---|---|---|---|---|---|---|---|
| 2704 Fennel Rd Oklahoma City, OK | 3.0 | 2.0 | 1206 | $1,500 | $1.24 | 16d | 1 | 0.16mi |
| 9612 SW 23rd St Oklahoma City, OK | 3.0 | 2.0 | 1250 | $1,525 | $1.22 | 25d | 1 | 0.23mi |
| 9612 SW 23rd St Oklahoma City, OK | 3.0 | 2.0 | 1250 | $1,525 | $1.22 | 23d | 1 | 0.23mi |
| 9608 SW 29th Ter Oklahoma City, OK | 2.0 | 2.0 | 1015 | $1,350 | $1.33 | 16d | 1 | 0.25mi |
| 2500 Flame Lily Rd Oklahoma City, OK | 3.0 | 2.0 | 1233 | $1,525 | $1.24 | 25d | 1 | 0.25mi |
| 2500 Flame Lily Rd Oklahoma City, OK | 3.0 | 2.0 | 1215 | $1,495 | $1.23 | 13d | 1 | 0.25mi |
| 2525 Northcreek Ln Oklahoma City, OK | 2.0 | 2.0 | 1250 | $1,525 | $1.22 | 21d | 1 | 0.28mi |
| 9921 SW 25th St Yukon, OK | 3.0 | 2.0 | 1471 | $1,599 | $1.09 | 25d | 1 | 0.47mi |
| 1720 W Palm Pl Oklahoma City, OK | 3.0 | 2.0 | 1348 | $1,345 | $1.00 | 5d | 1 | 0.62mi |
| 10021 SW 21st St Yukon, OK | 3.0 | 2.0 | 1482 | $1,800 | $1.21 | 25d | 1 | 0.69mi |
| 1700 Riviera Ln Unit 1700R Oklahoma City, OK | 3.0 | 2.0 | 1192 | $1,395 | $1.17 | 25d | 1 | 0.70mi |
| 1517 Chisholm Springs Blvd Oklahoma City, OK | 3.0 | 2.0 | 1434 | $1,294 | $0.90 | 13d | 1 | 0.80mi |
| 9717 SW 40th St Oklahoma City, OK | 3.0 | 2.0 | 1152 | $1,279 | $1.11 | 3d | 1 | 1.01mi |
| 10316 Glascow Dr Yukon, OK | 3.0 | 2.0 | 1312 | $1,699 | $1.29 | 6d | 1 | 1.29mi |
| 8913 SW 42nd St Oklahoma City, OK | 3.0 | 2.0 | 1492 | $1,850 | $1.24 | 25d | 1 | 1.36mi |
| 1417 Edinburg Dr Yukon, OK | 3.0 | 2.0 | 1380 | $1,425 | $1.03 | 23d | 1 | 1.46mi |
| 9207 SW 47th St Oklahoma City, OK | 3.0 | 2.0 | 1340 | $1,600 | $1.19 | 25d | 1 | 1.48mi |
HOA detail
- Monthly dues
- $18 · $216/yr
- Likely covers
- electric
Listing history 10 events
-
2026-04-27status Pending
-
2026-03-13$189,000 Active
-
2023-09-27historical $1,295
-
2023-09-15price $1,295
-
2023-08-24$1,345
-
2022-07-08price $1,295
-
2014-03-06soldstatus $660,000
-
2012-03-04historical
-
2010-09-28soldstatus $92,000
-
2010-03-03$118,778
ⓘ Source: listings_history table (triggers on properties + properties_extension) + one-shot
backfill from property_details.listing_events for pre-trigger history.
Tax reassessment forecast OK · Resets to sale price
- Current annual tax
- $2,118 · $176/mo
- Projected year-2 tax
- $2,118 · $176/mo
- Expected delta
- $0/yr ($0/mo · 0.0%)
ⓘ Screening estimate from a state-policy table — verify with the county assessor before closing.
Climate risk First Street
- Flood 1/10 Low FEMA zone X (unshaded) · 0% chance over 30 yrs
- Wildfire 4/10 Moderate
- Heat 6/10 Major 7 d/yr ≥106°F today · 20 d/yr by 30 yrs out
- Wind 2/10 Low 4% chance of damaging wind over 30 yrs
- Air quality 1/10 Low 0 unhealthy d/yr today · 0 by 30 yrs out
Nearby sold comps map
Loading sold comps map…
Walkable amenities ~0.75 mi
Loading nearby amenities…
Taxation est. · year 1
- Rental income
- $17,515
- − Mortgage interest
- −$10,587
- − Property taxes
- −$2,118
- − Insurance
- −$945
- − Repairs & maintenance
- −$1,401
- − Management
- −$1,401
- − HOA
- −$216
- − Depreciation
- −$5,498
- Taxable loss
- −$4,652
- Est. tax savings @ 24.0%
- +$1,116
- After-tax cash flow
- $-220/yr
For passive investors: Depreciation is non-cash, so a rental often shows a tax loss while cash-flowing — sheltering income. Rental losses are passive: they offset passive income freely, and up to $25,000/yr can offset ordinary (W-2) income if you actively participate and your MAGI is under $100k (phasing out to $0 by $150k); unused losses carry forward. On sale, claimed depreciation is recaptured at up to 25%, and gains may owe capital-gains tax (a 1031 exchange can defer both). Figures are a year-1 estimate at your 24.0% rate — not tax advice; consult a CPA.
Schools (NCES district)
- District
- Mustang
- NCES district ID
- 4021000
- Math proficiency
- 35% ▼ -10.00%
- Reading proficiency
- 33% ▼ -7.00%
- Median HH income
- $67,559
- Composite
- 31.21/100
- National rank
- #6038
- State rank
- #28 of 270 in OK
Livability — Oklahoma City
- Score
- 80/100
- State rank
- #3
- US rank
- #1635
Category grades
Schools grade is shown separately in the Schools card above.
Census & demographics
- Census place
- Oklahoma City, OK
- County
- Oklahoma County · 771,644 people
- City population
- 498,656
- Metro
- Oklahoma City, OK
- Population (ZIP)
- 6,281
- Household income
- $74,241
- Rent vs Own
- Severe rent burden
- 201.0
Population outlook (Canadian County) Hauer SSP2
- Today (2025)
- 174,062 people
- By 2030
- 195,170 · +12.1%
- By 2040
- 239,293 · +37.5%
- By 2050
- 285,457 · +64.0%
- By 2075
- 403,766 · +132.0%
- By 2100
- 498,766 · +186.5%
Race, ethnicity, and origin ACS 2023
- Neighborhood character
- Highly diverse neighborhood (Simpson 0.71)
- Race & ethnicity
- White 46% Hispanic / Latino 22% Two or more races 15% Asian 14% Black 10% Native American 3%
- Hispanic origin (detail)
- Mexican 14% Puerto Rican 7%
- Common ancestry
- Iranian 2% Lithuanian 2% Russian 2%
- Foreign-born
- 13% · Canada, Vietnam, South Korea
- Languages at home
- 78% English-only · Spanish 11% Other Asian/Pacific 5% Vietnamese 4%
Political lean MEDSL · Canadian
- 2024 margin
- Solid R (+40.4) · D 28.8% · R 69.2% · Other 2.0%
- 2008→2024 swing
- +11.9pp toward D · 2008: -52.2pp · 2024: -40.4pp
- All cycles
- 2024: R+40.4 2020: R+43.3 2016: R+51.2 2012: R+54.4 2008: R+52.2
Not yet ingested
- Civics
- —
Market trends
- HPI YoY
- ▲ 0.73%
- Current HPI
- 214.9222
- Rent YoY
- —
- Metro
- Oklahoma City, OK
- State GDP YoY
- ▲ 1.55%
- F500 in state
- 6
Industry mix (Fortune 500 HQ in OK)
| Industry | F500 HQs | Revenue |
|---|---|---|
| Energy | 3 | $48B |
|
||
Price history
+59.1% since first listed10 events — show timeline
- 2026-04-27 Pending — MLSOK
- 2026-03-13 Listed $189,000 MLSOK
- 2023-09-27 Rental Removed $1,295 APPFOLIO
- 2023-09-15 Price Changed $1,295 APPFOLIO
- 2023-08-24 Listed for Rent $1,345 APPFOLIO
- 2022-07-08 Price Changed $1,295 APPFOLIO
- 2014-03-06 Sold (Public Records) $660,000 Public Records
- 2012-03-04 Listing Removed — MLSOK
- 2010-09-28 Sold (Public Records) $92,000 Public Records
- 2010-03-03 Listed $118,778 MLSOK
Property tax history
+4.4%/yrLatest (2025): $2,118 · +6.3% YoY. Source: county tax records.
Cash-flow waterfall
monthlySold comps — $/sqft
last 12 mo · ≤1 miLoading sold comps…