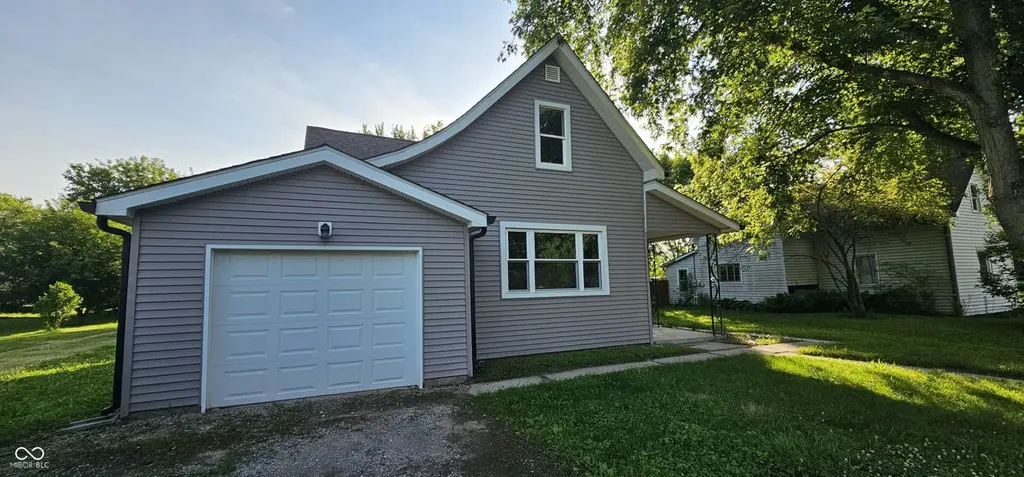
8429 N Nashville Rd · Warrington, IN
Flood risk 1/10 · Minimal
- FEMA flood zone
- X (unshaded)
- Chance of flooding over 30 yrs
- 0.0%
- Est. flood insurance / yr
- $507 – $1,088
Fire risk 1/10 · Minimal
- Est. fire insurance / yr
- $717 – $1,331
Heat risk 3/10 · Minor
- Hot days now (above 100°F)
- 7 days/yr
- Hot days in 30 yrs
- 18 days/yr
Wind risk 2/10 · Minimal
- Chance of severe wind over 30 yrs
- 1.0%
Air-quality risk 2/10 · Minimal
- Unhealthy air days now
- 1 days/yr
- Unhealthy air days in 30 yrs
- 3 days/yr
Risk factors via First Street. Map © Google.
Why this score? — see what drove the D grade
The composite is a weighted blend of 9 inputs, each scored 0–100. Each bar is that input's sub-score; the figure is the points it added to the 100-point composite (weight × sub-score).
- Cash flow +16.3/30.0
- ARV discount +7.5/15.0
- DSCR +5.0/10.0
- Schools +4.3/10.0
- 1% rule +3.4/10.0
- Rent growth +2.5/5.0
- Livability +2.5/5.0
- Condition / age +2.5/5.0
- Appreciation +0.0/10.0
$169,000
🖨 Deal sheet (PDF) 📄 Offer letter ✓ Due diligence
Listing remarks MLS
A lovely 2 stories 3 bedrooms 1 bath 1536 sqft
Key facts
- Fresh paint
- New flooring
- Updated kitchen
Tags
Property features AI
Exterior
- Parking: Attached garage (1 car)
- Security: Smoke detector(s)
- Utilities: Private water (well); Septic system; 100 amp electric service; Leased propane
- Home design: Single family residence; Two levels
- Construction: Vinyl siding exterior; Brick foundation
- Exterior features: Covered patio; Patio; Partial fencing; Yard enclosed by partial fence
Interior
- Kitchen: Dishwasher; Microwave with hood; Electric oven; Refrigerator; Pantry
- Bedrooms: Three bedrooms on the upper level (total 3 bedrooms)
- Flooring: Luxury vinyl plank in dining room and kitchen
- Bathrooms: One full bathroom
- Heating & cooling: Forced air heating; Central air conditioning
- Interior features: Pantry; Smoke detector(s)
- Laundry & utility: Laundry closet
Neighborhood map
What this means for you Summary
Snapshot
- This is a 3-bed/1.0-bath single-family listed at $169k.
Deal economics
- At list price, monthly cash flow is $93 ($1k/yr) — positive.
- The deal already cash-flows at list — no discount required.
- To meet the 1% rule (rent ≥ 1% of price), the offer needs to be $142k (16.2% below list).
- Recommended offer: $142k (16.2% below list) — sets the bar for 1% rule.
Location & tenants
- Location reads: area grade D — affects rentability + tenant quality, not the cash-flow math above.
- Eastern Hancock County Community School Corporation (rural): math 48% / reading 50% proficiency, ranked #49 of 301 in IN (top 16%) — families likely to look elsewhere, expect single-tenant / working-renter base with shorter leases.
- Zoned schools: Eastern Hancock Elementary School (math 57% / reading 47%, grade C-, #237 of 994 statewide, top 26%, 533 students, 32% FRL); Eastern Hancock Middle School (math 38% / reading 44%, grade F, #113 of 330 statewide, top 35%, 268 students, 35% FRL); Eastern Hancock High School (math 52% / reading 72%, grade B-, #41 of 369 statewide, top 12%, 378 students, 31% FRL).
- Market conditions: 14 active listings in the ZIP; 1,091 units permitted in Hancock County in 2024 (0 in 5+ unit buildings).
Forward outlook
- Local home prices are declining (-3.0%/yr); year-one equity from $1k of loan paydown is wiped out by about $5k of value loss. Plan a longer hold.
- Hancock County population projected at +7% by 2050 — modest demand growth; plan on rents tracking national, not racing it.
Negotiation context
- It's been on market 17 days — a 2% lower offer ($166k) is reasonable based on typical stale-listing flexibility.
- 2 sale attempts since 3y ago with the ask held roughly flat each time — persistent listings suggest the price (not the market) is what's stuck; bring a comps-based counter.
- Current owner paid $40k; list at $169k implies a 322% gain — meaningful room to come down on a strong offer.
Risks & watch-outs
- Watch-outs: built in 1900 — expect roof / HVAC / electrical / plumbing capex.
Questions for the listing agent
- Built in 1900 — when were the roof, HVAC, electrical panel, plumbing, and water heater last replaced?
- Is there a deadline driving the sale (1031 exchange, divorce, estate, relocation)? That informs how much negotiation room exists.
- The area grade is low — what's the realistic commute time and amenity access for the typical tenant pool here? Any planned neighborhood developments (good or bad) we should know about?
- What's the average days-on-market for RENTAL listings here right now (not sales)? A rising rental-DOM trend means longer vacancies and softer asking-rent achievability than the comps imply.
- What's the recent tenant-quality profile in this submarket — average credit score on applications, eviction rate, late-payment / NSF rate, and stable-employment percentage? A property-management company in the area should have these aggregated.
- How much new for-sale + rental construction is in the pipeline within 1–3 miles? Heavy new supply typically softens prices + rents 12–24 months out; constrained supply supports both.
Investment metrics
- 1% rule
- 0.84% ✗
- Cap rate
- 6.95%
- Cash-on-cash
- 2.35%
- DSCR
- 1.10
- GRM
- 9.9
CMA / ARV
- ARV (on-the-fly)
- $36,864
- Comps found
- 1
Show comp detail 1 sale within ~0.75 mi
| Address | Dist | Beds/Ba | Sqft | Sold | Price | $/sf | Match |
|---|---|---|---|---|---|---|---|
| 8345 N State Road 109 | 0.13mi | 2/1.0 (-1) | 1,482 (-4%) | 9mo | $35,000 | $24 | 76 |
Match score weights: distance 35% · size 25% · config 20% · recency 20%. Top-matched comps best support the ARV.
Projected returns pro-forma
-3.0% appreciation · 3.0% rent growth · sell at horizon
- IRR
- -12.6%
- Equity multiple
- 0.54×
- Total profit
- $-21,543
- Equity at exit
- $25,198
- IRR
- -3.6%
- Equity multiple
- 0.76×
- Total profit
- $-11,420
- Equity at exit
- $14,612
Cash invested: $47,320 (down + closing). Projections, not guarantees.
Landlord ↔ Tenant lean methodology
- Overall (STATE)
- 90 Strongly Landlord-Friendly
- State Indiana
- 90 Strongly Landlord-Friendly · R+11
- County
- — inherits STATE
- City
- — inherits STATE
ZIP-level market 46186
- Home prices YoY
- -14.5%
- Active inventory
- 14
- Price-to-rent
- 9.9×
Monthly cashflow live
- Estimated rent
- $1,416 medium interval (Pro) →
- Mortgage (P&I)
- −$886
- Tax from tax record
- −$69 /mo · $829/yr
- Insurance
- −$70
- HOA
- −$0
- Vacancy / Maint / Mgmt
- −$297
- Net cashflow
- $93
Break-even live
Sensitivity live
| Price | -10% $188 | -5% $141 | +0% $93 | +5% $45 | +10% $-3 |
|---|---|---|---|---|---|
| Rent | -10% $-19 | -5% $37 | +0% $93 | +5% $149 | +10% $205 |
| Rate | -1.0pp $178 | -0.5pp $136 | base $93 | +0.5pp $49 | +1.0pp $4 |
UW: 25.0% down · 7.5% · 30yr · 1.5% tax · 5.0% vac · 8.0% maint · 8.0% mgmt
Financing live
Cash to close
- Down payment
- $42,250
- Closing costs
- $5,070
- Reserves months
- —
- Total cash needed
- —
Loan-product check · same deal, 3 products live
Conventional
25% down · 7.5% · 30yr
- Down + closing
- —
- Monthly P&I
- —
- Monthly cashflow
- —
- DSCR
- —
- Eligible?
- —
Personal DTI + credit; lowest rate.
DSCR
20% down · 8.5% · 30yr
- Down + closing
- —
- Monthly P&I
- —
- Monthly cashflow
- —
- DSCR
- —
- Eligible?
- —
No personal income docs; deal must DSCR.
Hard money
10% down · 12.0% · 12mo
- Down + closing
- —
- Monthly P&I
- —
- Monthly cashflow
- —
- DSCR
- —
- Eligible?
- —
Short-term bridge; refi at stabilization.
Listing history 11 events
-
2026-06-15status $169,000 Pending 17 DOM
-
2026-06-15days on market $169,000 Active 17 DOM
-
2026-06-13days on market $169,000 Active 15 DOM
-
2026-06-13days on market $169,000 Active 14 DOM
-
2026-06-09days on market $169,000 Active 11 DOM
-
2026-06-08days on market $169,000 Active 10 DOM
-
2026-06-07days on market $169,000 Active 9 DOM
-
2026-06-03days on market $169,000 Active 5 DOM
-
2026-06-02days on market $169,000 Active 4 DOM
-
2026-06-01days on market $169,000 Active 3 DOM
-
2026-05-31days on market $169,000 Active 2 DOM
ⓘ Source: listings_history table (triggers on properties + properties_extension) + one-shot
backfill from property_details.listing_events for pre-trigger history.
Tax reassessment forecast IN · Partial reset (capped growth)
- Current annual tax
- $829 · $69/mo
- Projected year-2 tax
- $1,133 · $94/mo
- Expected delta
- +$304/yr (+$25/mo · 36.6%)
ⓘ Screening estimate from a state-policy table — verify with the county assessor before closing.
Climate risk First Street
- Flood 1/10 Low FEMA zone X (unshaded) · 0% chance over 30 yrs
- Wildfire 1/10 Low
- Heat 3/10 Moderate 7 d/yr ≥100°F today · 18 d/yr by 30 yrs out
- Wind 2/10 Low 100% chance of damaging wind over 30 yrs
- Air quality 2/10 Low 1 unhealthy d/yr today · 3 by 30 yrs out
Nearby sold comps map
Loading sold comps map…
Walkable amenities ~0.75 mi
Loading nearby amenities…
Taxation est. · year 1
- Rental income
- $16,990
- − Mortgage interest
- −$9,467
- − Property taxes
- −$829
- − Insurance
- −$845
- − Repairs & maintenance
- −$1,359
- − Management
- −$1,359
- − Depreciation
- −$4,916
- Taxable loss
- −$1,785
- Est. tax savings @ 24.0%
- +$428
- After-tax cash flow
- $1,542/yr
For passive investors: Depreciation is non-cash, so a rental often shows a tax loss while cash-flowing — sheltering income. Rental losses are passive: they offset passive income freely, and up to $25,000/yr can offset ordinary (W-2) income if you actively participate and your MAGI is under $100k (phasing out to $0 by $150k); unused losses carry forward. On sale, claimed depreciation is recaptured at up to 25%, and gains may owe capital-gains tax (a 1031 exchange can defer both). Figures are a year-1 estimate at your 24.0% rate — not tax advice; consult a CPA.
Schools (NCES district)
- District
- Eastern Hancock County Community School Corporation
- NCES district ID
- 1803120
- Math proficiency
- 48% ▼ -15.00%
- Reading proficiency
- 50% ▼ -7.00%
- Median HH income
- $62,582
- Composite
- 43.16/100
- National rank
- #3071
- State rank
- #49 of 301 in IN
Livability — Warrington
No livability data for this city. (Only ~50 U.S. cities are tracked.)
Census & demographics
- Census place
- Warrington, IN
- Population (ZIP)
- 1,762
Population outlook (Hancock County) Hauer SSP2
- Today (2025)
- 77,820 people
- By 2030
- 79,914 · +2.7%
- By 2040
- 82,734 · +6.3%
- By 2050
- 83,348 · +7.1%
- By 2075
- 82,439 · +5.9%
- By 2100
- 74,181 · -4.7%
Race, ethnicity, and origin ACS 2023
- Neighborhood character
- Predominantly White (97%)
- Race & ethnicity
- White 97% Two or more races 2%
- Common ancestry
- Slovak 1% Serbian 1% Iranian 1%
- Foreign-born
- 0%
- Languages at home
- 99% English-only · German/W. Germanic 1%
Political lean MEDSL · Hancock
- 2024 margin
- Solid R (+33.7) · D 32.2% · R 65.9% · Other 1.9%
- 2008→2024 swing
- -4.1pp toward R · 2008: -29.6pp · 2024: -33.7pp
- All cycles
- 2024: R+33.7 2020: R+37.5 2016: R+44.8 2012: R+41.0 2008: R+29.6
Not yet ingested
- Civics
- —
Market trends
- HPI YoY
- ▼ -44.32%
- Current HPI
- 262.2637
- Rent YoY
- —
- Metro
- —
- State GDP YoY
- ▲ 2.90%
- F500 in state
- 18
Industry mix (Fortune 500 HQ in IN)
| Industry | F500 HQs | Revenue |
|---|---|---|
| Industrial Machinery | 2 | $37B |
|
||
| Healthcare | 1 | $177B |
|
||
| Pharmaceuticals | 1 | $45B |
|
||
| Metals / Steel | 1 | $18B |
|
||
| Agriculture | 1 | $17B |
|
||
| Packaging | 1 | $12B |
|
||
Price history
+90.3% since first listed6 events — show timeline
- 2026-05-29 Listed $169,000 MIBOR as Distributed by MLS Grid
- 2023-04-19 Sold (MLS) $40,000 MIBOR as Distributed by MLS Grid
- 2023-04-08 Pending — MIBOR as Distributed by MLS Grid
- 2023-03-27 Listed $52,900 MIBOR as Distributed by MLS Grid
- 2013-08-23 Sold (Public Records) $39,900 Public Records
- 2003-08-18 Sold (Public Records) $88,800 Public Records
Property tax history
+14.1%/yrLatest (2025): $829 · -0.4% YoY. Source: county tax records.
Cash-flow waterfall
monthlySold comps — $/sqft
last 12 mo · ≤1 miLoading sold comps…