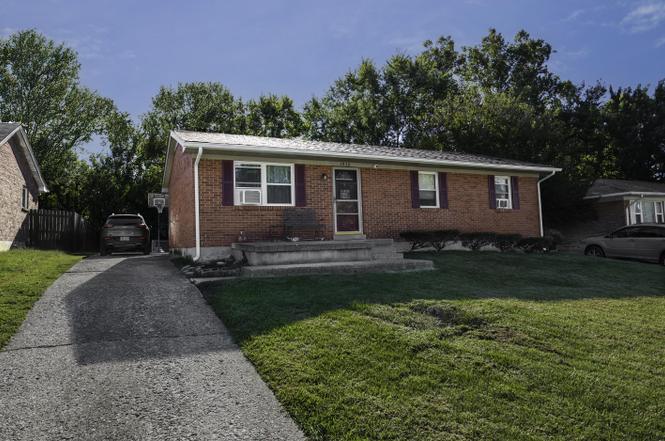
1930 Cobyville Ct · Lexington-Fayette, KY
Flood risk 1/10 · Minimal
- FEMA flood zone
- X (unshaded)
- Chance of flooding over 30 yrs
- 0.0%
- Est. flood insurance / yr
- $507 – $1,088
Fire risk 1/10 · Minimal
- Est. fire insurance / yr
- $839 – $1,559
Heat risk 4/10 · Minor
- Hot days now (above 101°F)
- 7 days/yr
- Hot days in 30 yrs
- 19 days/yr
Wind risk 2/10 · Minimal
- Chance of severe wind over 30 yrs
- 2.0%
Air-quality risk 2/10 · Minimal
- Unhealthy air days now
- 0 days/yr
- Unhealthy air days in 30 yrs
- 2 days/yr
Risk factors via First Street. Map © Google.
Why this score? — see what drove the C grade
The composite is a weighted blend of 9 inputs, each scored 0–100. Each bar is that input's sub-score; the figure is the points it added to the 100-point composite (weight × sub-score).
- Cash flow +23.3/30.0
- ARV discount +11.4/15.0
- DSCR +7.5/10.0
- 1% rule +4.9/10.0
- Rent growth +3.5/5.0
- Schools +3.4/10.0
- Livability +2.5/5.0
- Condition / age +2.5/5.0
- Appreciation +0.0/10.0
$184,900
🖨 Deal sheet 📄 Offer letter ✓ Due diligence
Listing remarks
This 3 bedroom, 1 bath ranch offers comfort and valuable updates! Fresh 2025 improvements include a brand-new roof with warranty, new front gutters, shutters, and a new living room window unit. Enjoy beautiful hardwood floors, a newer water heater, and an inviting layout perfect for everyday living with a nice size kitchen. Step outside to a spacious backyard complete with a basketball goal, an attached storage shed and an enlarged front porch. Home is conveniently located near schools, shopping, and dining. Home warranty will be provided at time of closing!
Key facts
- All-brick ranch
- Extended front porch
- Large backyard
Tags
Neighborhood map
What this means for you Summary
Snapshot
- This is a 3-bed/1.0-bath single-family listed at $185k.
Deal economics
- At list price, monthly cash flow is $337 ($4k/yr) — positive.
- The deal already cash-flows at list — no discount required.
- To meet the 1% rule (rent ≥ 1% of price), the offer needs to be $183k (1.0% below list).
- Recommended offer: $163k (12.0% below list) — sets the bar for market timing.
- Cap rate 8.5% vs local median 3.8% in Lexington-Fayette — top-decile yield for the area; either an underpriced asset or a hidden risk that comps aren't pricing in. Stress-test before assuming the spread holds.
Location & tenants
- Location reads: area grade C — affects rentability + tenant quality, not the cash-flow math above.
- Fayette County (urban): math 35% / reading 45% proficiency, ranked #27 of 165 in KY (top 16%) — families likely to look elsewhere, expect single-tenant / working-renter base with shorter leases.
- Zoned schools: Mary Todd Elementary School (math 17% / reading 27%, grade F, #525 of 676 statewide, top 82%, 382 students, 77% FRL); Winburn Middle School (math 26% / reading 36%, grade F, #138 of 217 statewide, top 65%, 800 students, 66% FRL); Bryan Station High School (math 18% / reading 25%, grade F, #209 of 254 statewide, top 82%, 1,893 students, 59% FRL) — zoned schools average 67% FRL vs 44% district-wide (23 pts higher); higher-poverty schools than district average — tighter screening recommended.
- Zoned-school proficiency averages 25% at this address vs 40% district-wide (-15 pts) — the specific schools serving this property underperform the Fayette County average; the district grade overstates school quality for this exact location.
- Market conditions: Rents rising (+3.9%/yr); 203 active listings in the ZIP; 6 comparable units currently listed for rent nearby; rentals at typical pace (median 24d on market — plan ~3-4 weeks tenant-placement turnaround); solid renter incomes; 1,036 units permitted in Fayette County in 2024 (542 in 5+ unit buildings).
Forward outlook
- Local home prices are declining (-3.0%/yr); year-one equity from $1k of loan paydown is wiped out by about $6k of value loss. Plan a longer hold.
- Fayette County population projected at +35% by 2050 — long-run rental-demand tailwind backs the buy-and-hold thesis.
Negotiation context
- It's been on market 171 days — a 12% lower offer ($163k) is reasonable based on typical stale-listing flexibility.
Questions for the listing agent
- It's been on market 171 days. Have you received any prior offers? Is the seller open to a 12% concession, seller financing, or rate buy-down credit?
- Built in 1972 — when were the roof, HVAC, electrical panel, plumbing, and water heater last replaced?
- Why hasn't it sold? Are there any deal-killer items the seller is aware of (foundation, flood, title, zoning, code violations)?
- Is there a deadline driving the sale (1031 exchange, divorce, estate, relocation)? That informs how much negotiation room exists.
- What's the average days-on-market for RENTAL listings here right now (not sales)? A rising rental-DOM trend means longer vacancies and softer asking-rent achievability than the comps imply.
- What's the recent tenant-quality profile in this submarket — average credit score on applications, eviction rate, late-payment / NSF rate, and stable-employment percentage? A property-management company in the area should have these aggregated.
- How much new for-sale + rental construction is in the pipeline within 1–3 miles? Heavy new supply typically softens prices + rents 12–24 months out; constrained supply supports both.
Investment metrics
- 1% rule
- 0.99% ✗
- Cap rate
- 8.48%
- Cash-on-cash
- 7.81%
- DSCR
- 1.35
- GRM
- 8.4
CMA / ARV
- ARV (on-the-fly)
- $202,650
- Comps found
- 11
Show comp detail 11 sales within ~0.75 mi
| Address | Dist | Beds/Ba | Sqft | Sold | Price | $/sf | Match |
|---|---|---|---|---|---|---|---|
| 1840 Costigan Dr | 0.32mi | 3/1.5 | 1,050 (0%) | 3mo | $150,000 | $143 | 81 |
| 1667 Costigan Dr | 0.25mi | 3/1.0 | 1,025 (-2%) | 11mo | $198,000 | $193 | 75 |
| 1732 Costigan Dr | 0.33mi | 3/1.0 | 1,025 (-2%) | 12mo | $188,000 | $183 | 70 |
| 1876 Barksdale Dr | 0.33mi | 3/1.0 | 1,107 (+5%) | 14mo | $195,000 | $176 | 64 |
| 1246 Winburn Dr | 0.39mi | 3/1.5 | 1,150 (+10%) | 8mo | $205,000 | $178 | 57 |
| 804 Farra Ct | 0.68mi | 3/1.5 | 1,100 (+5%) | 6mo | $160,000 | $145 | 53 |
| 642 Hyden Ct | 0.67mi | 3/2.0 | 1,143 (+9%) | 3mo | $230,000 | $201 | 48 |
| 788 Burgess Ave | 0.55mi | 3/2.0 | 1,200 (+14%) | 4mo | $236,500 | $197 | 44 |
| 545 Asbury Ln | 0.74mi | 4/2.0 (+1) | 1,190 (+13%) | 3mo | $230,000 | $193 | 32 |
| 764 Harrison Trce | 0.68mi | 2/2.0 (-1) | 1,203 (+15%) | 9mo | $272,150 | $226 | 27 |
| 768 Harrison Trce | 0.73mi | 2/2.0 (-1) | 1,203 (+15%) | 21mo | $269,900 | $224 | 15 |
Match score weights: distance 35% · size 25% · config 20% · recency 20%. Top-matched comps best support the ARV.
Projected returns pro-forma
-3.0% appreciation · 3.94% rent growth · sell at horizon
- IRR
- -3.5%
- Equity multiple
- 0.87×
- Total profit
- $-6,826
- Equity at exit
- $27,569
- IRR
- 7.1%
- Equity multiple
- 1.55×
- Total profit
- $28,695
- Equity at exit
- $15,987
Cash invested: $51,772 (down + closing). Projections, not guarantees.
Landlord ↔ Tenant lean methodology
- Overall (STATE)
- 83 Strongly Landlord-Friendly
- State Kentucky
- 83 Strongly Landlord-Friendly · R+16
- County
- — inherits STATE
- City
- — inherits STATE
ZIP-level market 40511
- Home prices YoY
- -26.9%
- Rents YoY
- 3.9%
- Active inventory
- 203
- Price-to-rent
- 8.4×
Monthly cashflow live
- Estimated rent
- $1,830 high interval (Pro) →
- Mortgage (P&I)
- −$970
- Tax from tax record
- −$62 /mo · $749/yr
- Insurance
- −$77
- HOA
- −$0
- Vacancy / Maint / Mgmt
- −$384
- Net cashflow
- $337
Break-even live
UW: 25.0% down · 7.5% · 30yr · 1.5% tax · 5.0% vac · 8.0% maint · 8.0% mgmt
Financing live
Cash to close
- Down payment
- $46,225
- Closing costs
- $5,547
- Reserves months
- —
- Total cash needed
- —
Loan-product check · same deal, 3 products live
Conventional
25% down · 7.5% · 30yr
- Down + closing
- —
- Monthly P&I
- —
- Monthly cashflow
- —
- DSCR
- —
- Eligible?
- —
Personal DTI + credit; lowest rate.
DSCR
20% down · 8.5% · 30yr
- Down + closing
- —
- Monthly P&I
- —
- Monthly cashflow
- —
- DSCR
- —
- Eligible?
- —
No personal income docs; deal must DSCR.
Hard money
10% down · 12.0% · 12mo
- Down + closing
- —
- Monthly P&I
- —
- Monthly cashflow
- —
- DSCR
- —
- Eligible?
- —
Short-term bridge; refi at stabilization.
Rent comps 6 comps
| Address | Beds | Baths | Sqft | Rent | $/sqft | DOM | Units | Dist |
|---|---|---|---|---|---|---|---|---|
| 1840 Costigan Dr Lexington, KY | 3.0 | 1.5 | 1050 | $1,595 | $1.52 | 23d | 1 | 0.34mi |
| 1578 Van Buren Dr Unit Z4 Lexington, KY | 3.0 | 1.0 | 988 | $1,299 | $1.31 | 21d | 1 | 0.85mi |
| 686 Eden Rd Lexington, KY | 3.0 | 2.0 | 1482 | $1,995 | $1.35 | 23d | 1 | 0.85mi |
| 356 Radcliffe Rd Unit B Lexington, KY | 2.0 | 1.0 | 1325 | $1,200 | $0.91 | 23d | 1 | 1.06mi |
| 1724 Silver Ln Lexington, KY | 3.0 | 1.0 | 1150 | $1,850 | $1.61 | 23d | 1 | 1.09mi |
| 2408 Shandon Dr Lexington, KY | 3.0 | 1.5 | 1026 | $1,595 | $1.55 | 23d | 1 | 1.11mi |
Listing history 5 events
-
2026-04-06status Pending
-
2026-01-14price $184,900
-
2025-11-19price $185,000
-
2025-11-10price $191,500
-
2025-10-17$193,000 Active
ⓘ Source: listings_history table (triggers on properties + properties_extension) + one-shot
backfill from property_details.listing_events for pre-trigger history.
Tax reassessment forecast KY · Resets to sale price
- Current annual tax
- $749 · $62/mo
- Projected year-2 tax
- $1,590 · $133/mo
- Expected delta
- +$841/yr (+$70/mo · 112.4%)
ⓘ Screening estimate from a state-policy table — verify with the county assessor before closing.
Climate risk First Street
- Flood 1/10 Low FEMA zone X (unshaded) · 0% chance over 30 yrs
- Wildfire 1/10 Low
- Heat 4/10 Moderate 7 d/yr ≥101°F today · 19 d/yr by 30 yrs out
- Wind 2/10 Low 2% chance of damaging wind over 30 yrs
- Air quality 2/10 Low 0 unhealthy d/yr today · 2 by 30 yrs out
Nearby sold comps map
Loading sold comps map…
Walkable amenities ~0.75 mi
Loading nearby amenities…
Taxation est. · year 1
- Rental income
- $21,966
- − Mortgage interest
- −$10,357
- − Property taxes
- −$749
- − Insurance
- −$924
- − Repairs & maintenance
- −$1,757
- − Management
- −$1,757
- − Depreciation
- −$5,379
- Taxable income
- $1,042
- Est. tax owed @ 24.0%
- −$250
- After-tax cash flow
- $3,794/yr
For passive investors: Depreciation is non-cash, so a rental often shows a tax loss while cash-flowing — sheltering income. Rental losses are passive: they offset passive income freely, and up to $25,000/yr can offset ordinary (W-2) income if you actively participate and your MAGI is under $100k (phasing out to $0 by $150k); unused losses carry forward. On sale, claimed depreciation is recaptured at up to 25%, and gains may owe capital-gains tax (a 1031 exchange can defer both). Figures are a year-1 estimate at your 24.0% rate — not tax advice; consult a CPA.
Schools (NCES district)
- District
- Fayette County
- NCES district ID
- 2101860
- Math proficiency
- 35% ▼ -16.00%
- Reading proficiency
- 45% ▼ -13.00%
- Median HH income
- $49,245
- Composite
- 34.38/100
- National rank
- #5211
- State rank
- #27 of 165 in KY
Livability — Lexington-Fayette
No livability data for this city. (Only ~50 U.S. cities are tracked.)
Census & demographics
- Census place
- Lexington-Fayette, KY
- County
- Fayette County · 317,143 people
- City population
- 321,882
- Metro
- Lexington-Fayette, KY
- Population (ZIP)
- 38,176
- Household income
- $79,540
- Rent vs Own
- Severe rent burden
- 1195.0
Population outlook (Fayette County) Hauer SSP2
- Today (2025)
- 363,454 people
- By 2030
- 388,270 · +6.8%
- By 2040
- 438,688 · +20.7%
- By 2050
- 490,667 · +35.0%
- By 2075
- 625,394 · +72.1%
- By 2100
- 721,354 · +98.5%
Race, ethnicity, and origin ACS 2023
- Neighborhood character
- Diverse neighborhood (Simpson 0.65)
- Race & ethnicity
- White 50% Black 26% Hispanic / Latino 17% Two or more races 12% Asian 3%
- Hispanic origin (detail)
- Mexican 12% Puerto Rican 1%
- Common ancestry
- Italian 2% Slovak 1% Lithuanian 1%
- Foreign-born
- 16% · Canada, India
- Languages at home
- 76% English-only · Spanish 15% French/Haitian/Cajun 2% Other Indo-European 2%
Political lean MEDSL · Fayette
- 2024 margin
- D (+18.1) · D 58.0% · R 39.9% · Other 2.1%
- 2008→2024 swing
- +13.3pp toward D · 2008: 4.8pp · 2024: 18.1pp
- All cycles
- 2024: D+18.1 2020: D+20.8 2016: D+9.5 2012: D+1.0 2008: D+4.8
Not yet ingested
- Civics
- —
Market trends
- HPI YoY
- ▼ -91.18%
- Current HPI
- 247.0959
- Rent YoY
- ▲ 3.94%
- Metro
- Lexington-Fayette, KY
- State GDP YoY
- ▲ 1.81%
- F500 in state
- 4
Industry mix (Fortune 500 HQ in KY)
| Industry | F500 HQs | Revenue |
|---|---|---|
| Healthcare | 1 | $118B |
|
||
| Food / Beverage | 1 | $7B |
|
||
Price history
-4.2% since first listed5 events — show timeline
- 2026-04-06 Pending — ImagineMLS
- 2026-01-14 Price Changed $184,900 ImagineMLS
- 2025-11-19 Price Changed $185,000 ImagineMLS
- 2025-11-10 Price Changed $191,500 ImagineMLS
- 2025-10-17 Listed $193,000 ImagineMLS
Property tax history
+1.9%/yrLatest (2015): $749 · +1.9% YoY. Source: county tax records.
Cash-flow waterfall
monthlySold comps — $/sqft
last 12 mo · ≤1 miLoading sold comps…