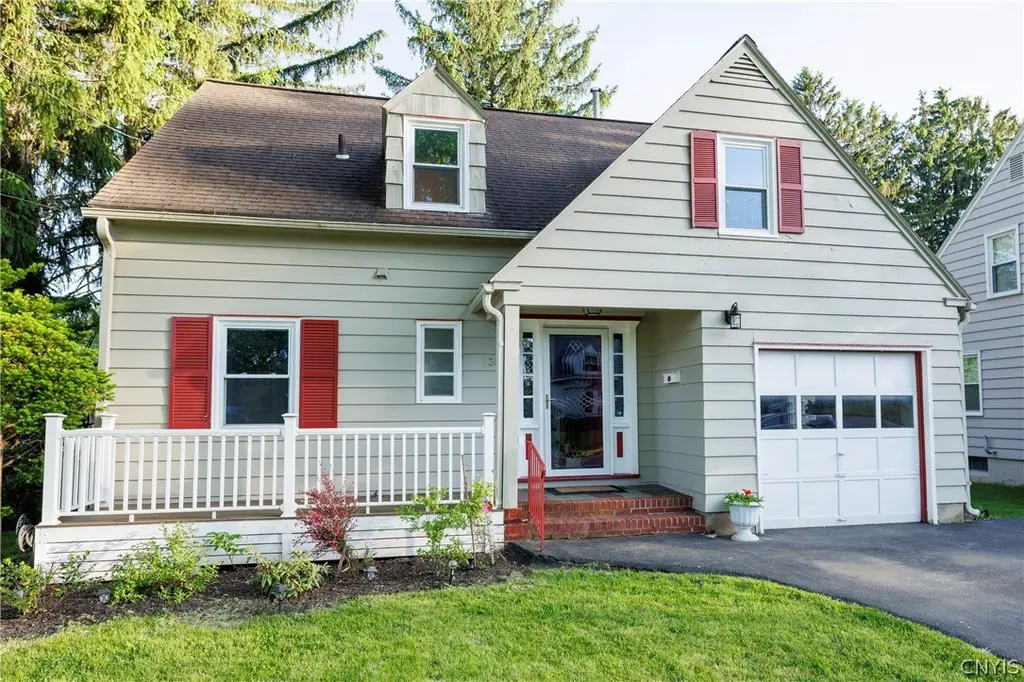
634 Mertens Ave · Syracuse, NY
Flood risk 1/10 · Minimal
- FEMA flood zone
- X (unshaded)
- Chance of flooding over 30 yrs
- 0.0%
- Est. flood insurance / yr
- $473 – $860
Fire risk 1/10 · Minimal
- Est. fire insurance / yr
- $691 – $1,283
Heat risk 3/10 · Minor
- Hot days now (above 95°F)
- 7 days/yr
- Hot days in 30 yrs
- 16 days/yr
Wind risk 1/10 · Minimal
- Chance of severe wind over 30 yrs
- 1.0%
Air-quality risk 2/10 · Minimal
- Unhealthy air days now
- 0 days/yr
- Unhealthy air days in 30 yrs
- 1 days/yr
Risk factors via First Street. Map © Google.
Why this score? — see what drove the F grade
The composite is a weighted blend of 9 inputs, each scored 0–100. Each bar is that input's sub-score; the figure is the points it added to the 100-point composite (weight × sub-score).
- Cash flow +9.5/30.0
- Rent growth +4.6/5.0
- Livability +3.9/5.0
- DSCR +2.7/10.0
- Condition / age +2.5/5.0
- 1% rule +1.9/10.0
- Schools +1.8/10.0
- ARV discount +0.0/15.0
- Appreciation +0.0/10.0
$299,000
🖨 Deal sheet (PDF) 📄 Offer letter ✓ Due diligence
Listing remarks MLS
Schoeck-built w/ gorgeous architectual detailing * Very spacious bedrms (1 2nd flr bedr used as laundry rm-hook-ups in basmt)Ist flr den has closet-poss. 5th bedr * Private wooded lot w/ deck * 23 Ft lvg/dng rm w/ built-in corner cabinets & bookshelves * 2 FP-gas-lvg rm & wood-basmt
Key facts
- Rich hardwood floors
- Newer appliances
- Cozy fireplace
Tags
Property features AI
Exterior
- Parking: Attached garage with garage door opener; Driveway parking; 1-car garage
- Utilities: Public water connected; Sewer connected; Circuit breaker electric service
- Home design: Single-story property; Resale condition
- Construction: Brick and cedar construction; Asphalt shingle roof; Block foundation; Copper plumbing
- Exterior features: Deck; Open porch; Awnings; Blacktop driveway; Fully fenced yard; Rectangular lot; Near public transit; City street frontage
Interior
- Kitchen: Electric cooktop; Microwave; Dishwasher; Refrigerator; Pantry; Eat-in kitchen
- Bedrooms: One main-level bedroom
- Flooring: Carpet; Hardwood; Laminate; Vinyl; Varies
- Bathrooms: One full bathroom; Two half bathrooms; One main-level bathroom
- Heating & cooling: Gas forced-air heating; Central air conditioning
- Interior features: Ceiling fans; Dry bar; Entrance foyer; Eat-in kitchen; Separate/formal living room; Pantry; Storage; Natural woodwork; Workshop; Bedroom on main level; Has full basement
- Laundry & utility: Washer and dryer; Laundry in basement; Gas water heater
Neighborhood map
What this means for you Summary
Snapshot
- This is a 4-bed/1.5-bath single-family listed at $299k.
Deal economics
- At list price, monthly cash flow is $-210 ($-3k/yr) — negative.
- To cash-flow at today's rent, offer at most $262k (12.4% below list).
- To meet the 1% rule (rent ≥ 1% of price), the offer needs to be $205k (31.3% below list).
- Recommended offer: $205k (31.3% below list) — sets the bar for 1% rule.
- Cap rate 5.5% vs local median 8.2% in Syracuse — below-typical yield; the buyer is paying a premium for something (appreciation thesis, condition, location) that the cap rate doesn't capture.
Location & tenants
- Location reads 77/100 on livability (#187 in NY, #2,869 nationally) — a middle-class / working-renter tenant base. Strengths: amenities A+, commute A+, cost of living A+; Watch: crime F, employment D-.
- Syracuse City School District (urban): math 18% / reading 26% proficiency, ranked #590 of 590 in NY (top 100%) — low school quality limits family demand, transient renter base, plan for 1-2y turnover; 74% free/reduced lunch — lower-income household profile, screen leases tightly.
- Zoned schools: Syracuse Latin School (math 31% / reading 62%, grade D-, #1,262 of 2,108 statewide, top 60%, 642 students, 42% FRL); Lincoln Middle School (math 8% / reading 14%, grade F, #721 of 729 statewide, top 99%, 508 students, 90% FRL); Henninger High School (math 65% / reading 50%, grade C, #885 of 1,100 statewide, top 81%, 1,499 students, 85% FRL) — zoned schools at 72% FRL track the district average.
- Zoned-school proficiency averages 38% at this address vs 22% district-wide (+16 pts) — the actual schools serving this property are materially stronger than the Syracuse City School District average implies; a family-tenant draw the district grade alone would hide.
- Market conditions: Rents rising fast (+8.4%/yr); 55 active listings in the ZIP; 14 comparable units currently listed for rent nearby; rentals lingering (median 46d on market — plan ~5-8 weeks vacancy on turnover, expect pricing pressure); 57% of comp listings sitting > 30 days — soft ceiling on asking rent; 616 units permitted in Onondaga County in 2024 (256 in 5+ unit buildings).
- At $2,053/mo this rent would consume 52% of the median local household income ($47k/yr) (locally 1566% of renters already pay >50% of income on rent) — very limited rent-growth headroom before tenants either downsize or default.
Forward outlook
- Local home prices are declining (-3.0%/yr); year-one equity from $2k of loan paydown is wiped out by about $9k of value loss. Plan a longer hold.
- Onondaga County population projected to shrink 9% by 2050 — rents likely to lag national; underwrite the cash flow, not the appreciation.
Negotiation context
- It's been on market 15 days — a 2% lower offer ($295k) is reasonable based on typical stale-listing flexibility.
- 2 sale attempts since 12y ago; this cycle's ask has dropped $20k (6%) from the opening price — seller is motivated, your offer sets the floor, not the list.
- Current owner paid $149k; list at $299k implies a 101% gain — meaningful room to come down on a strong offer.
Risks & watch-outs
- Watch-outs: built in 1946 — expect roof / HVAC / electrical / plumbing capex.
Questions for the listing agent
- What do current leases actually rent for vs. the listed asking? Can we see a recent rent roll and the last 12 months of T-12 income?
- Built in 1946 — when were the roof, HVAC, electrical panel, plumbing, and water heater last replaced?
- Is there a deadline driving the sale (1031 exchange, divorce, estate, relocation)? That informs how much negotiation room exists.
- Schools are D-rated, which usually means shorter tenancies and higher turnover. Who's the typical renter profile here, and what's been the actual vacancy rate?
- Crime grade is F in this area — have there been break-ins, vandalism, or insurance claims at this property in the last 3 years? What carrier currently insures it and at what premium?
- The area grade is low — what's the realistic commute time and amenity access for the typical tenant pool here? Any planned neighborhood developments (good or bad) we should know about?
- What's the average days-on-market for RENTAL listings here right now (not sales)? A rising rental-DOM trend means longer vacancies and softer asking-rent achievability than the comps imply.
- What's the recent tenant-quality profile in this submarket — average credit score on applications, eviction rate, late-payment / NSF rate, and stable-employment percentage? A property-management company in the area should have these aggregated.
- How much new for-sale + rental construction is in the pipeline within 1–3 miles? Heavy new supply typically softens prices + rents 12–24 months out; constrained supply supports both.
Investment metrics
- 1% rule
- 0.69% ✗
- Cap rate
- 5.45%
- Cash-on-cash
- -3.00%
- DSCR
- 0.87
- GRM
- 12.1
CMA / ARV
- ARV (on-the-fly)
- $204,400
- Comps found
- 12
Show comp detail 12 sales within ~0.75 mi
| Address | Dist | Beds/Ba | Sqft | Sold | Price | $/sf | Match |
|---|---|---|---|---|---|---|---|
| 158 Darlington Rd | 0.31mi | 3/1.0 (-1) | 1,329 (-5%) | 2mo | $186,000 | $140 | 68 |
| 204 Kline St | 0.28mi | 3/2.0 (-1) | 1,524 (+9%) | 2mo | $278,750 | $183 | 64 |
| 714 Helen St | 0.18mi | 3/1.0 (-1) | 1,248 (-11%) | 7mo | $173,000 | $139 | 61 |
| 619 Dewitt St | 0.28mi | 4/1.5 | 1,588 (+13%) | 5mo | $248,000 | $156 | 60 |
| 709 Darlington Rd | 0.68mi | 3/1.5 (-1) | 1,416 (+1%) | 3mo | $207,000 | $146 | 59 |
| 321 Dewitt St | 0.51mi | 3/1.5 (-1) | 1,310 (-6%) | 6mo | $175,000 | $134 | 56 |
| 215 Tower Ave | 0.73mi | 3/1.0 (-1) | 1,416 (+1%) | 3mo | $241,500 | $171 | 54 |
| 125 Paul Ave | 0.65mi | 4/1.5 | 1,527 (+9%) | 1mo | $210,000 | $138 | 54 |
| 339 Orwood Pl | 0.66mi | 4/2.0 | 1,320 (-6%) | 5mo | $226,000 | $171 | 53 |
| 308 Kenwick Dr | 0.47mi | 3/1.0 (-1) | 1,248 (-11%) | 3mo | $180,000 | $144 | 50 |
| 222 Maplehurst Ave | 0.75mi | 4/1.0 | 1,248 (-11%) | 6mo | $110,000 | $88 | 40 |
| 303 Snyder Ave | 0.73mi | 3/1.0 (-1) | 1,225 (-12%) | 4mo | $220,000 | $180 | 35 |
Match score weights: distance 35% · size 25% · config 20% · recency 20%. Top-matched comps best support the ARV.
Projected returns pro-forma
-3.0% appreciation · 8.0% rent growth · sell at horizon
- IRR
- -16.6%
- Equity multiple
- 0.39×
- Total profit
- $-51,062
- Equity at exit
- $44,582
- IRR
- -1.9%
- Equity multiple
- 0.85×
- Total profit
- $-12,735
- Equity at exit
- $25,852
Cash invested: $83,720 (down + closing). Projections, not guarantees.
Landlord ↔ Tenant lean methodology
- Overall (STATE)
- 15 Strongly Tenant-Friendly
- State New York
- 15 Strongly Tenant-Friendly · D+10
- County
- — inherits STATE
- City
- — inherits STATE
ZIP-level market 13203
- Home prices YoY
- -11.9%
- Rents YoY
- 8.4%
- Active inventory
- 55
- Price-to-rent
- 12.1×
Monthly cashflow live
- Estimated rent
- $2,053 high interval (Pro) →
- Mortgage (P&I)
- −$1,568
- Tax from tax record
- −$139 /mo · $1,664/yr
- Insurance
- −$125
- HOA
- −$0
- Vacancy / Maint / Mgmt
- −$431
- Net cashflow
- $-210
Break-even live
Sensitivity live
| Price | -10% $-40 | -5% $-125 | +0% $-210 | +5% $-294 | +10% $-379 |
|---|---|---|---|---|---|
| Rent | -10% $-372 | -5% $-291 | +0% $-210 | +5% $-128 | +10% $-47 |
| Rate | -1.0pp $-59 | -0.5pp $-134 | base $-210 | +0.5pp $-287 | +1.0pp $-366 |
UW: 25.0% down · 7.5% · 30yr · 1.5% tax · 5.0% vac · 8.0% maint · 8.0% mgmt
Financing live
Cash to close
- Down payment
- $74,750
- Closing costs
- $8,970
- Reserves months
- —
- Total cash needed
- —
Loan-product check · same deal, 3 products live
Conventional
25% down · 7.5% · 30yr
- Down + closing
- —
- Monthly P&I
- —
- Monthly cashflow
- —
- DSCR
- —
- Eligible?
- —
Personal DTI + credit; lowest rate.
DSCR
20% down · 8.5% · 30yr
- Down + closing
- —
- Monthly P&I
- —
- Monthly cashflow
- —
- DSCR
- —
- Eligible?
- —
No personal income docs; deal must DSCR.
Hard money
10% down · 12.0% · 12mo
- Down + closing
- —
- Monthly P&I
- —
- Monthly cashflow
- —
- DSCR
- —
- Eligible?
- —
Short-term bridge; refi at stabilization.
Rent comps 14 comps
| Address | Beds | Baths | Sqft | Rent | $/sqft | DOM | Units | Dist |
|---|---|---|---|---|---|---|---|---|
| 423 Wendell Ter Syracuse, NY | 4.0 | 1.0 | 1312 | $2,500 | $1.91 | 15d | 1 | 0.11mi |
| 126 Woodruff Ave Syracuse, NY | 3.0 | 1.0 | 1200 | $1,675 | $1.40 | 45d | 1 | 0.30mi |
| 1801 James St #2 Syracuse, NY | 3.0 | 1.0 | 1244 | $1,800 | $1.45 | 15d | 1 | 0.62mi |
| 286 Ross Park Syracuse, NY | 3.0 | 1.0 | 1100 | $1,500 | $1.36 | 46d | 1 | 0.87mi |
| 204 Mariposa St Unit pvt house Syracuse, NY | 3.0 | 1.0 | 1128 | $2,137 | $1.89 | 15d | 1 | 0.90mi |
| 746 E Laurel St Unit 1 Syracuse, NY | 4.0 | 2.0 | 1400 | $1,500 | $1.07 | 45d | 1 | 0.90mi |
| 912 Park St Unit 1 Syracuse, NY | 3.0 | 1.0 | 1040 | $1,200 | $1.15 | 45d | 1 | 0.92mi |
| 202 Stafford Ave Syracuse, NY | 3.0 | 1.0 | 1692 | $1,800 | $1.06 | 15d | 1 | 1.04mi |
| 297 Norwood Ave Syracuse, NY | 3.0 | 1.0 | 1188 | $2,050 | $1.73 | 23d | 1 | 1.12mi |
| 525 Burnet Ave Unit First Floor Syracuse, NY | 3.0 | 1.0 | 900 | $1,650 | $1.83 | 45d | 1 | 1.32mi |
| 205A Hawley Ave Unit 211C Syracuse, NY | 3.0 | 2.5 | 1350 | $1,675 | $1.24 | 45d | 1 | 1.33mi |
| 205A Hawley Ave Unit 213C Syracuse, NY | 3.0 | 2.5 | 1350 | $1,650 | $1.22 | 45d | 1 | 1.33mi |
| 1132 Wolf St Unit 4 Syracuse, NY | 3.0 | 1.0 | 1041 | $1,350 | $1.30 | 45d | 1 | 1.42mi |
| 416 Pearl St Unit 2 Syracuse, NY | 3.0 | 1.0 | 900 | $2,400 | $2.67 | 15d | 1 | 1.48mi |
Listing history 13 events
-
2026-06-21days on market $299,000 Active 15 DOM
-
2026-06-18days on market $299,000 Active 12 DOM
-
2026-06-17days on market $299,000 Active 11 DOM
-
2026-06-16days on market $299,000 Active 10 DOM
-
2026-06-15price $299,000 Active 9 DOM
-
2026-06-15days on market $319,000 Active 9 DOM
-
2026-06-14days on market $319,000 Active 7 DOM
-
2026-06-13days on market $319,000 Active 6 DOM
-
2026-06-10days on market $319,000 Active 4 DOM
-
2026-06-09days on market $319,000 Active 3 DOM
-
2026-06-08days on market $319,000 Active 2 DOM
-
2026-06-07remarks 695-char remark
-
2026-06-07$319,000 Active 1 DOM
ⓘ Source: listings_history table (triggers on properties + properties_extension) + one-shot
backfill from property_details.listing_events for pre-trigger history.
Tax reassessment forecast NY · Partial reset (capped growth)
- Current annual tax
- $1,664 · $139/mo
- Projected year-2 tax
- $3,359 · $280/mo
- Expected delta
- +$1,694/yr (+$141/mo · 101.8%)
ⓘ Screening estimate from a state-policy table — verify with the county assessor before closing.
Climate risk First Street
- Flood 1/10 Low FEMA zone X (unshaded) · 0% chance over 30 yrs
- Wildfire 1/10 Low
- Heat 3/10 Moderate 7 d/yr ≥95°F today · 16 d/yr by 30 yrs out
- Wind 1/10 Low 100% chance of damaging wind over 30 yrs
- Air quality 2/10 Low 0 unhealthy d/yr today · 1 by 30 yrs out
Nearby sold comps map
Loading sold comps map…
Walkable amenities ~0.75 mi
Loading nearby amenities…
Taxation est. · year 1
- Rental income
- $24,633
- − Mortgage interest
- −$16,749
- − Property taxes
- −$1,664
- − Insurance
- −$1,495
- − Repairs & maintenance
- −$1,971
- − Management
- −$1,971
- − Depreciation
- −$8,698
- Taxable loss
- −$7,914
- Est. tax savings @ 24.0%
- +$1,899
- After-tax cash flow
- $-615/yr
For passive investors: Depreciation is non-cash, so a rental often shows a tax loss while cash-flowing — sheltering income. Rental losses are passive: they offset passive income freely, and up to $25,000/yr can offset ordinary (W-2) income if you actively participate and your MAGI is under $100k (phasing out to $0 by $150k); unused losses carry forward. On sale, claimed depreciation is recaptured at up to 25%, and gains may owe capital-gains tax (a 1031 exchange can defer both). Figures are a year-1 estimate at your 24.0% rate — not tax advice; consult a CPA.
Schools (NCES district)
- District
- Syracuse City School District
- NCES district ID
- 3628590
- Math proficiency
- 18% ▼ -5.00%
- Reading proficiency
- 26% ▬ 0.00%
- Median HH income
- $32,097
- Composite
- 17.83/100
- National rank
- #9007
- State rank
- #590 of 590 in NY
Livability — Syracuse
- Score
- 77/100
- State rank
- #187
- US rank
- #2869
Category grades
Schools grade is shown separately in the Schools card above.
Census & demographics
- Census place
- Syracuse, NY
- County
- Onondaga County · 247,257 people
- City population
- 152,627
- Metro
- Syracuse, NY
- Population (ZIP)
- 16,180
- Household income
- $46,997
- Rent vs Own
- Severe rent burden
- 1566.0
Population outlook (Onondaga County) Hauer SSP2
- Today (2025)
- 467,894 people
- By 2030
- 463,381 · -1.0%
- By 2040
- 447,697 · -4.3%
- By 2050
- 426,399 · -8.9%
- By 2075
- 373,661 · -20.1%
- By 2100
- 307,967 · -34.2%
Race, ethnicity, and origin ACS 2023
- Neighborhood character
- Diverse neighborhood (Simpson 0.67)
- Race & ethnicity
- White 52% Black 22% Hispanic / Latino 11% Two or more races 9% Asian 7%
- Hispanic origin (detail)
- Puerto Rican 6% Cuban 2%
- Common ancestry
- Romanian 3% Lithuanian 2% Iranian 2%
- Foreign-born
- 13% · Canada, India, Philippines
- Languages at home
- 81% English-only · Spanish 6% Other Indo-European 3% Other Asian/Pacific 3%
Political lean MEDSL · Onondaga
- 2024 margin
- D (+17.3) · D 58.6% · R 41.4%
- 2008→2024 swing
- -3.0pp toward R · 2008: 20.3pp · 2024: 17.3pp
- All cycles
- 2024: D+17.3 2020: D+20.6 2016: D+12.8 2012: D+21.1 2008: D+20.3
Not yet ingested
- Civics
- —
Market trends
- HPI YoY
- ▼ -35.69%
- Current HPI
- 263.2588
- Rent YoY
- ▲ 8.39%
- Metro
- Syracuse, NY
- State GDP YoY
- ▲ 2.60%
- F500 in state
- 92
Industry mix (Fortune 500 HQ in NY)
| Industry | F500 HQs | Revenue |
|---|---|---|
| Financial Services | 10 | $950B |
|
||
| Consumer Goods | 9 | $162B |
|
||
| Insurance | 4 | $225B |
|
||
| Telecommunications | 2 | $144B |
|
||
| Pharmaceuticals | 2 | $112B |
|
||
| Media / Entertainment | 2 | $69B |
|
||
Price history
+168.1% since first listed6 events — show timeline
- 2026-06-05 Listed $319,000 CNYIS
- 2015-05-21 Listing Removed — CNYIS
- 2015-04-20 Sold (MLS) $149,100 CNYIS
- 2015-04-16 Sold (Public Records) $149,500 Public Records
- 2014-09-13 Listed $154,900 CNYIS
- 2002-11-21 Sold (Public Records) $119,000 Public Records
Property tax history
+0.0%/yrLatest (2025): $1,664 · +0.0% YoY. Source: county tax records.
Cash-flow waterfall
monthlySold comps — $/sqft
last 12 mo · ≤1 miLoading sold comps…