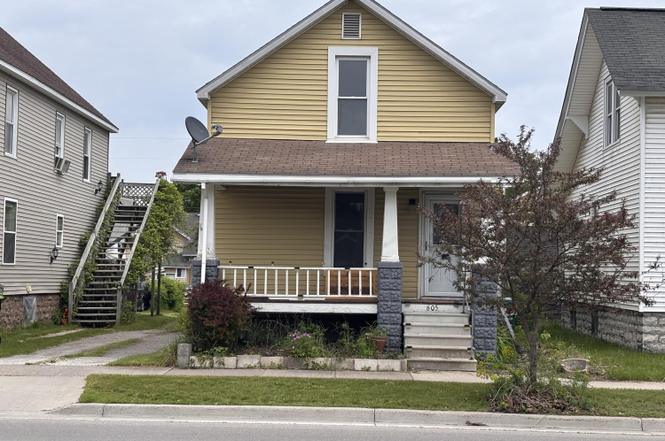
605 W Miller St · Alpena, MI
Flood risk 1/10 · Minimal
- FEMA flood zone
- X (unshaded)
- Chance of flooding over 30 yrs
- 0.0%
- Est. flood insurance / yr
- $473 – $860
Fire risk 1/10 · Minimal
- Est. fire insurance / yr
- $784 – $1,456
Heat risk 1/10 · Minimal
- Hot days now (above 91°F)
- 7 days/yr
- Hot days in 30 yrs
- 12 days/yr
Wind risk 1/10 · Minimal
- Chance of severe wind over 30 yrs
- —
Air-quality risk 1/10 · Minimal
- Unhealthy air days now
- 0 days/yr
- Unhealthy air days in 30 yrs
- 0 days/yr
Risk factors via First Street. Map © Google.
Why this score? — see what drove the D+ grade
The composite is a weighted blend of 9 inputs, each scored 0–100. Each bar is that input's sub-score; the figure is the points it added to the 100-point composite (weight × sub-score).
- Cash flow +14.3/30.0
- ARV discount +12.6/15.0
- DSCR +4.3/10.0
- Livability +3.4/5.0
- 1% rule +3.1/10.0
- Schools +2.7/10.0
- Rent growth +2.5/5.0
- Condition / age +2.5/5.0
- Appreciation +0.0/10.0
$100,000
🖨 Deal sheet 📄 Offer letter ✓ Due diligence
Listing remarks
Opportunity awaits with this 3-bedroom, 1-bath home that's ready for its next chapter. This property is in need of updates and will likely appeal to investors, flippers, or buyers looking to take on a renovation project. Features include a fenced-in backyard, a 2-car detached garage offering plenty of storage and workspace, and a newer furnace for added peace of mind. With some vision and elbow grease, this home has the potential to shine once again. Being sold as-is.
Key facts
- Newer furnace
- Fenced-in backyard
- Detached garage
Tags
Property features AI
Exterior
- Parking: Detached 2-car garage
- Utilities: Public water; Public sewer
- Home design: Single family residence; Residential property
- Construction: Has basement
- Exterior features: Paved road access; Shed(s) on property
Interior
- Kitchen: Dishwasher; Microwave; Refrigerator; Oven; Range
- Bathrooms: 1 full bathroom
- Heating & cooling: Forced air heating; Natural gas heating
- Interior features: Dishwasher; Microwave; Refrigerator; Oven; Range; Washer/Dryer stacked option
- Laundry & utility: Washer and dryer included (stacked); Laundry located on main level; Full basement
Neighborhood map
What this means for you Summary
Snapshot
- This is a 3-bed/1.0-bath single-family listed at $100k.
Deal economics
- At list price, monthly cash flow is $18 ($216/yr) — positive.
- The deal already cash-flows at list — no discount required.
- To meet the 1% rule (rent ≥ 1% of price), the offer needs to be $81k (19.2% below list).
- Recommended offer: $81k (19.2% below list) — sets the bar for 1% rule.
- Cap rate 6.5% vs local median 3.2% in Alpena — top-decile yield for the area; either an underpriced asset or a hidden risk that comps aren't pricing in. Stress-test before assuming the spread holds.
Location & tenants
- Location reads 68/100 on livability (#359 in MI) — a middle-class / working-renter tenant base. Strengths: cost of living A+, housing A+, health & safety A+; Watch: crime D+, amenities D-, commute F.
- Alpena Public Schools (town): math 26% / reading 38% proficiency, ranked #345 of 540 in MI (top 64%) — families likely to look elsewhere, expect single-tenant / working-renter base with shorter leases.
- Zoned schools: Alpena High School (math 32% / reading 57%, grade F, #214 of 713 statewide, top 36%, 1,101 students, 51% FRL).
- Zoned-school proficiency averages 44% at this address vs 32% district-wide (+12 pts) — the actual schools serving this property are materially stronger than the Alpena Public Schools average implies; a family-tenant draw the district grade alone would hide.
- Market conditions: 111 active listings in the ZIP; 46 units permitted in Alpena County in 2024 (0 in 5+ unit buildings).
Forward outlook
- Local home prices are declining (-3.0%/yr); year-one equity from $691 of loan paydown is wiped out by about $3k of value loss. Plan a longer hold.
- Alpena County population projected at -24% by 2050 — secular population decline; favor cash flow + early exit over multi-decade hold.
Negotiation context
- Only 3 days on market — expect competitive offers; lowballing is unlikely to land.
- Current owner paid $47k; list at $100k implies a 113% gain — meaningful room to come down on a strong offer.
Questions for the listing agent
- Is there a deadline driving the sale (1031 exchange, divorce, estate, relocation)? That informs how much negotiation room exists.
- Schools are D-rated, which usually means shorter tenancies and higher turnover. Who's the typical renter profile here, and what's been the actual vacancy rate?
- Crime grade is D in this area — have there been break-ins, vandalism, or insurance claims at this property in the last 3 years? What carrier currently insures it and at what premium?
- The area grade is low — what's the realistic commute time and amenity access for the typical tenant pool here? Any planned neighborhood developments (good or bad) we should know about?
- What's the average days-on-market for RENTAL listings here right now (not sales)? A rising rental-DOM trend means longer vacancies and softer asking-rent achievability than the comps imply.
- What's the recent tenant-quality profile in this submarket — average credit score on applications, eviction rate, late-payment / NSF rate, and stable-employment percentage? A property-management company in the area should have these aggregated.
- How much new for-sale + rental construction is in the pipeline within 1–3 miles? Heavy new supply typically softens prices + rents 12–24 months out; constrained supply supports both.
Investment metrics
- 1% rule
- 0.81% ✗
- Cap rate
- 6.51%
- Cash-on-cash
- 0.77%
- DSCR
- 1.03
- GRM
- 10.3
CMA / ARV
- ARV (on-the-fly)
- $112,808
- Comps found
- 5
Show comp detail 5 sales within ~0.75 mi
| Address | Dist | Beds/Ba | Sqft | Sold | Price | $/sf | Match |
|---|---|---|---|---|---|---|---|
| 535 W Lake St | 0.08mi | 2/1.0 (-1) | 980 (+2%) | 1mo | $155,840 | $159 | 86 |
| 309 Dawson St | 0.19mi | 2/1.0 (-1) | 988 (+3%) | 22mo | $115,000 | $116 | 62 |
| 521 Walnut St | 0.07mi | 2/1.0 (-1) | 846 (-12%) | 20mo | $68,000 | $80 | 56 |
| 1117 Ford Ave | 0.66mi | 2/1.0 (-1) | 836 (-13%) | 3mo | $99,000 | $118 | 41 |
| 1406 N 2nd Ave | 0.74mi | 2/1.0 (-1) | 864 (-10%) | 19mo | $125,000 | $145 | 29 |
Match score weights: distance 35% · size 25% · config 20% · recency 20%. Top-matched comps best support the ARV.
Projected returns pro-forma
-3.0% appreciation · 3.0% rent growth · sell at horizon
- IRR
- -15.1%
- Equity multiple
- 0.46×
- Total profit
- $-15,092
- Equity at exit
- $14,910
- IRR
- -6.6%
- Equity multiple
- 0.58×
- Total profit
- $-11,795
- Equity at exit
- $8,646
Cash invested: $28,000 (down + closing). Projections, not guarantees.
Landlord ↔ Tenant lean methodology
- Overall (STATE)
- 62 Landlord-Friendly
- State Michigan
- 62 Landlord-Friendly · EVEN
- County
- — inherits STATE
- City
- — inherits STATE
ZIP-level market 49707
- Home prices YoY
- -22.5%
- Active inventory
- 111
- Price-to-rent
- 10.3×
Monthly cashflow live
- Estimated rent
- $808 medium interval (Pro) →
- Mortgage (P&I)
- −$524
- Tax from tax record
- −$54 /mo · $652/yr
- Insurance
- −$42
- HOA
- −$0
- Vacancy / Maint / Mgmt
- −$170
- Net cashflow
- $18
Break-even live
UW: 25.0% down · 7.5% · 30yr · 1.5% tax · 5.0% vac · 8.0% maint · 8.0% mgmt
Financing live
Cash to close
- Down payment
- $25,000
- Closing costs
- $3,000
- Reserves months
- —
- Total cash needed
- —
Loan-product check · same deal, 3 products live
Conventional
25% down · 7.5% · 30yr
- Down + closing
- —
- Monthly P&I
- —
- Monthly cashflow
- —
- DSCR
- —
- Eligible?
- —
Personal DTI + credit; lowest rate.
DSCR
20% down · 8.5% · 30yr
- Down + closing
- —
- Monthly P&I
- —
- Monthly cashflow
- —
- DSCR
- —
- Eligible?
- —
No personal income docs; deal must DSCR.
Hard money
10% down · 12.0% · 12mo
- Down + closing
- —
- Monthly P&I
- —
- Monthly cashflow
- —
- DSCR
- —
- Eligible?
- —
Short-term bridge; refi at stabilization.
Listing history 4 events
-
2026-06-18days on market $100,000 Active 3 DOM
-
2026-06-17days on market $100,000 Active 2 DOM
-
2026-06-16remarks 472-char remark
-
2026-06-16$100,000 Active 1 DOM
ⓘ Source: listings_history table (triggers on properties + properties_extension) + one-shot
backfill from property_details.listing_events for pre-trigger history.
Tax reassessment forecast MI · Partial reset (capped growth)
- Current annual tax
- $652 · $54/mo
- Projected year-2 tax
- $1,096 · $91/mo
- Expected delta
- +$444/yr (+$37/mo · 68.0%)
ⓘ Screening estimate from a state-policy table — verify with the county assessor before closing.
Climate risk First Street
- Flood 1/10 Low FEMA zone X (unshaded) · 0% chance over 30 yrs
- Wildfire 1/10 Low
- Heat 1/10 Low 7 d/yr ≥91°F today · 12 d/yr by 30 yrs out
- Wind 1/10 Low
- Air quality 1/10 Low 0 unhealthy d/yr today · 0 by 30 yrs out
Nearby sold comps map
Loading sold comps map…
Walkable amenities ~0.75 mi
Loading nearby amenities…
Taxation est. · year 1
- Rental income
- $9,697
- − Mortgage interest
- −$5,602
- − Property taxes
- −$652
- − Insurance
- −$500
- − Repairs & maintenance
- −$776
- − Management
- −$776
- − Depreciation
- −$2,909
- Taxable loss
- −$1,517
- Est. tax savings @ 24.0%
- +$364
- After-tax cash flow
- $580/yr
For passive investors: Depreciation is non-cash, so a rental often shows a tax loss while cash-flowing — sheltering income. Rental losses are passive: they offset passive income freely, and up to $25,000/yr can offset ordinary (W-2) income if you actively participate and your MAGI is under $100k (phasing out to $0 by $150k); unused losses carry forward. On sale, claimed depreciation is recaptured at up to 25%, and gains may owe capital-gains tax (a 1031 exchange can defer both). Figures are a year-1 estimate at your 24.0% rate — not tax advice; consult a CPA.
Schools (NCES district)
- District
- Alpena Public Schools
- NCES district ID
- 2602730
- Math proficiency
- 26% ▼ -7.00%
- Reading proficiency
- 38% ▼ -7.00%
- Median HH income
- $39,327
- Composite
- 26.8/100
- National rank
- #7119
- State rank
- #345 of 540 in MI
Livability — Alpena
- Score
- 68/100
- State rank
- #359
- US rank
- #9205
Category grades
Schools grade is shown separately in the Schools card above.
Census & demographics
- Census place
- Alpena, MI
- Population (ZIP)
- 22,050
Population outlook (Alpena County) Hauer SSP2
- Today (2025)
- 27,245 people
- By 2030
- 26,142 · -4.0%
- By 2040
- 23,449 · -13.9%
- By 2050
- 20,729 · -23.9%
- By 2075
- 15,422 · -43.4%
- By 2100
- 10,723 · -60.6%
Race, ethnicity, and origin ACS 2023
- Neighborhood character
- Predominantly White (92%)
- Race & ethnicity
- White 92% Two or more races 5% Hispanic / Latino 2% Black 1%
- Common ancestry
- Romanian 21% Lithuanian 7% Slovak 3%
- Foreign-born
- 1% · Canada
- Languages at home
- 98% English-only · Spanish 1%
Political lean MEDSL · Alpena
- 2024 margin
- Strong R (+28.6) · D 35.1% · R 63.7% · Other 1.2%
- 2008→2024 swing
- -32.5pp toward R · 2008: 3.9pp · 2024: -28.6pp
- All cycles
- 2024: R+28.6 2020: R+27.6 2016: R+28.7 2012: R+5.3 2008: D+3.9
Not yet ingested
- Civics
- —
Market trends
- HPI YoY
- ▼ -67.41%
- Current HPI
- 232.1238
- Rent YoY
- —
- Metro
- —
- State GDP YoY
- ▲ 1.37%
- F500 in state
- 28
Industry mix (Fortune 500 HQ in MI)
| Industry | F500 HQs | Revenue |
|---|---|---|
| Automotive Parts | 3 | $48B |
|
||
| Automotive | 2 | $372B |
|
||
| Chemicals | 1 | $45B |
|
||
| Automotive Retail | 1 | $29B |
|
||
| Healthcare / Medical Devices | 1 | $23B |
|
||
| Automotive Technology | 1 | $20B |
|
||
Price history
+112.8% since first listed2 events — show timeline
- 2026-06-15 Listed $100,000 WWMLS
- 2007-07-31 Sold (Public Records) $47,000 Public Records
Property tax history
-3.3%/yrLatest (2025): $652 · -13.0% YoY. Source: county tax records.
Cash-flow waterfall
monthlySold comps — $/sqft
last 12 mo · ≤1 miLoading sold comps…