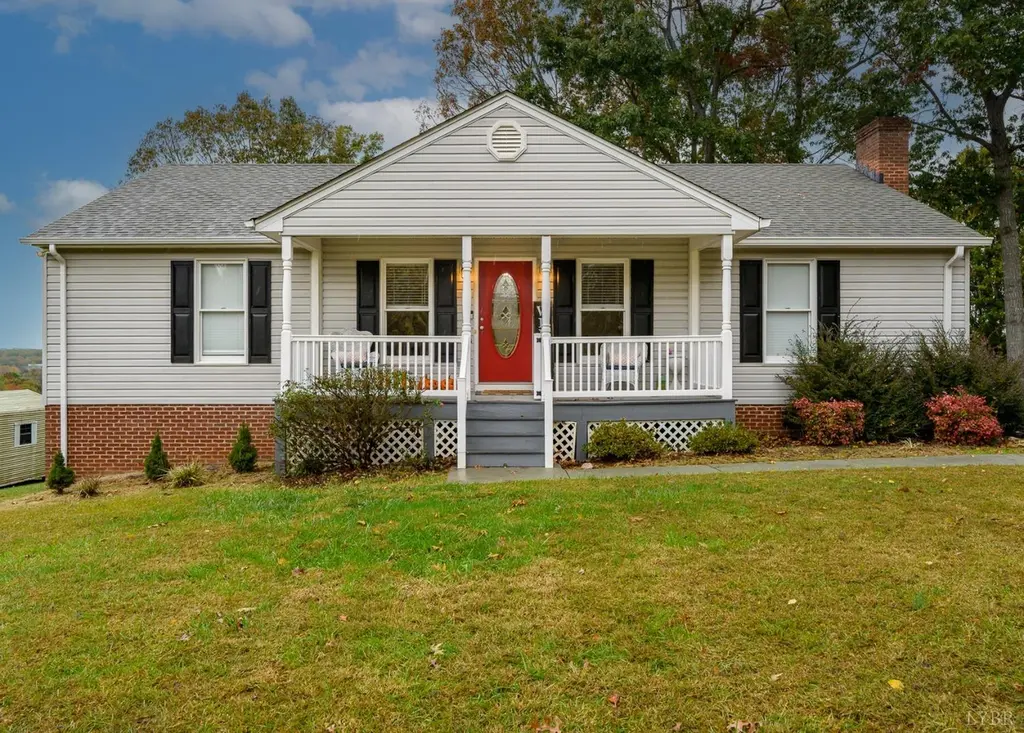
151 Wilderness Rd · Lynchburg, VA
Flood risk 1/10 · Minimal
- FEMA flood zone
- X (unshaded)
- Chance of flooding over 30 yrs
- 0.0%
- Est. flood insurance / yr
- $473 – $860
Fire risk 3/10 · Minor
- Est. fire insurance / yr
- $666 – $1,236
Heat risk 5/10 · Moderate
- Hot days now (above 101°F)
- 7 days/yr
- Hot days in 30 yrs
- 18 days/yr
Wind risk 2/10 · Minimal
- Chance of severe wind over 30 yrs
- 3.0%
Air-quality risk 2/10 · Minimal
- Unhealthy air days now
- 1 days/yr
- Unhealthy air days in 30 yrs
- 1 days/yr
Risk factors via First Street. Map © Google.
Why this score? — see what drove the D grade
The composite is a weighted blend of 9 inputs, each scored 0–100. Each bar is that input's sub-score; the figure is the points it added to the 100-point composite (weight × sub-score).
- ARV discount +14.3/15.0
- Cash flow +8.0/30.0
- Schools +5.2/10.0
- Livability +4.5/5.0
- Rent growth +2.5/5.0
- Condition / age +2.5/5.0
- DSCR +2.1/10.0
- 1% rule +1.4/10.0
- Appreciation +0.0/10.0
$299,900
🖨 Deal sheet (PDF) 📄 Offer letter ✓ Due diligence
Listing remarks MLS
PRICE REDUCED $10,000 The large covered front porch welcomes you into this beautiful home with hardwood floors that were just refinished and fresh paint throughout. You enter the huge living room with vaulted ceilings which leads you to the stunning large sunroom with mountain views. All the bedrooms are nice size and the master includes a walk-in closet and full bath. The full basement includes is ready to be finished and already has a full bath completed. Easy to add another bedroom or more living space. The beautiful lawn includes a nice shed for storage. Come and view this beautiful home which is ready for a new family. One owner home that took great care of this house. 10 minutes to LU.
Key facts
- Covered front porch
- Sunroom
- Finished full bath
Tags
Property features AI
Exterior
- Parking: Paved parking
- Security: Smoke detector(s)
- Utilities: Well water; Septic sewer
- Home design: Single-family residence; One story
- Construction: Vinyl siding; Shingle roof; Built on full basement
- Exterior features: Deck; Porch; Has view; Workshop
Interior
- Kitchen: Dishwasher; Electric range; Refrigerator
- Flooring: Carpet; Hardwood; Vinyl; Wood
- Bathrooms: 3 full bathrooms
- Heating & cooling: Heat pump (heating)
- Interior features: Fireplace (1); Deck and porch; Full walk-out basement
- Laundry & utility: Main level laundry room; Electric water heater
Neighborhood map
What this means for you Summary
Snapshot
- This is a 3-bed/3.0-bath single-family listed at $300k.
Deal economics
- At list price, monthly cash flow is $-303 ($-4k/yr) — negative.
- To cash-flow at today's rent, offer at most $246k (17.9% below list).
- To meet the 1% rule (rent ≥ 1% of price), the offer needs to be $191k (36.4% below list).
- Recommended offer: $191k (36.4% below list) — sets the bar for 1% rule.
- Cap rate 5.1% vs local median 4.0% in Lynchburg — meaningfully above typical; check what's discounted (condition, days-on-market, listing class) to confirm the premium yield is real.
Location & tenants
- Location reads 91/100 on livability (#1 in VA, #58 nationally) — a professional / high-income tenant draw. Strengths: amenities A+, commute A+, cost of living A+; Watch: crime C-, employment D+.
- Campbell County Public School District (rural): math 55% / reading 68% proficiency, ranked #55 of 131 in VA (top 42%) — acceptable for families but not a draw, mixed tenant base, ~2y average lease.
- Zoned schools: Yellow Branch Elementary (math 60% / reading 63%, grade B, #516 of 1,108 statewide, top 47%, 573 students, 74% FRL); Rustburg Middle (math 49% / reading 65%, grade B, #178 of 342 statewide, top 53%, 606 students, 74% FRL); Rustburg High (math 77% / reading 67%, grade B+, #134 of 319 statewide, top 45%, 828 students, 67% FRL) — zoned schools average 72% FRL vs 37% district-wide (35 pts higher); higher-poverty schools than district average — tighter screening recommended.
- Market conditions: 87 active listings in the ZIP; 9 comparable units currently listed for rent nearby; rentals lingering (median 46d on market — plan ~5-8 weeks vacancy on turnover, expect pricing pressure); 56% of comp listings sitting > 30 days — soft ceiling on asking rent; 315 units permitted in Campbell County in 2024 (51 in 5+ unit buildings).
Forward outlook
- Local home prices are declining (-3.0%/yr); year-one equity from $2k of loan paydown is wiped out by about $9k of value loss. Plan a longer hold.
- Campbell County population projected to shrink 6% by 2050 — rents likely to lag national; underwrite the cash flow, not the appreciation.
Negotiation context
- It's been on market 27 days — a 2% lower offer ($295k) is reasonable based on typical stale-listing flexibility.
- 5 sale attempts since 6y ago; this cycle's ask has dropped $45k (13%) from the opening price — seller is motivated, your offer sets the floor, not the list.
- Current owner paid $230k; 30% above their basis — modest negotiation headroom, anchor on the comps not their cost.
Risks & watch-outs
- Climate carrying-cost: extreme-heat days projected 7→18/yr by 2055 (HVAC capex compounding) — expect insurance premiums to compound above CPI over the hold.
Questions for the listing agent
- What do current leases actually rent for vs. the listed asking? Can we see a recent rent roll and the last 12 months of T-12 income?
- Is there a deadline driving the sale (1031 exchange, divorce, estate, relocation)? That informs how much negotiation room exists.
- Schools are A-rated — typically a magnet for longer-tenancy family renters. What's the average tenant stay here, and is there a school-zone premium baked into asking?
- The area grade is low — what's the realistic commute time and amenity access for the typical tenant pool here? Any planned neighborhood developments (good or bad) we should know about?
- What's the average days-on-market for RENTAL listings here right now (not sales)? A rising rental-DOM trend means longer vacancies and softer asking-rent achievability than the comps imply.
- What's the recent tenant-quality profile in this submarket — average credit score on applications, eviction rate, late-payment / NSF rate, and stable-employment percentage? A property-management company in the area should have these aggregated.
- How much new for-sale + rental construction is in the pipeline within 1–3 miles? Heavy new supply typically softens prices + rents 12–24 months out; constrained supply supports both.
Investment metrics
- 1% rule
- 0.64% ✗
- Cap rate
- 5.08%
- Cash-on-cash
- -4.33%
- DSCR
- 0.81
- GRM
- 13.1
CMA / ARV
- ARV (median comp)
- $353,415
- List price
- $299,900
- Delta
- -15.14%
- Verdict
- UNDERPRICED
- Comps
- 20 within 1.0 mi
Show comp detail 4 sales within ~0.75 mi
| Address | Dist | Beds/Ba | Sqft | Sold | Price | $/sf | Match |
|---|---|---|---|---|---|---|---|
| 448 Mantle Dr Dr | 0.09mi | 3/2.0 | 1,440 (-4%) | 4mo | $293,000 | $203 | 82 |
| 96 Ford Ter | 0.27mi | 3/2.0 | 1,404 (-6%) | 4mo | $350,000 | $249 | 69 |
| 958 Sunnymeade Rd | 0.30mi | 3/2.0 | 1,537 (+2%) | 14mo | $257,500 | $168 | 66 |
| 42 Bentridge Ct | 0.57mi | 3/2.0 | 1,585 (+6%) | 24mo | $355,000 | $224 | 40 |
Match score weights: distance 35% · size 25% · config 20% · recency 20%. Top-matched comps best support the ARV.
Projected returns pro-forma
-3.0% appreciation · 3.0% rent growth · sell at horizon
- IRR
- -23.7%
- Equity multiple
- 0.19×
- Total profit
- $-68,044
- Equity at exit
- $44,716
- IRR
- -18.8%
- Equity multiple
- -0.01×
- Total profit
- $-84,658
- Equity at exit
- $25,930
Cash invested: $83,972 (down + closing). Projections, not guarantees.
Landlord ↔ Tenant lean methodology
- Overall (STATE)
- 55 Moderately Landlord-Leaning
- State Virginia
- 55 Moderately Landlord-Leaning · D+2
- County
- — inherits STATE
- City
- — inherits STATE
ZIP-level market 24588
- Home prices YoY
- -20.5%
- Active inventory
- 87
- Price-to-rent
- 13.1×
Monthly cashflow live
- Estimated rent
- $1,908 high interval (Pro) →
- Mortgage (P&I)
- −$1,573
- Tax from tax record
- −$113 /mo · $1,359/yr
- Insurance
- −$125
- HOA
- −$0
- Vacancy / Maint / Mgmt
- −$401
- Net cashflow
- $-303
Break-even live
Sensitivity live
| Price | -10% $-133 | -5% $-218 | +0% $-303 | +5% $-388 | +10% $-473 |
|---|---|---|---|---|---|
| Rent | -10% $-454 | -5% $-379 | +0% $-303 | +5% $-228 | +10% $-152 |
| Rate | -1.0pp $-152 | -0.5pp $-227 | base $-303 | +0.5pp $-381 | +1.0pp $-460 |
UW: 25.0% down · 7.5% · 30yr · 1.5% tax · 5.0% vac · 8.0% maint · 8.0% mgmt
Financing live
Cash to close
- Down payment
- $74,975
- Closing costs
- $8,997
- Reserves months
- —
- Total cash needed
- —
Loan-product check · same deal, 3 products live
Conventional
25% down · 7.5% · 30yr
- Down + closing
- —
- Monthly P&I
- —
- Monthly cashflow
- —
- DSCR
- —
- Eligible?
- —
Personal DTI + credit; lowest rate.
DSCR
20% down · 8.5% · 30yr
- Down + closing
- —
- Monthly P&I
- —
- Monthly cashflow
- —
- DSCR
- —
- Eligible?
- —
No personal income docs; deal must DSCR.
Hard money
10% down · 12.0% · 12mo
- Down + closing
- —
- Monthly P&I
- —
- Monthly cashflow
- —
- DSCR
- —
- Eligible?
- —
Short-term bridge; refi at stabilization.
Rent comps 9 comps
| Address | Beds | Baths | Sqft | Rent | $/sqft | DOM | Units | Dist |
|---|---|---|---|---|---|---|---|---|
| 76 High St Lynchburg, VA | 2.0 | 2.5 | 1333 | $1,795 | $1.35 | 23d | 1 | 0.53mi |
| 87 High St Lynchburg, VA | 4.0 | 4.0 | 2175 | $2,295 | $1.06 | 45d | 1 | 0.55mi |
| 87 High St Unit 87 Lynchburg, VA | 4.0 | 3.5 | 2175 | $2,295 | $1.06 | 45d | 1 | 0.55mi |
| 9 Gloucester Dr Lynchburg, VA | 4.0 | 3.5 | 1748 | $1,850 | $1.06 | 45d | 1 | 1.05mi |
| 81 Catherine Ct Lynchburg, VA | 2.0 | 2.5 | 1328 | $1,500 | $1.13 | 15d | 1 | 1.09mi |
| 108 Old Tavern Cir Lynchburg, VA | 2.0 | 1.5 | 1080 | $1,450 | $1.34 | 45d | 1 | 1.09mi |
| 104 Squire Cir Lynchburg, VA | 3.0 | 3.0 | 1296 | $1,700 | $1.31 | 45d | 1 | 1.12mi |
| 32 Allure Dr Rustburg, VA | 3.0 | 2.5 | 1508 | $2,000 | $1.33 | 23d | 1 | 1.32mi |
| 126 Allure Dr Rustburg, VA | 3.0 | 2.5 | 1508 | $1,900 | $1.26 | 15d | 1 | 1.33mi |
Listing history 24 events
-
2026-06-13status $299,900 Pending 27 DOM
-
2026-06-10days on market $299,900 Active 27 DOM
-
2026-06-09days on market $299,900 Active 26 DOM
-
2026-06-08days on market $299,900 Active 25 DOM
-
2026-06-07pricedays on market $299,900 Active 24 DOM
-
2026-06-05days on market $339,900 Active 21 DOM
-
2026-06-02days on market $339,900 Active 19 DOM
-
2026-06-01days on market $339,900 Active 18 DOM
-
2026-05-31days on market $339,900 Active 17 DOM
-
2026-05-30days on market $339,900 Active 16 DOM
-
2026-05-14price $339,900 729-char remark
-
2026-05-14$344,900 Active 729-char remark
-
2026-04-28status Active
-
2026-04-01status Pending
-
2025-12-27price $344,900
-
2025-12-03price $349,900
-
2025-11-21status Active
-
2025-11-17status Pending
-
2025-11-12price $354,900
-
2025-10-30$364,900 Active
-
2020-08-17soldstatus $230,000
-
2020-08-14soldstatus $230,000
Show marketing remark (700 chars)
PRICE REDUCED $10,000 The large covered front porch welcomes you into this beautiful home with hardwood floors that were just refinished and fresh paint throughout. You enter the huge living room with vaulted ceilings which leads you to the stunning large sunroom with mountain views. All the bedrooms are nice size and the master includes a walk-in closet and full bath. The full basement includes is ready to be finished and already has a full bath completed. Easy to add another bedroom or more living space. The beautiful lawn includes a nice shed for storage. Come and view this beautiful home which is ready for a new family. One owner home that took great care of this house. 10 minutes to LU.
-
2020-06-22$224,900
Show marketing remark (700 chars)
PRICE REDUCED $10,000 The large covered front porch welcomes you into this beautiful home with hardwood floors that were just refinished and fresh paint throughout. You enter the huge living room with vaulted ceilings which leads you to the stunning large sunroom with mountain views. All the bedrooms are nice size and the master includes a walk-in closet and full bath. The full basement includes is ready to be finished and already has a full bath completed. Easy to add another bedroom or more living space. The beautiful lawn includes a nice shed for storage. Come and view this beautiful home which is ready for a new family. One owner home that took great care of this house. 10 minutes to LU.
-
1997-05-09soldstatus $123,000
ⓘ Source: listings_history table (triggers on properties + properties_extension) + one-shot
backfill from property_details.listing_events for pre-trigger history.
Tax reassessment forecast VA · Resets to sale price
- Current annual tax
- $1,359 · $113/mo
- Projected year-2 tax
- $2,459 · $205/mo
- Expected delta
- +$1,100/yr (+$92/mo · 80.9%)
ⓘ Screening estimate from a state-policy table — verify with the county assessor before closing.
Climate risk First Street
- Flood 1/10 Low FEMA zone X (unshaded) · 0% chance over 30 yrs
- Wildfire 3/10 Moderate
- Heat 5/10 Major 7 d/yr ≥101°F today · 18 d/yr by 30 yrs out
- Wind 2/10 Low 3% chance of damaging wind over 30 yrs
- Air quality 2/10 Low 1 unhealthy d/yr today · 1 by 30 yrs out
Nearby sold comps map
Loading sold comps map…
Walkable amenities ~0.75 mi
Loading nearby amenities…
Taxation est. · year 1
- Rental income
- $22,902
- − Mortgage interest
- −$16,799
- − Property taxes
- −$1,359
- − Insurance
- −$1,500
- − Repairs & maintenance
- −$1,832
- − Management
- −$1,832
- − Depreciation
- −$8,724
- Taxable loss
- −$9,145
- Est. tax savings @ 24.0%
- +$2,195
- After-tax cash flow
- $-1,444/yr
For passive investors: Depreciation is non-cash, so a rental often shows a tax loss while cash-flowing — sheltering income. Rental losses are passive: they offset passive income freely, and up to $25,000/yr can offset ordinary (W-2) income if you actively participate and your MAGI is under $100k (phasing out to $0 by $150k); unused losses carry forward. On sale, claimed depreciation is recaptured at up to 25%, and gains may owe capital-gains tax (a 1031 exchange can defer both). Figures are a year-1 estimate at your 24.0% rate — not tax advice; consult a CPA.
Schools (NCES district)
- District
- Campbell County Public School District
- NCES district ID
- 5100600
- Math proficiency
- 55% ▼ -29.00%
- Reading proficiency
- 68% ▼ -11.00%
- Median HH income
- $45,915
- Composite
- 51.88/100
- National rank
- #1656
- State rank
- #55 of 131 in VA
Livability — Lynchburg
- Score
- 91/100
- State rank
- #1
- US rank
- #58
Category grades
Schools grade is shown separately in the Schools card above.
Census & demographics
- City population
- 97,036
- Population (ZIP)
- 8,664
Population outlook (Campbell County) Hauer SSP2
- Today (2025)
- 56,306 people
- By 2030
- 56,366 · +0.1%
- By 2040
- 55,406 · -1.6%
- By 2050
- 53,011 · -5.9%
- By 2075
- 45,932 · -18.4%
- By 2100
- 36,029 · -36.0%
Race, ethnicity, and origin ACS 2023
- Neighborhood character
- Predominantly White (78%)
- Race & ethnicity
- White 78% Black 14% Two or more races 6% Hispanic / Latino 4% Asian 2%
- Common ancestry
- German 2% Romanian 2% Slovak 1%
- Foreign-born
- 3% · Canada, China, Vietnam
- Languages at home
- 94% English-only · Spanish 4% Vietnamese 1% Chinese 1%
Political lean MEDSL · Campbell
- 2024 margin
- Solid R (+48.6) · D 25.3% · R 73.9%
- 2008→2024 swing
- -12.3pp toward R · 2008: -36.2pp · 2024: -48.6pp
- All cycles
- 2024: R+48.6 2020: R+44.1 2016: R+47.2 2012: R+39.4 2008: R+36.2
Not yet ingested
- Civics
- —
Market trends
- HPI YoY
- ▼ -47.33%
- Current HPI
- 183.4102
- Rent YoY
- —
- Metro
- —
- State GDP YoY
- ▲ 2.40%
- F500 in state
- 50
Industry mix (Fortune 500 HQ in VA)
| Industry | F500 HQs | Revenue |
|---|---|---|
| Aerospace / Defense | 4 | $236B |
|
||
| Technology / Defense | 3 | $32B |
|
||
| Financial Services | 2 | $176B |
|
||
| Utilities | 2 | $27B |
|
||
| Insurance | 2 | $25B |
|
||
| Technology | 2 | $15B |
|
||
Price history
+143.8% since first listed16 events — show timeline
- 2026-06-10 Pending — LMLS
- 2026-06-06 Price Changed $299,900 LMLS
- 2026-05-14 Price Changed $339,900 LMLS
- 2026-05-14 Listed $344,900 LMLS
- 2026-04-28 Relisted — LMLS
- 2026-04-01 Pending — LMLS
- 2025-12-27 Price Changed $344,900 LMLS
- 2025-12-03 Price Changed $349,900 LMLS
- 2025-11-21 Relisted — LMLS
- 2025-11-17 Pending — LMLS
- 2025-11-12 Price Changed $354,900 LMLS
- 2025-10-30 Listed $364,900 LMLS
- 2020-08-17 Sold (Public Records) $230,000 Public Records
- 2020-08-14 Sold (MLS) $230,000 LMLS
- 2020-06-22 Listed $224,900 LMLS
- 1997-05-09 Sold (Public Records) $123,000 Public Records
Property tax history
+3.6%/yrLatest (2025): $1,359 · +0.0% YoY. Source: county tax records.
Cash-flow waterfall
monthlySold comps — $/sqft
last 12 mo · ≤1 miLoading sold comps…