 🌊 Lakefront
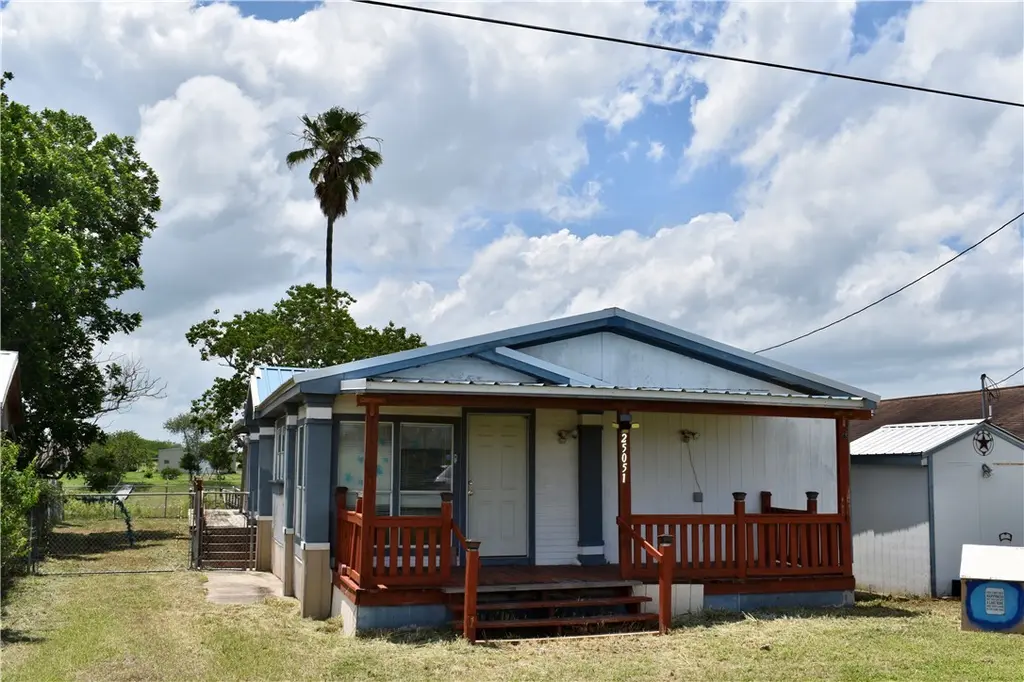
25051 Lakeshore Dr · Lakeshore Gardens-Hidden Acres, TX
Flood risk 5/10 · Moderate
- FEMA flood zone
- X (unshaded)
- Chance of flooding over 30 yrs
- 0.59%
- Est. flood insurance / yr
- $507 – $1,088
Fire risk 2/10 · Minimal
- Est. fire insurance / yr
- $1,222 – $2,270
Heat risk 9/10 · Severe
- Hot days now (above 110°F)
- 7 days/yr
- Hot days in 30 yrs
- 20 days/yr
Wind risk 9/10 · Severe
- Chance of severe wind over 30 yrs
- 99.0%
Air-quality risk 1/10 · Minimal
- Unhealthy air days now
- 0 days/yr
- Unhealthy air days in 30 yrs
- 0 days/yr
Risk factors via First Street. Map © Google.
Why this score? — see what drove the D grade
The composite is a weighted blend of 9 inputs, each scored 0–100. Each bar is that input's sub-score; the figure is the points it added to the 100-point composite (weight × sub-score).
- Cash flow +11.7/30.0
- ARV discount +7.5/15.0
- Appreciation +7.2/10.0
- DSCR +3.4/10.0
- Schools +2.9/10.0
- Rent growth +2.5/5.0
- Livability +2.5/5.0
- Condition / age +2.5/5.0
- 1% rule +2.1/10.0
$199,000
🖨 Deal sheet (PDF) 📄 Offer letter ✓ Due diligence
Listing remarks MLS
Looking for the Perfect Lakeside Getaway? Spend your days fishing off your private pier or inside the large 20X30 METAL WORKSHOP with lights and electric! This home sits on almost a 1/4 acre and has 3 bedrooms, 2 full baths, Large kitchen with plenty of counter space and an island, large living room, dining room, and indoor laundry. Exterior features a METAL ROOF and 2 covered decks (front and back) Property has an extra deep water well, propane tank, and a septic tank. Priced and being sold AS-IS.
Key facts
- Covered deck
- Durable metal roof
- Screened-in porch
Tags
Property features AI
Finance
- HOA & community: Short-term rentals allowed
Exterior
- Parking: Front entry parking; RV access / parking
- Utilities: Well water; Water available; Septic available
- Home design: Single-story home; Vinyl siding; Metal roof
- Construction: Vinyl siding construction; Metal roof
- Exterior features: Covered patio; Screened patio; Patio; Dock; Workshop; Chain link fencing; Located on a lake; Cul-de-sac lot
Interior
- Kitchen: Gas oven; Gas range; Range hood
- Flooring: Laminate flooring
- Bathrooms: Two full bathrooms
- Heating & cooling: Central heating (electric); Central air conditioning
- Interior features: Open floorplan; Sunroom; Breakfast bar; Window coverings / treatments; Primary bedroom on main level
- Laundry & utility: Washer hookup; Dryer hookup
Neighborhood map
What this means for you Summary
Snapshot
- This is a 3-bed/2.0-bath manufactured listed at $199k.
Deal economics
- At list price, monthly cash flow is $-59 ($-707/yr) — negative.
- To cash-flow at today's rent, offer at most $189k (5.2% below list).
- To meet the 1% rule (rent ≥ 1% of price), the offer needs to be $141k (29.3% below list).
- Recommended offer: $141k (29.3% below list) — sets the bar for 1% rule.
Location & tenants
- Location reads: area grade D — affects rentability + tenant quality, not the cash-flow math above.
- Mathis ISD (town): math 29% / reading 42% proficiency, ranked #528 of 826 in TX (top 64%) — families likely to look elsewhere, expect single-tenant / working-renter base with shorter leases; 78% free/reduced lunch — lower-income household profile, screen leases tightly.
- Zoned schools: Mathis El (math 12% / reading 37%, grade F, #3,052 of 4,322 statewide, top 74%, 409 students, 88% FRL); Mathis Middle (math 32% / reading 41%, grade F, #786 of 1,662 statewide, top 48%, 319 students, 86% FRL); Mathis H S (math 22% / reading 42%, grade F, #1,044 of 1,632 statewide, top 66%, 434 students, 82% FRL).
- Market conditions: 112 active listings in the ZIP; 344 units permitted in San Patricio County in 2024 (0 in 5+ unit buildings).
Forward outlook
- In year one you build about $10k of equity ($1k loan paydown + $9k appreciation (4.4% local appreciation)).
- San Patricio County population projected at +27% by 2050 — long-run rental-demand tailwind backs the buy-and-hold thesis.
- At projected returns (4.4% appreciation + 3.0% rent growth), your $56k cash investment doubles in ~5 years — after that, you're playing with house money.
- By year 4, paydown + projected appreciation supports a ~$34k cash-out refi (75% LTV) — recoverable capital for the next deal without selling this one.
Negotiation context
- It's been on market 22 days — a 2% lower offer ($196k) is reasonable based on typical stale-listing flexibility.
- 6 sale attempts since 19y ago with the ask held roughly flat each time — persistent listings suggest the price (not the market) is what's stuck; bring a comps-based counter.
Risks & watch-outs
- Climate carrying-cost: moderate flood risk; severe wind risk, 99% chance of damaging wind over 30y; extreme-heat days projected 7→20/yr by 2055 (HVAC capex compounding) — expect insurance premiums to compound above CPI over the hold.
Questions for the listing agent
- What do current leases actually rent for vs. the listed asking? Can we see a recent rent roll and the last 12 months of T-12 income?
- Is there a deadline driving the sale (1031 exchange, divorce, estate, relocation)? That informs how much negotiation room exists.
- The area grade is low — what's the realistic commute time and amenity access for the typical tenant pool here? Any planned neighborhood developments (good or bad) we should know about?
- This sits on a lake — are riparian / water-frontage rights deeded with the parcel? Any dock permits, shoreline easements, or HOA water-use restrictions?
- What's the documented flood / surge / shoreline-erosion history here (FEMA AND non-FEMA — e.g., storm surge, creek backup, septic-field saturation)?
- Any water-quality or seasonal algae-bloom issues that affect tenant satisfaction or short-term-rental demand?
- What's the average days-on-market for RENTAL listings here right now (not sales)? A rising rental-DOM trend means longer vacancies and softer asking-rent achievability than the comps imply.
- What's the recent tenant-quality profile in this submarket — average credit score on applications, eviction rate, late-payment / NSF rate, and stable-employment percentage? A property-management company in the area should have these aggregated.
- How much new for-sale + rental construction is in the pipeline within 1–3 miles? Heavy new supply typically softens prices + rents 12–24 months out; constrained supply supports both.
Investment metrics
- 1% rule
- 0.71% ✗
- Cap rate
- 5.94%
- Cash-on-cash
- -1.27%
- DSCR
- 0.94
- GRM
- 11.8
CMA / ARV
No comps found within radius.
Projected returns pro-forma
4.39% appreciation · 3.0% rent growth · sell at horizon
- IRR
- 10.2%
- Equity multiple
- 1.63×
- Total profit
- $35,137
- Equity at exit
- $105,461
- IRR
- 11.8%
- Equity multiple
- 3.02×
- Total profit
- $112,790
- Equity at exit
- $176,235
Cash invested: $55,720 (down + closing). Projections, not guarantees.
Landlord ↔ Tenant lean methodology
- Overall (STATE)
- 87 Strongly Landlord-Friendly
- State Texas
- 87 Strongly Landlord-Friendly · R+5
- County
- — inherits STATE
- City
- — inherits STATE
ZIP-level market 78368
- Home prices YoY
- 4.7%
- Active inventory
- 112
- Price-to-rent
- 11.8×
Monthly cashflow live
- Estimated rent
- $1,407 medium interval (Pro) →
- Mortgage (P&I)
- −$1,044
- Tax from tax record
- −$44 /mo · $528/yr
- Insurance
- −$83
- HOA
- −$0
- Vacancy / Maint / Mgmt
- −$295
- Net cashflow
- $-59
Break-even live
Sensitivity live
| Price | -10% $54 | -5% $-3 | +0% $-59 | +5% $-115 | +10% $-172 |
|---|---|---|---|---|---|
| Rent | -10% $-170 | -5% $-115 | +0% $-59 | +5% $-3 | +10% $52 |
| Rate | -1.0pp $41 | -0.5pp $-8 | base $-59 | +0.5pp $-110 | +1.0pp $-163 |
UW: 25.0% down · 7.5% · 30yr · 1.5% tax · 5.0% vac · 8.0% maint · 8.0% mgmt
Financing live
Cash to close
- Down payment
- $49,750
- Closing costs
- $5,970
- Reserves months
- —
- Total cash needed
- —
Loan-product check · same deal, 3 products live
Conventional
25% down · 7.5% · 30yr
- Down + closing
- —
- Monthly P&I
- —
- Monthly cashflow
- —
- DSCR
- —
- Eligible?
- —
Personal DTI + credit; lowest rate.
DSCR
20% down · 8.5% · 30yr
- Down + closing
- —
- Monthly P&I
- —
- Monthly cashflow
- —
- DSCR
- —
- Eligible?
- —
No personal income docs; deal must DSCR.
Hard money
10% down · 12.0% · 12mo
- Down + closing
- —
- Monthly P&I
- —
- Monthly cashflow
- —
- DSCR
- —
- Eligible?
- —
Short-term bridge; refi at stabilization.
Listing history 18 events
-
2026-06-21days on market $199,000 Active 22 DOM
-
2026-06-21days on market $199,000 Active 21 DOM
-
2026-06-18days on market $199,000 Active 19 DOM
-
2026-06-17days on market $199,000 Active 18 DOM
-
2026-06-16days on market $199,000 Active 17 DOM
-
2026-06-15days on market $199,000 Active 16 DOM
-
2026-06-15days on market $199,000 Active 15 DOM
-
2026-06-13days on market $199,000 Active 14 DOM
-
2026-06-12days on market $199,000 Active 13 DOM
-
2026-06-10days on market $199,000 Active 10 DOM
-
2026-06-08days on market $199,000 Active 9 DOM
-
2026-06-08days on market $199,000 Active 8 DOM
-
2026-06-05days on market $199,000 Active 6 DOM
-
2026-06-03days on market $199,000 Active 4 DOM
-
2026-06-02days on market $199,000 Active 3 DOM
-
2026-06-01days on market $199,000 Active 2 DOM
-
2026-05-31remarks 693-char remark
-
2026-05-31$199,000 Active 1 DOM
ⓘ Source: listings_history table (triggers on properties + properties_extension) + one-shot
backfill from property_details.listing_events for pre-trigger history.
Tax reassessment forecast TX · Resets to sale price
- Current annual tax
- $528 · $44/mo
- Projected year-2 tax
- $3,642 · $303/mo
- Expected delta
- +$3,113/yr (+$259/mo · 589.3%)
ⓘ Screening estimate from a state-policy table — verify with the county assessor before closing.
Climate risk First Street
- Flood 5/10 Major FEMA zone X (unshaded) · 59% chance over 30 yrs
- Wildfire 2/10 Low
- Heat 9/10 Extreme 7 d/yr ≥110°F today · 20 d/yr by 30 yrs out
- Wind 9/10 Extreme 99% chance of damaging wind over 30 yrs
- Air quality 1/10 Low 0 unhealthy d/yr today · 0 by 30 yrs out
Nearby sold comps map
Loading sold comps map…
Walkable amenities ~0.75 mi
Loading nearby amenities…
Taxation est. · year 1
- Rental income
- $16,885
- − Mortgage interest
- −$11,147
- − Property taxes
- −$528
- − Insurance
- −$995
- − Repairs & maintenance
- −$1,351
- − Management
- −$1,351
- − Depreciation
- −$5,789
- Taxable loss
- −$4,276
- Est. tax savings @ 24.0%
- +$1,026
- After-tax cash flow
- $319/yr
For passive investors: Depreciation is non-cash, so a rental often shows a tax loss while cash-flowing — sheltering income. Rental losses are passive: they offset passive income freely, and up to $25,000/yr can offset ordinary (W-2) income if you actively participate and your MAGI is under $100k (phasing out to $0 by $150k); unused losses carry forward. On sale, claimed depreciation is recaptured at up to 25%, and gains may owe capital-gains tax (a 1031 exchange can defer both). Figures are a year-1 estimate at your 24.0% rate — not tax advice; consult a CPA.
Schools (NCES district)
- District
- Mathis ISD
- NCES district ID
- 4829400
- Math proficiency
- 29% ▼ -13.00%
- Reading proficiency
- 42% ▼ -2.00%
- Median HH income
- $36,954
- Composite
- 29.47/100
- National rank
- #6509
- State rank
- #528 of 826 in TX
Livability — Lakeshore Gardens-Hidden Acres
No livability data for this city. (Only ~50 U.S. cities are tracked.)
Census & demographics
- Census place
- Lakeshore Gardens-Hidden Acres, TX
- Population (ZIP)
- 9,474
Population outlook (San Patricio County) Hauer SSP2
- Today (2025)
- 75,538 people
- By 2030
- 79,575 · +5.3%
- By 2040
- 87,670 · +16.1%
- By 2050
- 96,107 · +27.2%
- By 2075
- 117,984 · +56.2%
- By 2100
- 130,010 · +72.1%
Race, ethnicity, and origin ACS 2023
- Neighborhood character
- Majority Hispanic (61%)
- Race & ethnicity
- Hispanic / Latino 61% White 33% Two or more races 32%
- Hispanic origin (detail)
- Mexican 55%
- Common ancestry
- Romanian 1% Lithuanian 1% Serbian 1%
- Foreign-born
- 1% · Canada
- Languages at home
- 60% English-only · Spanish 39%
Political lean MEDSL · San Patricio
- 2024 margin
- Solid R (+36.4) · D 31.4% · R 67.8%
- 2008→2024 swing
- -19.8pp toward R · 2008: -16.6pp · 2024: -36.4pp
- All cycles
- 2024: R+36.4 2020: R+29.1 2016: R+24.1 2012: R+20.6 2008: R+16.6
Not yet ingested
- Civics
- —
Market trends
- HPI YoY
- ▲ 4.39%
- Current HPI
- 98.6577
- Rent YoY
- —
- Metro
- —
- State GDP YoY
- ▲ 3.95%
- F500 in state
- 110
Industry mix (Fortune 500 HQ in TX)
| Industry | F500 HQs | Revenue |
|---|---|---|
| Energy | 16 | $1,198B |
|
||
| Technology | 5 | $198B |
|
||
| Engineering / Construction | 4 | $72B |
|
||
| Energy Services | 3 | $60B |
|
||
| Utilities | 3 | $41B |
|
||
| Healthcare | 2 | $330B |
|
||
Price history
+151.9% since first listed14 events — show timeline
- 2026-05-30 Listed $199,000 CBMLS
- 2023-05-23 Sold (MLS) — CBMLS
- 2023-05-02 Pending — CBMLS
- 2023-04-29 Contingent — CBMLS
- 2023-04-13 Listed $150,000 CBMLS
- 2022-12-09 Relisted — CBMLS
- 2022-11-29 Pending — CBMLS
- 2022-11-23 Contingent — CBMLS
- 2022-10-24 Listed $150,000 CBMLS
- 2022-10-21 Delisted — CBMLS
- 2022-07-22 Price Changed $189,900 CBMLS
- 2022-06-13 Listed $220,000 CBMLS
- 2008-01-17 Sold (MLS) — CBMLS
- 2007-02-14 Listed $79,000 CBMLS
Property tax history
-10.6%/yrLatest (2025): $528 · -51.9% YoY. Source: county tax records.
Cash-flow waterfall
monthlySold comps — $/sqft
last 12 mo · ≤1 miLoading sold comps…