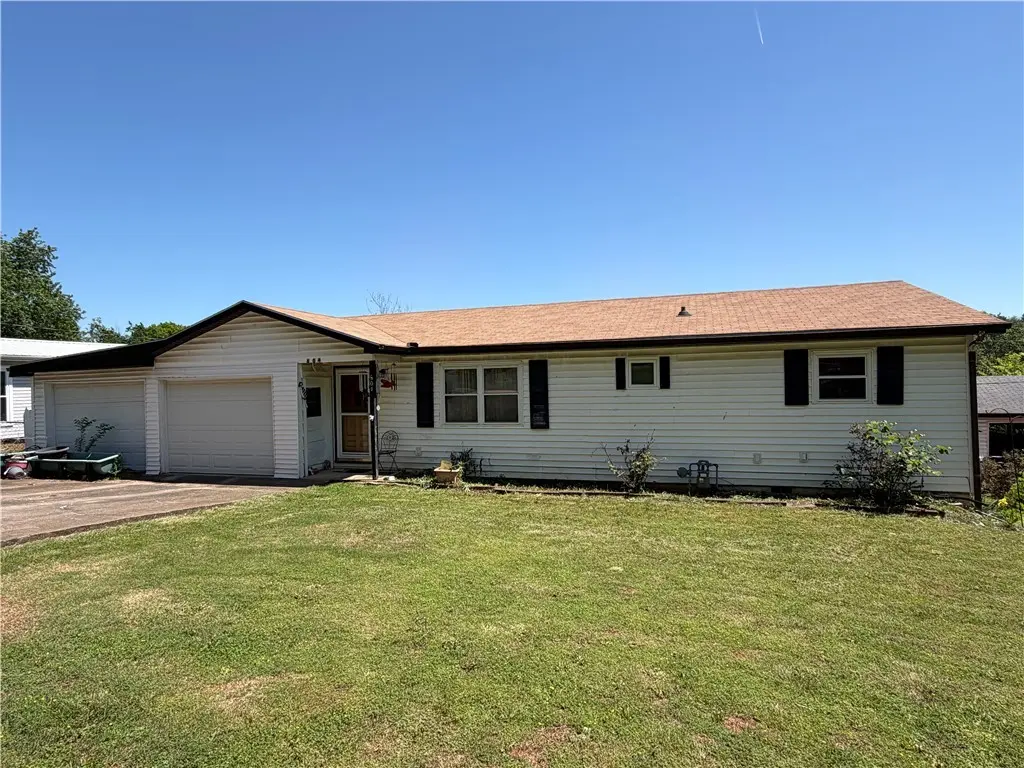
604 Missouri Pl · Huntsville, AR
Flood risk 1/10 · Minimal
- FEMA flood zone
- —
- Chance of flooding over 30 yrs
- 0.0%
- Est. flood insurance / yr
- —
Fire risk 5/10 · Moderate
- Est. fire insurance / yr
- $1,499 – $2,785
Heat risk 4/10 · Minor
- Hot days now (above 104°F)
- 7 days/yr
- Hot days in 30 yrs
- 22 days/yr
Wind risk 2/10 · Minimal
- Chance of severe wind over 30 yrs
- 1.0%
Air-quality risk 2/10 · Minimal
- Unhealthy air days now
- 1 days/yr
- Unhealthy air days in 30 yrs
- 2 days/yr
Risk factors via First Street. Map © Google.
Why this score? — see what drove the C- grade
The composite is a weighted blend of 9 inputs, each scored 0–100. Each bar is that input's sub-score; the figure is the points it added to the 100-point composite (weight × sub-score).
- Cash flow +13.1/30.0
- ARV discount +11.5/15.0
- Appreciation +10.0/10.0
- DSCR +3.9/10.0
- 1% rule +3.7/10.0
- Livability +3.7/5.0
- Schools +2.7/10.0
- Rent growth +2.5/5.0
- Condition / age +2.5/5.0
$164,900
🖨 Deal sheet (PDF) 📄 Offer letter ✓ Due diligence
Listing remarks
Convenient in-town living at an affordable price! This nicely built 1032 sqft home has 3br/1ba with 2 car attached garage, natural gas range, and LVP/vinyl flooring throughout. Outdoors you find low maintenance vinyl siding, vinyl windows, and a newer roof (approx 3 yrs). Lots of additional storage or hobby space in the 8x16 and 12x16 outbuildings. Great location near all the necessities, schedule a showing today!
Key facts
- Vinyl windows
- Newer roof
- Natural gas range
Tags
Property features AI
Finance
- HOA & community: Monthly association fee (amount not specified); Community amenities include biking, trails/paths, shopping, proximity to national forest, state park, fire station and schools
Exterior
- Parking: Attached garage; 2 covered garage spaces; Asphalt driveway; Garage door opener
- Security: Smoke detector(s)
- Utilities: Public water; Sewer available; Electricity available; Natural gas available; Cable available; Fiber optic available; Phone available
- Home design: Single-story; Vinyl siding
- Construction: Vinyl siding construction; Asphalt shingle roof; Crawlspace foundation; Built with double-pane vinyl windows
- Exterior features: Storage structure; Chain link and partial wire fencing; Cleared, city lot in central business district; Public paved road frontage; Smoke detectors
Interior
- Kitchen: Gas range
- Flooring: Vinyl flooring
- Bathrooms: 1 full bathroom
- Heating & cooling: Central heating (electric); Central air conditioning (electric)
- Interior features: Ceiling fans; Eat-in kitchen; Programmable thermostat; Solid surface counters; Window treatments (drapes)
- Laundry & utility: Washer hookup; Dryer hookup; Gas water heater
Neighborhood map
What this means for you Summary
Snapshot
- This is a 3-bed/1.0-bath single-family listed at $165k.
Deal economics
- At list price, monthly cash flow is $-6 ($-74/yr) — negative.
- To cash-flow at today's rent, offer at most $164k (0.5% below list).
- To meet the 1% rule (rent ≥ 1% of price), the offer needs to be $143k (13.0% below list).
- Recommended offer: $143k (13.0% below list) — sets the bar for 1% rule.
- Cap rate 6.2% vs local median 2.8% in Huntsville — top-decile yield for the area; either an underpriced asset or a hidden risk that comps aren't pricing in. Stress-test before assuming the spread holds.
Location & tenants
- Location reads 73/100 on livability (#26 in AR) — a middle-class / working-renter tenant base. Strengths: cost of living A+, housing A+, health & safety A+; Watch: amenities F, commute F, employment F.
- Huntsville School District (rural): math 35% / reading 29% proficiency, ranked #141 of 238 in AR (top 59%) — families likely to look elsewhere, expect single-tenant / working-renter base with shorter leases.
- Zoned schools: Huntsville Middle School (math 47% / reading 41%, grade D, #65 of 201 statewide, top 34%, 472 students, 67% FRL).
- Zoned-school proficiency averages 44% at this address vs 32% district-wide (+12 pts) — the actual schools serving this property are materially stronger than the Huntsville School District average implies; a family-tenant draw the district grade alone would hide.
- Market conditions: 129 active listings in the ZIP; 3 comparable units currently listed for rent nearby; rentals at typical pace (median 25d on market — plan ~3-4 weeks tenant-placement turnaround); 29 units permitted in Madison County in 2024 (0 in 5+ unit buildings).
Forward outlook
- In year one you build about $18k of equity ($1k loan paydown + $16k appreciation (10.0% local appreciation)).
- Madison County population projected to shrink 9% by 2050 — rents likely to lag national; underwrite the cash flow, not the appreciation.
- At projected returns (10.0% appreciation + 3.0% rent growth), your $46k cash investment doubles in ~3 years — after that, you're playing with house money.
- By year 3, paydown + projected appreciation supports a ~$45k cash-out refi (75% LTV) — recoverable capital for the next deal without selling this one.
Negotiation context
- It's been on market 47 days — a 3% lower offer ($160k) is reasonable based on typical stale-listing flexibility.
- 2 sale attempts with the ask held roughly flat each time — persistent listings suggest the price (not the market) is what's stuck; bring a comps-based counter.
Risks & watch-outs
- Climate carrying-cost: moderate wildfire risk — expect insurance premiums to compound above CPI over the hold.
Questions for the listing agent
- What do current leases actually rent for vs. the listed asking? Can we see a recent rent roll and the last 12 months of T-12 income?
- It's been on market 47 days. Have you received any prior offers? Is the seller open to a 13% concession, seller financing, or rate buy-down credit?
- Built in 1974 — when were the roof, HVAC, electrical panel, plumbing, and water heater last replaced?
- Is there a deadline driving the sale (1031 exchange, divorce, estate, relocation)? That informs how much negotiation room exists.
- Schools are F-rated, which usually means shorter tenancies and higher turnover. Who's the typical renter profile here, and what's been the actual vacancy rate?
- What's the average days-on-market for RENTAL listings here right now (not sales)? A rising rental-DOM trend means longer vacancies and softer asking-rent achievability than the comps imply.
- What's the recent tenant-quality profile in this submarket — average credit score on applications, eviction rate, late-payment / NSF rate, and stable-employment percentage? A property-management company in the area should have these aggregated.
- How much new for-sale + rental construction is in the pipeline within 1–3 miles? Heavy new supply typically softens prices + rents 12–24 months out; constrained supply supports both.
Investment metrics
- 1% rule
- 0.87% ✗
- Cap rate
- 6.25%
- Cash-on-cash
- -0.16%
- DSCR
- 0.99
- GRM
- 9.6
CMA / ARV
- ARV (median comp)
- $180,781
- List price
- $164,900
- Delta
- -8.78%
- Verdict
- FAIR
- Comps
- 20 within 1.0 mi
Show comp detail 5 sales within ~0.75 mi
| Address | Dist | Beds/Ba | Sqft | Sold | Price | $/sf | Match |
|---|---|---|---|---|---|---|---|
| 501 Missouri Pl | 0.09mi | 3/1.0 | 1,084 (+5%) | 12mo | $165,500 | $153 | 78 |
| 305 Hawkins Ave | 0.33mi | 3/1.5 | 1,064 (+3%) | 5mo | $189,400 | $178 | 74 |
| 508 Miller St | 0.42mi | 2/1.0 (-1) | 1,034 (+0%) | 19mo | $165,000 | $160 | 59 |
| 921 Gaskill St | 0.69mi | 2/2.0 (-1) | 1,008 (-2%) | 14mo | $180,000 | $179 | 43 |
| 235 Holly St | 0.36mi | 3/2.0 | 1,168 (+13%) | 18mo | $158,550 | $136 | 42 |
Match score weights: distance 35% · size 25% · config 20% · recency 20%. Top-matched comps best support the ARV.
Projected returns pro-forma
10.0% appreciation · 3.0% rent growth · sell at horizon
- IRR
- 24.2%
- Equity multiple
- 2.94×
- Total profit
- $89,440
- Equity at exit
- $148,555
- IRR
- 21.4%
- Equity multiple
- 6.71×
- Total profit
- $263,736
- Equity at exit
- $320,364
Cash invested: $46,172 (down + closing). Projections, not guarantees.
Landlord ↔ Tenant lean methodology
- Overall (STATE)
- 92 Strongly Landlord-Friendly
- State Arkansas
- 92 Strongly Landlord-Friendly · R+14
- County
- — inherits STATE
- City
- — inherits STATE
ZIP-level market 72740
- Home prices YoY
- 19.5%
- Active inventory
- 129
- Price-to-rent
- 9.6×
Monthly cashflow live
- Estimated rent
- $1,435 medium interval (Pro) →
- Mortgage (P&I)
- −$865
- Tax est. 1.5%
- −$206 /mo · $2,474/yr
- Insurance
- −$69
- HOA
- −$0
- Vacancy / Maint / Mgmt
- −$301
- Net cashflow
- $-6
Break-even live
Sensitivity live
| Price | -10% $108 | -5% $51 | +0% $-6 | +5% $-63 | +10% $-120 |
|---|---|---|---|---|---|
| Rent | -10% $-119 | -5% $-63 | +0% $-6 | +5% $51 | +10% $107 |
| Rate | -1.0pp $77 | -0.5pp $36 | base $-6 | +0.5pp $-49 | +1.0pp $-92 |
UW: 25.0% down · 7.5% · 30yr · 1.5% tax · 5.0% vac · 8.0% maint · 8.0% mgmt
Financing live
Cash to close
- Down payment
- $41,225
- Closing costs
- $4,947
- Reserves months
- —
- Total cash needed
- —
Loan-product check · same deal, 3 products live
Conventional
25% down · 7.5% · 30yr
- Down + closing
- —
- Monthly P&I
- —
- Monthly cashflow
- —
- DSCR
- —
- Eligible?
- —
Personal DTI + credit; lowest rate.
DSCR
20% down · 8.5% · 30yr
- Down + closing
- —
- Monthly P&I
- —
- Monthly cashflow
- —
- DSCR
- —
- Eligible?
- —
No personal income docs; deal must DSCR.
Hard money
10% down · 12.0% · 12mo
- Down + closing
- —
- Monthly P&I
- —
- Monthly cashflow
- —
- DSCR
- —
- Eligible?
- —
Short-term bridge; refi at stabilization.
Rent comps 3 comps
| Address | Beds | Baths | Sqft | Rent | $/sqft | DOM | Units | Dist |
|---|---|---|---|---|---|---|---|---|
| 310 Drake Ave Huntsville, AR | 2.0 | 1.0 | 720 | $1,200 | $1.67 | 16d | 1 | 0.37mi |
| 171 Madison St Unit 2415 Huntsville, AR | 3.0 | 2.0 | 1120 | $1,595 | $1.42 | 45d | 1 | 0.66mi |
| 171 Madison St Unit 2415 Huntsville, AR | 3.0 | 2.0 | 1116 | $1,595 | $1.43 | 25d | 1 | 0.66mi |
Listing history 20 events
-
2026-06-21days on market $164,900 Active 47 DOM
-
2026-06-18days on market $164,900 Active 44 DOM
-
2026-06-17days on market $164,900 Active 43 DOM
-
2026-06-16days on market $164,900 Active 42 DOM
-
2026-06-15days on market $164,900 Active 41 DOM
-
2026-06-14days on market $164,900 Active 39 DOM
-
2026-06-13days on market $164,900 Active 38 DOM
-
2026-06-10days on market $164,900 Active 36 DOM
-
2026-06-09days on market $164,900 Active 35 DOM
-
2026-06-08days on market $164,900 Active 34 DOM
-
2026-06-07days on market $164,900 Active 33 DOM
-
2026-06-05days on market $164,900 Active 30 DOM
-
2026-06-03days on market $164,900 Active 29 DOM
-
2026-06-02days on market $164,900 Active 28 DOM
-
2026-06-01days on market $164,900 Active 27 DOM
-
2026-05-31days on market $164,900 Active 26 DOM
-
2026-05-31days on market $164,900 Active 25 DOM
-
2026-05-14status Active 417-char remark
-
2026-04-28status Pending 417-char remark
-
2026-04-20$164,900 Active 417-char remark
ⓘ Source: listings_history table (triggers on properties + properties_extension) + one-shot
backfill from property_details.listing_events for pre-trigger history.
Climate risk First Street
- Flood 1/10 Low 0% chance over 30 yrs
- Wildfire 5/10 Major
- Heat 4/10 Moderate 7 d/yr ≥104°F today · 22 d/yr by 30 yrs out
- Wind 2/10 Low 100% chance of damaging wind over 30 yrs
- Air quality 2/10 Low 1 unhealthy d/yr today · 2 by 30 yrs out
Nearby sold comps map
Loading sold comps map…
Walkable amenities ~0.75 mi
Loading nearby amenities…
Taxation est. · year 1
- Rental income
- $17,217
- − Mortgage interest
- −$9,237
- − Property taxes
- −$2,474
- − Insurance
- −$824
- − Repairs & maintenance
- −$1,377
- − Management
- −$1,377
- − Depreciation
- −$4,797
- Taxable loss
- −$2,870
- Est. tax savings @ 24.0%
- +$689
- After-tax cash flow
- $615/yr
For passive investors: Depreciation is non-cash, so a rental often shows a tax loss while cash-flowing — sheltering income. Rental losses are passive: they offset passive income freely, and up to $25,000/yr can offset ordinary (W-2) income if you actively participate and your MAGI is under $100k (phasing out to $0 by $150k); unused losses carry forward. On sale, claimed depreciation is recaptured at up to 25%, and gains may owe capital-gains tax (a 1031 exchange can defer both). Figures are a year-1 estimate at your 24.0% rate — not tax advice; consult a CPA.
Schools (NCES district)
- District
- Huntsville School District
- NCES district ID
- 0508130
- Math proficiency
- 35% ▼ -7.00%
- Reading proficiency
- 29% ▼ -7.00%
- Median HH income
- $37,770
- Composite
- 26.72/100
- National rank
- #7146
- State rank
- #141 of 238 in AR
Livability — Huntsville
- Score
- 73/100
- State rank
- #26
- US rank
- #5604
Category grades
Schools grade is shown separately in the Schools card above.
Census & demographics
- Census place
- Huntsville, AR
- Population (ZIP)
- 10,226
Population outlook (Madison County) Hauer SSP2
- Today (2025)
- 15,655 people
- By 2030
- 15,418 · -1.5%
- By 2040
- 14,824 · -5.3%
- By 2050
- 14,198 · -9.3%
- By 2075
- 12,827 · -18.1%
- By 2100
- 10,871 · -30.6%
Race, ethnicity, and origin ACS 2023
- Neighborhood character
- Predominantly White (73%)
- Race & ethnicity
- White 73% Two or more races 22% Hispanic / Latino 4% Pacific Islander 1%
- Common ancestry
- Italian 3% Lithuanian 2% Slovak 2%
- Foreign-born
- 2% · Canada
- Languages at home
- 98% English-only · Spanish 1% Other Asian/Pacific 1%
Political lean MEDSL · Madison
- 2024 margin
- Solid R (+58.6) · D 19.9% · R 78.5% · Other 1.7%
- 2008→2024 swing
- -29.7pp toward R · 2008: -28.9pp · 2024: -58.6pp
- All cycles
- 2024: R+58.6 2020: R+55.7 2016: R+49.1 2012: R+32.9 2008: R+28.9
Not yet ingested
- Civics
- —
Market trends
- HPI YoY
- ▲ 57.73%
- Current HPI
- 353.404
- Rent YoY
- —
- Metro
- —
- State GDP YoY
- ▲ 3.80%
- F500 in state
- 10
Industry mix (Fortune 500 HQ in AR)
| Industry | F500 HQs | Revenue |
|---|---|---|
| Retail | 1 | $681B |
|
||
| Food / Agriculture | 1 | $53B |
|
||
| Retail / Energy | 1 | $22B |
|
||
| Transportation / Logistics | 1 | $12B |
|
||
| Energy | 1 | $4B |
|
||
Price history
3 events — show timeline
- 2026-05-14 Relisted — NWARMLS
- 2026-04-28 Pending — NWARMLS
- 2026-04-20 Listed $164,900 NWARMLS
Property tax history
-5.7%/yrLatest (2025): $77 · +0.0% YoY. Source: county tax records.
Cash-flow waterfall
monthlySold comps — $/sqft
last 12 mo · ≤1 miLoading sold comps…