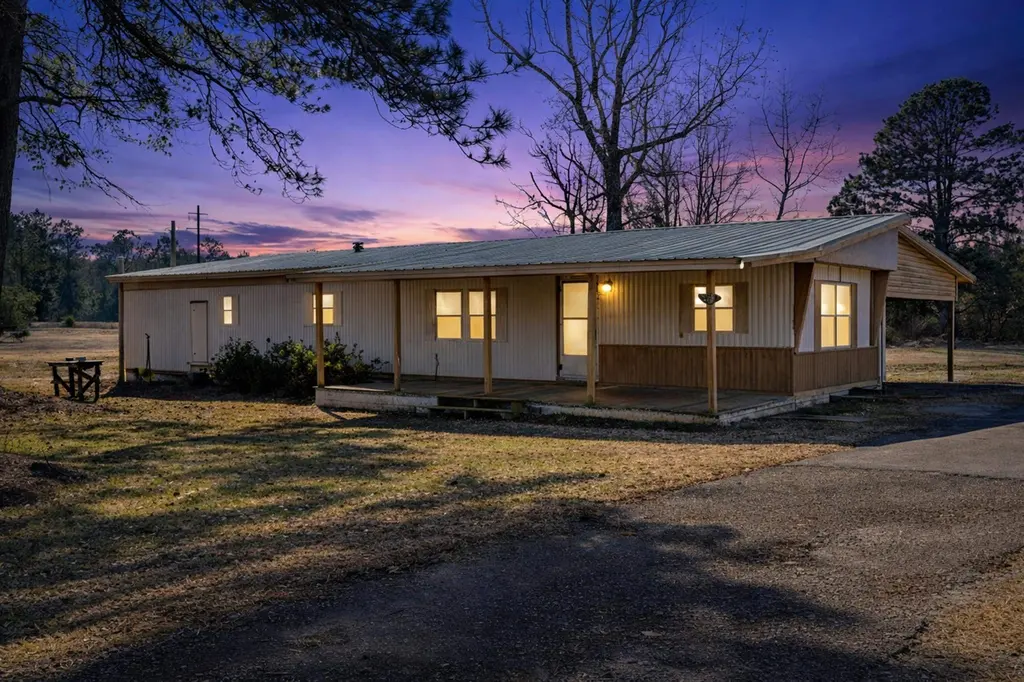
2931 Fm 31 N · De Berry, TX
Flood risk 1/10 · Minimal
- FEMA flood zone
- —
- Chance of flooding over 30 yrs
- 0.0%
- Est. flood insurance / yr
- —
Fire risk 5/10 · Moderate
- Est. fire insurance / yr
- $1,222 – $2,270
Heat risk 7/10 · Major
- Hot days now (above 110°F)
- 7 days/yr
- Hot days in 30 yrs
- 23 days/yr
Wind risk 6/10 · Moderate
- Chance of severe wind over 30 yrs
- 66.0%
Air-quality risk 2/10 · Minimal
- Unhealthy air days now
- 1 days/yr
- Unhealthy air days in 30 yrs
- 1 days/yr
Risk factors via First Street. Map © Google.
Why this score? — see what drove the C+ grade
The composite is a weighted blend of 9 inputs, each scored 0–100. Each bar is that input's sub-score; the figure is the points it added to the 100-point composite (weight × sub-score).
- Cash flow +27.2/30.0
- DSCR +9.5/10.0
- 1% rule +6.7/10.0
- Appreciation +5.0/10.0
- Schools +4.5/10.0
- Rent growth +2.5/5.0
- Livability +2.5/5.0
- Condition / age +2.5/5.0
- ARV discount +0.0/15.0
$139,999
🖨 Deal sheet (PDF) 📄 Offer letter ✓ Due diligence
Listing remarks MLS
Five acres in Elysian Fields ISD with a mobile home and workshop ready for you to build your dream home! This property has lots of potential, move in and live in it exactly as it is or it could be a great place to stay while building, a mother in law home or a rental. There is currently a second mobile home toward the back of the property that is being moved and does not go with the land.
Key facts
- Second mobile home
- Mobile home
- Five acres
Tags
Neighborhood map
What this means for you Summary
Snapshot
- This is a 3-bed/2.0-bath manufactured listed at $140k.
Deal economics
- At list price, monthly cash flow is $401 ($5k/yr) — positive.
- The deal already cash-flows at list — no discount required.
- Meets the 1% rule at list price ($2k rent vs $140k).
- Recommended offer: $123k (12.0% below list) — sets the bar for market timing.
Location & tenants
- Location reads: area grade C — affects rentability + tenant quality, not the cash-flow math above.
- Elysian Fields ISD (rural): math 52% / reading 54% proficiency, ranked #136 of 826 in TX (top 16%) — acceptable for families but not a draw, mixed tenant base, ~2y average lease.
- Zoned schools: Elysian Fields El (math 47% / reading 52%, grade D, #865 of 4,322 statewide, top 21%, 374 students, 50% FRL); Elysian Fields Middle (math 57% / reading 52%, grade B-, #256 of 1,662 statewide, top 16%, 180 students, 52% FRL); Elysian Fields H S (math 62% / reading 62%, grade B-, #237 of 1,632 statewide, top 16%, 259 students, 39% FRL) — zoned schools at 47% FRL track the district average.
- Market conditions: 41 active listings in the ZIP; 6 units permitted in Panola County in 2024 (0 in 5+ unit buildings).
Forward outlook
- In year one you build about $5k of equity ($968 loan paydown + $4k appreciation (3.0% local appreciation)).
- Panola County population projected at -14% by 2050 — secular population decline; favor cash flow + early exit over multi-decade hold.
- At projected returns (3.0% appreciation + 3.0% rent growth), your $39k cash investment doubles in ~4 years — after that, you're playing with house money.
- By year 7, paydown + projected appreciation supports a ~$33k cash-out refi (75% LTV) — recoverable capital for the next deal without selling this one.
Negotiation context
- It's been on market 136 days — a 12% lower offer ($123k) is reasonable based on typical stale-listing flexibility.
Risks & watch-outs
- Climate carrying-cost: major wind risk, 66% chance of damaging wind over 30y; moderate wildfire risk; extreme-heat days projected 7→23/yr by 2055 (HVAC capex compounding) — expect insurance premiums to compound above CPI over the hold.
Questions for the listing agent
- It's been on market 136 days. Have you received any prior offers? Is the seller open to a 12% concession, seller financing, or rate buy-down credit?
- Why hasn't it sold? Are there any deal-killer items the seller is aware of (foundation, flood, title, zoning, code violations)?
- Is there a deadline driving the sale (1031 exchange, divorce, estate, relocation)? That informs how much negotiation room exists.
- What's the average days-on-market for RENTAL listings here right now (not sales)? A rising rental-DOM trend means longer vacancies and softer asking-rent achievability than the comps imply.
- What's the recent tenant-quality profile in this submarket — average credit score on applications, eviction rate, late-payment / NSF rate, and stable-employment percentage? A property-management company in the area should have these aggregated.
- How much new for-sale + rental construction is in the pipeline within 1–3 miles? Heavy new supply typically softens prices + rents 12–24 months out; constrained supply supports both.
Investment metrics
- 1% rule
- 1.17% ✓
- Cap rate
- 9.73%
- Cash-on-cash
- 12.28%
- DSCR
- 1.55
- GRM
- 7.1
CMA / ARV
- ARV (median comp)
- $118,011
- List price
- $139,999
- Delta
- 18.63%
- Verdict
- OVERPRICED
- Comps
- 1 within 2.0 mi
Projected returns pro-forma
3.0% appreciation · 3.0% rent growth · sell at horizon
- IRR
- 19.0%
- Equity multiple
- 2.08×
- Total profit
- $42,400
- Equity at exit
- $62,950
- IRR
- 20.3%
- Equity multiple
- 3.94×
- Total profit
- $115,114
- Equity at exit
- $97,013
Cash invested: $39,200 (down + closing). Projections, not guarantees.
Landlord ↔ Tenant lean methodology
- Overall (STATE)
- 87 Strongly Landlord-Friendly
- State Texas
- 87 Strongly Landlord-Friendly · R+5
- County
- — inherits STATE
- City
- — inherits STATE
ZIP-level market 75639
- Active inventory
- 41
- Price-to-rent
- 7.1×
Monthly cashflow live
- Estimated rent
- $1,636 medium interval (Pro) →
- Mortgage (P&I)
- −$734
- Tax from tax record
- −$99 /mo · $1,186/yr
- Insurance
- −$58
- HOA
- −$0
- Vacancy / Maint / Mgmt
- −$344
- Net cashflow
- $401
Break-even live
Sensitivity live
| Price | -10% $481 | -5% $441 | +0% $401 | +5% $362 | +10% $322 |
|---|---|---|---|---|---|
| Rent | -10% $272 | -5% $337 | +0% $401 | +5% $466 | +10% $531 |
| Rate | -1.0pp $472 | -0.5pp $437 | base $401 | +0.5pp $365 | +1.0pp $328 |
UW: 25.0% down · 7.5% · 30yr · 1.5% tax · 5.0% vac · 8.0% maint · 8.0% mgmt
Financing live
Cash to close
- Down payment
- $35,000
- Closing costs
- $4,200
- Reserves months
- —
- Total cash needed
- —
Loan-product check · same deal, 3 products live
Conventional
25% down · 7.5% · 30yr
- Down + closing
- —
- Monthly P&I
- —
- Monthly cashflow
- —
- DSCR
- —
- Eligible?
- —
Personal DTI + credit; lowest rate.
DSCR
20% down · 8.5% · 30yr
- Down + closing
- —
- Monthly P&I
- —
- Monthly cashflow
- —
- DSCR
- —
- Eligible?
- —
No personal income docs; deal must DSCR.
Hard money
10% down · 12.0% · 12mo
- Down + closing
- —
- Monthly P&I
- —
- Monthly cashflow
- —
- DSCR
- —
- Eligible?
- —
Short-term bridge; refi at stabilization.
Listing history 24 events
-
2026-06-22days on market $139,999 Active 136 DOM
-
2026-06-21days on market $139,999 Active 135 DOM
-
2026-06-21days on market $139,999 Active 134 DOM
-
2026-06-18days on market $139,999 Active 132 DOM
-
2026-06-17days on market $139,999 Active 131 DOM
-
2026-06-16days on market $139,999 Active 130 DOM
-
2026-06-15days on market $139,999 Active 129 DOM
-
2026-06-13days on market $139,999 Active 127 DOM
-
2026-06-12days on market $139,999 Active 126 DOM
-
2026-06-09days on market $139,999 Active 123 DOM
-
2026-06-08days on market $139,999 Active 122 DOM
-
2026-06-08days on market $139,999 Active 121 DOM
-
2026-06-07days on market $139,999 Active 120 DOM
-
2026-06-03days on market $139,999 Active 117 DOM
-
2026-06-02days on market $139,999 Active 116 DOM
-
2026-06-01days on market $139,999 Active 115 DOM
-
2026-05-31days on market $139,999 Active 114 DOM
-
2026-02-06$139,999 Active 391-char remark
Show marketing remark (391 chars)
Five acres in Elysian Fields ISD with a mobile home and workshop ready for you to build your dream home! This property has lots of potential, move in and live in it exactly as it is or it could be a great place to stay while building, a mother in law home or a rental. There is currently a second mobile home toward the back of the property that is being moved and does not go with the land.
-
2007-09-12soldstatus
-
2002-02-26soldstatus
-
2002-02-26soldstatus
-
1995-10-06soldstatus
-
1995-01-25soldstatus
-
1984-03-01soldstatus
ⓘ Source: listings_history table (triggers on properties + properties_extension) + one-shot
backfill from property_details.listing_events for pre-trigger history.
Tax reassessment forecast TX · Resets to sale price
- Current annual tax
- $1,186 · $99/mo
- Projected year-2 tax
- $2,562 · $213/mo
- Expected delta
- +$1,376/yr (+$115/mo · 116.0%)
ⓘ Screening estimate from a state-policy table — verify with the county assessor before closing.
Climate risk First Street
- Flood 1/10 Low 0% chance over 30 yrs
- Wildfire 5/10 Major
- Heat 7/10 Severe 7 d/yr ≥110°F today · 23 d/yr by 30 yrs out
- Wind 6/10 Major 66% chance of damaging wind over 30 yrs
- Air quality 2/10 Low 1 unhealthy d/yr today · 1 by 30 yrs out
Nearby sold comps map
Loading sold comps map…
Walkable amenities ~0.75 mi
Loading nearby amenities…
Taxation est. · year 1
- Rental income
- $19,635
- − Mortgage interest
- −$7,842
- − Property taxes
- −$1,186
- − Insurance
- −$700
- − Repairs & maintenance
- −$1,571
- − Management
- −$1,571
- − Depreciation
- −$4,073
- Taxable income
- $2,692
- Est. tax owed @ 24.0%
- −$646
- After-tax cash flow
- $4,169/yr
For passive investors: Depreciation is non-cash, so a rental often shows a tax loss while cash-flowing — sheltering income. Rental losses are passive: they offset passive income freely, and up to $25,000/yr can offset ordinary (W-2) income if you actively participate and your MAGI is under $100k (phasing out to $0 by $150k); unused losses carry forward. On sale, claimed depreciation is recaptured at up to 25%, and gains may owe capital-gains tax (a 1031 exchange can defer both). Figures are a year-1 estimate at your 24.0% rate — not tax advice; consult a CPA.
Schools (NCES district)
- District
- Elysian Fields ISD
- NCES district ID
- 4818480
- Math proficiency
- 52% ▼ -3.00%
- Reading proficiency
- 54% ▲ 2.00%
- Median HH income
- $48,512
- Composite
- 45.13/100
- National rank
- #2684
- State rank
- #136 of 826 in TX
Livability — De Berry
No livability data for this city. (Only ~50 U.S. cities are tracked.)
Census & demographics
- Population (ZIP)
- 2,698
Population outlook (Panola County) Hauer SSP2
- Today (2025)
- 23,273 people
- By 2030
- 22,845 · -1.8%
- By 2040
- 21,652 · -7.0%
- By 2050
- 20,107 · -13.6%
- By 2075
- 15,709 · -32.5%
- By 2100
- 11,013 · -52.7%
Race, ethnicity, and origin ACS 2023
- Neighborhood character
- Predominantly White (71%)
- Race & ethnicity
- White 71% Black 21% Two or more races 6% Hispanic / Latino 3%
- Common ancestry
- Lithuanian 7% Italian 3% Slovak 2%
- Foreign-born
- 2% · Canada
- Languages at home
- 94% English-only · Spanish 6%
Political lean MEDSL · Panola
- 2024 margin
- Solid R (+66.4) · D 16.7% · R 83.1%
- 2008→2024 swing
- -17.5pp toward R · 2008: -48.9pp · 2024: -66.4pp
- All cycles
- 2024: R+66.4 2020: R+63.5 2016: R+63.5 2012: R+56.1 2008: R+48.9
Not yet ingested
- Civics
- —
Market trends
- HPI YoY
- —
- Current HPI
- —
- Rent YoY
- —
- Metro
- —
- State GDP YoY
- ▲ 3.95%
- F500 in state
- 110
Industry mix (Fortune 500 HQ in TX)
| Industry | F500 HQs | Revenue |
|---|---|---|
| Energy | 16 | $1,198B |
|
||
| Technology | 5 | $198B |
|
||
| Engineering / Construction | 4 | $72B |
|
||
| Energy Services | 3 | $60B |
|
||
| Utilities | 3 | $41B |
|
||
| Healthcare | 2 | $330B |
|
||
Price history
7 events — show timeline
- 2026-02-06 Listed $139,999 LAAR
- 2007-09-12 Sold (Public Records) — Public Records
- 2002-02-26 Sold (Public Records) — Public Records
- 2002-02-26 Sold (Public Records) — Public Records
- 1995-10-06 Sold (Public Records) — Public Records
- 1995-01-25 Sold (Public Records) — Public Records
- 1984-03-01 Sold (Public Records) — Public Records
Property tax history
+2.5%/yrLatest (2025): $1,186 · +11.1% YoY. Source: county tax records.
Cash-flow waterfall
monthlySold comps — $/sqft
last 12 mo · ≤1 miLoading sold comps…