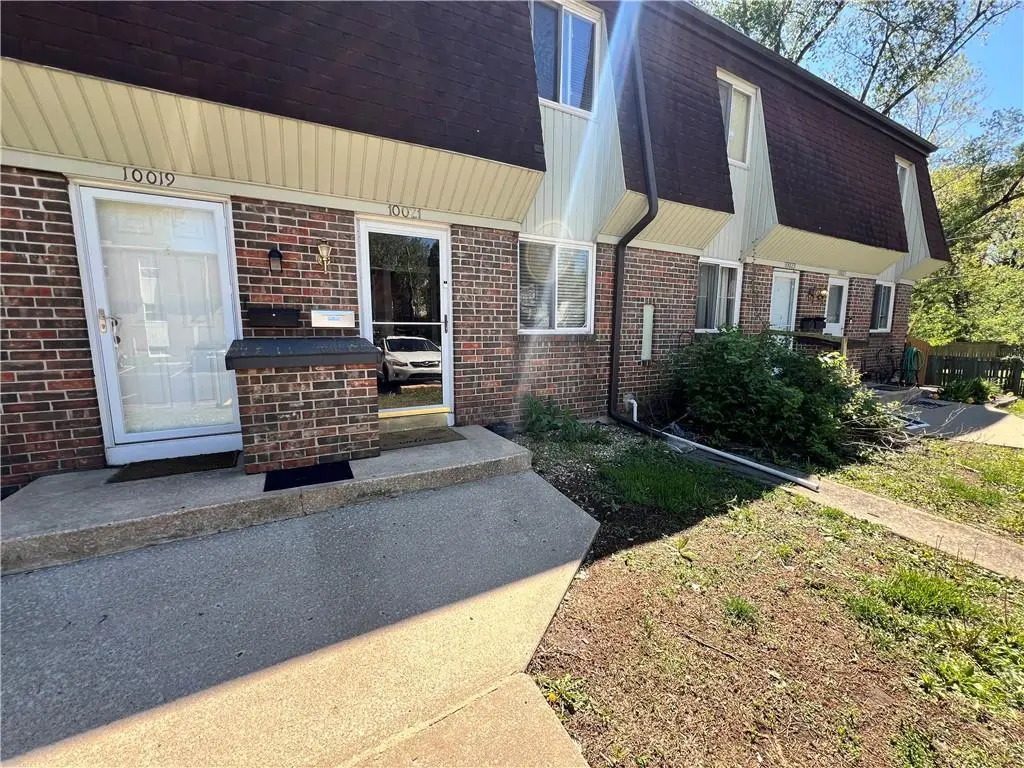
10021 W 52nd St · Merriam, KS
Flood risk No data
- FEMA flood zone
- —
- Chance of flooding over 30 yrs
- —
- Est. flood insurance / yr
- —
Fire risk No data
- Est. fire insurance / yr
- —
Heat risk No data
- Hot days now (above threshold)
- —
- Hot days in 30 yrs
- —
Wind risk No data
- Chance of severe wind over 30 yrs
- —
Air-quality risk No data
- Unhealthy air days now
- —
- Unhealthy air days in 30 yrs
- —
Risk factors via First Street. Map © Google.
Why this score? — see what drove the D+ grade
The composite is a weighted blend of 9 inputs, each scored 0–100. Each bar is that input's sub-score; the figure is the points it added to the 100-point composite (weight × sub-score).
- Cash flow +12.8/30.0
- ARV discount +12.3/15.0
- 1% rule +4.0/10.0
- Livability +3.9/5.0
- DSCR +3.8/10.0
- Schools +3.8/10.0
- Rent growth +2.5/5.0
- Condition / age +2.5/5.0
- Appreciation +0.0/10.0
$195,000
🖨 Deal sheet 📄 Offer letter ✓ Due diligence
Listing remarks MLS
Best Value in Merriam, 2 story townhome with finished walkout basement, 100% move in ready, Brand New Carpet, new kitchen counters, new dishwasher, new stove, fresh paint, new LVT floor in bathroom, Large deck in private back yard. rare opportunity for under 100K in JoCo.
Key facts
- $130 HOA
- Built 1971
- Listed 61 days
Property features AI
Finance
- HOA & community: HOA with a $100 monthly fee; HOA covers building maintenance, lawn service, snow removal and trash; Maintenance provided
Exterior
- Parking: Off-street parking
- Utilities: Public water; Public sewer
- Home design: Attached townhouse; 2 stories
- Construction: Brick/mortar construction; Composition roof
- Exterior features: Deck; Privacy wood fencing
Interior
- Kitchen: Dishwasher; Disposal; Microwave; Electric range; Refrigerator
- Bedrooms: 2 bedrooms (both on the second floor)
- Flooring: Carpet
- Bathrooms: 1 full bathroom; 2 half bathrooms
- Heating & cooling: Forced air heating; Electric cooling
- Interior features: Painted cabinets; Finished basement with walk-out access and sump pump; Eat-in kitchen; Family room / recreation room
- Laundry & utility: Washer; Dryer (laundry located in basement)
Neighborhood map
What this means for you Summary
Snapshot
- This is a 2-bed/2.0-bath townhouse listed at $195k.
Deal economics
- At list price, monthly cash flow is $-16 ($-197/yr) — negative.
- To cash-flow at today's rent, offer at most $192k (1.5% below list).
- To meet the 1% rule (rent ≥ 1% of price), the offer needs to be $176k (9.7% below list).
- Recommended offer: $176k (9.7% below list) — sets the bar for 1% rule.
- Cap rate 6.2% vs local median 3.9% in Merriam — top-decile yield for the area; either an underpriced asset or a hidden risk that comps aren't pricing in. Stress-test before assuming the spread holds.
Location & tenants
- Location reads 77/100 on livability (#43 in KS, #3,248 nationally) — a middle-class / working-renter tenant base. Strengths: commute A+, cost of living A+, housing A+; Watch: crime F.
- Shawnee Mission Pub Schools (suburban): math 38% / reading 46% proficiency, ranked #22 of 169 in KS (top 13%) — families likely to look elsewhere, expect single-tenant / working-renter base with shorter leases.
- Zoned schools: Merriam Park Elementary (math 29% / reading 39%, grade F, #416 of 684 statewide, top 61%, 431 students, 58% FRL) — zoned schools average 58% FRL vs 29% district-wide (29 pts higher); higher-poverty schools than district average — tighter screening recommended.
- Market conditions: 80 active listings in the ZIP; 11 comparable units currently listed for rent nearby; rentals leasing fast (median 8d on market — plan ~1-2 weeks tenant-placement turnaround); solid renter incomes; 2,969 units permitted in Johnson County in 2024 (1,066 in 5+ unit buildings).
Forward outlook
- Local home prices are declining (-3.0%/yr); year-one equity from $1k of loan paydown is wiped out by about $6k of value loss. Plan a longer hold.
- Johnson County population projected at +27% by 2050 — long-run rental-demand tailwind backs the buy-and-hold thesis.
Negotiation context
- It's been on market 61 days — a 6% lower offer ($183k) is reasonable based on typical stale-listing flexibility.
- 3 sale attempts since 6y ago; this cycle's ask has dropped $15k (7%) from the opening price — seller is motivated, your offer sets the floor, not the list.
Questions for the listing agent
- What do current leases actually rent for vs. the listed asking? Can we see a recent rent roll and the last 12 months of T-12 income?
- It's been on market 61 days. Have you received any prior offers? Is the seller open to a 10% concession, seller financing, or rate buy-down credit?
- Built in 1971 — when were the roof, HVAC, electrical panel, plumbing, and water heater last replaced?
- What does the HOA fee cover, when was the last increase, and are there any pending special assessments or reserve-fund shortfalls?
- Why hasn't it sold? Are there any deal-killer items the seller is aware of (foundation, flood, title, zoning, code violations)?
- Is there a deadline driving the sale (1031 exchange, divorce, estate, relocation)? That informs how much negotiation room exists.
- Crime grade is F in this area — have there been break-ins, vandalism, or insurance claims at this property in the last 3 years? What carrier currently insures it and at what premium?
- The area grade is low — what's the realistic commute time and amenity access for the typical tenant pool here? Any planned neighborhood developments (good or bad) we should know about?
- What's the average days-on-market for RENTAL listings here right now (not sales)? A rising rental-DOM trend means longer vacancies and softer asking-rent achievability than the comps imply.
- What's the recent tenant-quality profile in this submarket — average credit score on applications, eviction rate, late-payment / NSF rate, and stable-employment percentage? A property-management company in the area should have these aggregated.
- How much new for-sale + rental construction is in the pipeline within 1–3 miles? Heavy new supply typically softens prices + rents 12–24 months out; constrained supply supports both.
Investment metrics
- 1% rule
- 0.90% ✗
- Cap rate
- 6.19%
- Cash-on-cash
- -0.36%
- DSCR
- 0.98
- GRM
- 9.2
CMA / ARV
- ARV (on-the-fly)
- $218,300
- Comps found
- 6
Show comp detail 6 sales within ~0.75 mi
| Address | Dist | Beds/Ba | Sqft | Sold | Price | $/sf | Match |
|---|---|---|---|---|---|---|---|
| 5225 Farley Ct | 0.17mi | 2/1.5 | 1,256 (+6%) | 9mo | $190,000 | $151 | 72 |
| 9915 W 52nd St | 0.06mi | 3/1.5 (+1) | 1,210 (+2%) | 23mo | $175,000 | $145 | 67 |
| 9929 W 52 St | 0.04mi | 3/2.5 (+1) | 1,320 (+12%) | 24mo | $200,000 | $152 | 51 |
| 9402 W 48th Ter | 0.60mi | 2/1.5 | 1,056 (-10%) | 3mo | $215,000 | $204 | 50 |
| 9354 W 48th Ter | 0.64mi | 2/1.0 | 1,056 (-10%) | 13mo | $195,000 | $185 | 38 |
| 5613 Hayes St | 0.67mi | 3/2.0 (+1) | 1,089 (-8%) | 19mo | $240,000 | $220 | 35 |
Match score weights: distance 35% · size 25% · config 20% · recency 20%. Top-matched comps best support the ARV.
Projected returns pro-forma
-3.0% appreciation · 3.0% rent growth · sell at horizon
- IRR
- -16.9%
- Equity multiple
- 0.40×
- Total profit
- $-32,578
- Equity at exit
- $29,075
- IRR
- -8.6%
- Equity multiple
- 0.46×
- Total profit
- $-29,453
- Equity at exit
- $16,860
Cash invested: $54,600 (down + closing). Projections, not guarantees.
Landlord ↔ Tenant lean methodology
- Overall (STATE)
- 83 Strongly Landlord-Friendly
- State Kansas
- 83 Strongly Landlord-Friendly · R+10
- County
- — inherits STATE
- City
- — inherits STATE
ZIP-level market 66203
- Active inventory
- 80
- Price-to-rent
- 9.2×
Monthly cashflow live
- Estimated rent
- $1,761 high interval (Pro) →
- Mortgage (P&I)
- −$1,023
- Tax from tax record
- −$174 /mo · $2,088/yr
- Insurance
- −$81
- HOA
- −$130
- Vacancy / Maint / Mgmt
- −$370
- Net cashflow
- $-16
Break-even live
UW: 25.0% down · 7.5% · 30yr · 1.5% tax · 5.0% vac · 8.0% maint · 8.0% mgmt
Financing live
Cash to close
- Down payment
- $48,750
- Closing costs
- $5,850
- Reserves months
- —
- Total cash needed
- —
Loan-product check · same deal, 3 products live
Conventional
25% down · 7.5% · 30yr
- Down + closing
- —
- Monthly P&I
- —
- Monthly cashflow
- —
- DSCR
- —
- Eligible?
- —
Personal DTI + credit; lowest rate.
DSCR
20% down · 8.5% · 30yr
- Down + closing
- —
- Monthly P&I
- —
- Monthly cashflow
- —
- DSCR
- —
- Eligible?
- —
No personal income docs; deal must DSCR.
Hard money
10% down · 12.0% · 12mo
- Down + closing
- —
- Monthly P&I
- —
- Monthly cashflow
- —
- DSCR
- —
- Eligible?
- —
Short-term bridge; refi at stabilization.
Rent comps 11 comps
| Address | Beds | Baths | Sqft | Rent | $/sqft | DOM | Units | Dist |
|---|---|---|---|---|---|---|---|---|
| 5402 Knox Ave Shawnee, KS | 3.0 | 2.5 | 1250 | $2,450 | $1.96 | 1d | 1 | 0.34mi |
| 4813 Woodward St Shawnee, KS | 3.0 | 2.0 | 1050 | $1,695 | $1.61 | 3d | 1 | 1.13mi |
| 5938 Barton Dr Shawnee, KS | 2.0 | 2.0 | 977 | $3,250 | $3.33 | 1d | 1 | 1.21mi |
| 6016 Roger Rd Shawnee, KS | 2.0 | 1.0–2.0 | 951 | $1,794 | $1.89 | 1d | 3 | 1.24mi |
| 11221 W 60th St Apt D Shawnee, KS | 2.0 | 1.0 | 950 | $1,295 | $1.36 | 23d | 1 | 1.26mi |
| 10302 W 62nd St Unit B09 Shawnee, KS | 2.0 | 2.0 | 900 | $1,350 | $1.50 | 23d | 1 | 1.27mi |
| 11210 W 60th Ter Unit D Shawnee, KS | 2.0 | 1.0 | 950 | $1,295 | $1.36 | 7d | 1 | 1.28mi |
| 12141 W 55th St Unit 4 Shawnee, KS | 2.0 | 1.0 | 700 | $950 | $1.36 | 7d | 1 | 1.37mi |
| 2633 S 49th St Kansas City, KS | 3.0 | 1.0 | 816 | $1,350 | $1.65 | 7d | 1 | 1.41mi |
| 2550 S 51st St Kansas City, KS | 2.0 | 1.0 | 744 | $1,395 | $1.88 | 20d | 1 | 1.42mi |
| 12029 W 58th Pl Unit K Shawnee, KS | 2.0 | 2.0 | 796 | $1,595 | $2.00 | 23d | 1 | 1.49mi |
HOA detail
- Monthly dues
- $130 · $1,560/yr
Listing history 23 events
-
2026-06-18days on market $195,000 Active 61 DOM
-
2026-06-17days on market $195,000 Active 60 DOM
-
2026-06-16days on market $195,000 Active 59 DOM
-
2026-06-15days on market $195,000 Active 58 DOM
-
2026-06-13days on market $195,000 Active 56 DOM
-
2026-06-13days on market $195,000 Active 55 DOM
-
2026-06-09days on market $195,000 Active 52 DOM
-
2026-06-08days on market $195,000 Active 51 DOM
-
2026-06-07days on market $195,000 Active 50 DOM
-
2026-06-05pricedays on market $195,000 Active 47 DOM
-
2026-06-03days on market $205,000 Active 46 DOM
-
2026-06-02days on market $205,000 Active 45 DOM
-
2026-06-01days on market $205,000 Active 44 DOM
-
2026-05-31days on market $205,000 Active 43 DOM
-
2026-05-11price $205,000
-
2026-04-20status Active
-
2026-04-15historical
-
2026-04-13$210,000 Active
-
2026-04-13historical $210,000
-
2021-01-27soldstatus
-
2021-01-26soldstatus Closed 272-char remark
Show marketing remark (272 chars)
Best Value in Merriam, 2 story townhome with finished walkout basement, 100% move in ready, Brand New Carpet, new kitchen counters, new dishwasher, new stove, fresh paint, new LVT floor in bathroom, Large deck in private back yard. rare opportunity for under 100K in JoCo.
-
2020-12-18status Pending 272-char remark
Show marketing remark (272 chars)
Best Value in Merriam, 2 story townhome with finished walkout basement, 100% move in ready, Brand New Carpet, new kitchen counters, new dishwasher, new stove, fresh paint, new LVT floor in bathroom, Large deck in private back yard. rare opportunity for under 100K in JoCo.
-
2020-12-17$95,000 Active 272-char remark
Show marketing remark (272 chars)
Best Value in Merriam, 2 story townhome with finished walkout basement, 100% move in ready, Brand New Carpet, new kitchen counters, new dishwasher, new stove, fresh paint, new LVT floor in bathroom, Large deck in private back yard. rare opportunity for under 100K in JoCo.
ⓘ Source: listings_history table (triggers on properties + properties_extension) + one-shot
backfill from property_details.listing_events for pre-trigger history.
Tax reassessment forecast KS · Resets to sale price
- Current annual tax
- $2,088 · $174/mo
- Projected year-2 tax
- $2,750 · $229/mo
- Expected delta
- +$662/yr (+$55/mo · 31.7%)
ⓘ Screening estimate from a state-policy table — verify with the county assessor before closing.
Nearby sold comps map
Loading sold comps map…
Walkable amenities ~0.75 mi
Loading nearby amenities…
Taxation est. · year 1
- Rental income
- $21,136
- − Mortgage interest
- −$10,923
- − Property taxes
- −$2,088
- − Insurance
- −$975
- − Repairs & maintenance
- −$1,691
- − Management
- −$1,691
- − HOA
- −$1,560
- − Depreciation
- −$5,673
- Taxable loss
- −$3,464
- Est. tax savings @ 24.0%
- +$831
- After-tax cash flow
- $635/yr
For passive investors: Depreciation is non-cash, so a rental often shows a tax loss while cash-flowing — sheltering income. Rental losses are passive: they offset passive income freely, and up to $25,000/yr can offset ordinary (W-2) income if you actively participate and your MAGI is under $100k (phasing out to $0 by $150k); unused losses carry forward. On sale, claimed depreciation is recaptured at up to 25%, and gains may owe capital-gains tax (a 1031 exchange can defer both). Figures are a year-1 estimate at your 24.0% rate — not tax advice; consult a CPA.
Schools (NCES district)
- District
- Shawnee Mission Pub Schools
- NCES district ID
- 2011640
- Math proficiency
- 38% ▼ -6.00%
- Reading proficiency
- 46% ▼ -2.00%
- Median HH income
- $64,923
- Composite
- 37.55/100
- National rank
- #4391
- State rank
- #22 of 169 in KS
Livability — Merriam
- Score
- 77/100
- State rank
- #43
- US rank
- #3248
Category grades
Schools grade is shown separately in the Schools card above.
Census & demographics
- Census place
- Merriam, KS
- County
- Johnson County · 574,662 people
- Metro
- Kansas City, MO-KS
- Population (ZIP)
- 19,441
- Household income
- $75,869
- Rent vs Own
- Severe rent burden
- 542.0
Population outlook (Johnson County) Hauer SSP2
- Today (2025)
- 663,396 people
- By 2030
- 702,585 · +5.9%
- By 2040
- 775,386 · +16.9%
- By 2050
- 841,772 · +26.9%
- By 2075
- 994,137 · +49.9%
- By 2100
- 1,073,036 · +61.7%
Race, ethnicity, and origin ACS 2023
- Neighborhood character
- Predominantly White (72%)
- Race & ethnicity
- White 72% Hispanic / Latino 14% Two or more races 7% Black 5% Asian 4%
- Hispanic origin (detail)
- Mexican 9%
- Common ancestry
- Lithuanian 3% Italian 2% Portuguese 2%
- Foreign-born
- 10% · Canada, South Korea
- Languages at home
- 85% English-only · Spanish 10% Other Asian/Pacific 1% Tagalog/Filipino 1%
Political lean MEDSL · Johnson
- 2024 margin
- Lean D (+8.5) · D 53.4% · R 44.9% · Other 1.8%
- 2008→2024 swing
- +17.5pp toward D · 2008: -9.0pp · 2024: 8.5pp
- All cycles
- 2024: D+8.5 2020: D+8.2 2016: R+2.7 2012: R+17.8 2008: R+9.0
Not yet ingested
- Civics
- —
Market trends
- HPI YoY
- ▼ -262.92%
- Current HPI
- 269.0762
- Rent YoY
- —
- Metro
- Kansas City, MO-KS
- State GDP YoY
- —
- F500 in state
- 0
Price history
+115.8% since first listed9 events — show timeline
- 2026-05-11 Price Changed $205,000 Heartland MLS as Distributed by MLS Grid
- 2026-04-20 Relisted — Heartland MLS as Distributed by MLS Grid
- 2026-04-15 Listing Removed — Heartland MLS as Distributed by MLS Grid
- 2026-04-13 Listed $210,000 Heartland MLS as Distributed by MLS Grid
- 2026-04-13 Coming Soon $210,000 Heartland MLS as Distributed by MLS Grid
- 2021-01-27 Sold (Public Records) — Public Records
- 2021-01-26 Sold (MLS) — Heartland MLS as Distributed by MLS Grid
- 2020-12-18 Pending — Heartland MLS as Distributed by MLS Grid
- 2020-12-17 Listed $95,000 Heartland MLS as Distributed by MLS Grid
Property tax history
+9.0%/yrLatest (2025): $2,088 · +13.3% YoY. Source: county tax records.
Cash-flow waterfall
monthlySold comps — $/sqft
last 12 mo · ≤1 miLoading sold comps…