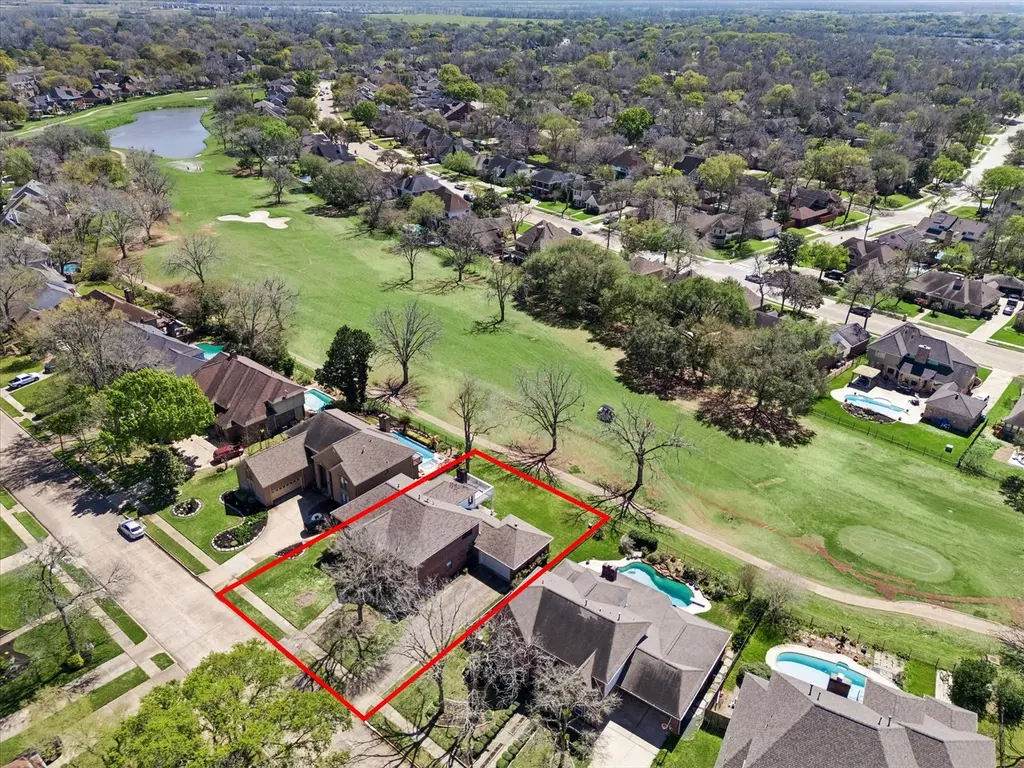
1707 Rambling Stone Dr · Pecan Grove, TX
Flood risk 4/10 · Minor
- FEMA flood zone
- X
- Chance of flooding over 30 yrs
- 0.24%
- Est. flood insurance / yr
- $507 – $1,088
Fire risk 3/10 · Minor
- Est. fire insurance / yr
- $1,222 – $2,270
Heat risk 9/10 · Severe
- Hot days now (above 110°F)
- 7 days/yr
- Hot days in 30 yrs
- 23 days/yr
Wind risk 9/10 · Severe
- Chance of severe wind over 30 yrs
- 99.0%
Air-quality risk 2/10 · Minimal
- Unhealthy air days now
- 1 days/yr
- Unhealthy air days in 30 yrs
- 2 days/yr
Risk factors via First Street. Map © Google.
Why this score? — see what drove the D grade
The composite is a weighted blend of 9 inputs, each scored 0–100. Each bar is that input's sub-score; the figure is the points it added to the 100-point composite (weight × sub-score).
- ARV discount +11.3/15.0
- Cash flow +10.5/30.0
- Schools +4.5/10.0
- 1% rule +4.0/10.0
- Livability +3.6/5.0
- DSCR +3.0/10.0
- Condition / age +2.5/5.0
- Rent growth +2.1/5.0
- Appreciation +0.0/10.0
$449,000
🖨 Deal sheet (PDF) 📄 Offer letter ✓ Due diligence
Listing remarks MLS
PRICED TO SELL! PRIME GOLF COURSE LOT WITH TWO PRIMARY SUITES! Positioned along the golf course, this beautifully refreshed two-story home delivers exceptional space, flexibility, and serene views. Fresh interior paint enhances the bright, open feel, while oversized windows fill the home with natural light and showcase the peaceful fairway backdrop. Designed for both everyday living and entertaining, the expansive layout features multiple LARGE living areas and generously sized rooms throughout. A standout feature is the TWO PRIMARY SUITES—one downstairs, one upstairs—creating the perfect multi-generational setup or ideal arrangement for long-term guests. The upstairs offers additional oversized bedrooms and a spacious gameroom. Step outside to enjoy the covered patio and PRIVATE BALCONY overlooking the golf course, perfect for morning coffee or evening relaxation. With its rare combination of size, layout, and golf course setting, this home offers a lifestyle that is hard to find.
Key facts
- Private balcony
- Covered patio
- Two primary suites
Tags
Neighborhood map
What this means for you Summary
Snapshot
- This is a 4-bed/4.0-bath single-family listed at $449k.
Deal economics
- At list price, monthly cash flow is $-227 ($-3k/yr) — negative.
- To cash-flow at today's rent, offer at most $409k (8.9% below list).
- To meet the 1% rule (rent ≥ 1% of price), the offer needs to be $405k (9.9% below list).
- Recommended offer: $405k (9.9% below list) — sets the bar for 1% rule.
- Cap rate 5.7% vs local median 2.2% in Pecan Grove — top-decile yield for the area; either an underpriced asset or a hidden risk that comps aren't pricing in. Stress-test before assuming the spread holds.
Location & tenants
- Location reads 72/100 on livability (#256 in TX) — a middle-class / working-renter tenant base. Strengths: employment A+, housing A+, crime A; Watch: amenities F, commute F, health & safety F.
- Fort Bend ISD (suburban): math 44% / reading 53% proficiency, ranked #140 of 826 in TX (top 17%) — families likely to look elsewhere, expect single-tenant / working-renter base with shorter leases.
- Zoned schools: Pecan Grove El (math 49% / reading 53%, grade C-, #818 of 4,322 statewide, top 19%, 763 students, 33% FRL); James Bowie Middle (math 45% / reading 53%, grade C-, #378 of 1,662 statewide, top 23%, 1,639 students, 41% FRL); Fort Bend Co Alter (26 students, 0% FRL).
- Market conditions: Rents soft (-1.6%/yr); 1238 active listings in the ZIP; 2 comparable units currently listed for rent nearby; high-income renter base; 12,093 units permitted in Fort Bend County in 2024 (815 in 5+ unit buildings).
- This rent runs 34% of the median local income ($142k/yr) — at the standard rent-burdened threshold; future hikes will face affordability resistance.
Forward outlook
- Local home prices are declining (-3.0%/yr); year-one equity from $3k of loan paydown is wiped out by about $13k of value loss. Plan a longer hold.
- Fort Bend County population projected at +75% by 2050 — long-run rental-demand tailwind backs the buy-and-hold thesis.
Negotiation context
- It's been on market 88 days — a 6% lower offer ($422k) is reasonable based on typical stale-listing flexibility.
- 11 sale attempts since 16y ago with the ask held roughly flat each time — persistent listings suggest the price (not the market) is what's stuck; bring a comps-based counter.
Risks & watch-outs
- Climate carrying-cost: severe wind risk, 99% chance of damaging wind over 30y; extreme-heat days projected 7→23/yr by 2055 (HVAC capex compounding) — expect insurance premiums to compound above CPI over the hold.
Questions for the listing agent
- What do current leases actually rent for vs. the listed asking? Can we see a recent rent roll and the last 12 months of T-12 income?
- It's been on market 88 days. Have you received any prior offers? Is the seller open to a 10% concession, seller financing, or rate buy-down credit?
- What does the HOA fee cover, when was the last increase, and are there any pending special assessments or reserve-fund shortfalls?
- Why hasn't it sold? Are there any deal-killer items the seller is aware of (foundation, flood, title, zoning, code violations)?
- Is there a deadline driving the sale (1031 exchange, divorce, estate, relocation)? That informs how much negotiation room exists.
- The area grade is low — what's the realistic commute time and amenity access for the typical tenant pool here? Any planned neighborhood developments (good or bad) we should know about?
- What's the average days-on-market for RENTAL listings here right now (not sales)? A rising rental-DOM trend means longer vacancies and softer asking-rent achievability than the comps imply.
- What's the recent tenant-quality profile in this submarket — average credit score on applications, eviction rate, late-payment / NSF rate, and stable-employment percentage? A property-management company in the area should have these aggregated.
- How much new for-sale + rental construction is in the pipeline within 1–3 miles? Heavy new supply typically softens prices + rents 12–24 months out; constrained supply supports both.
Investment metrics
- 1% rule
- 0.90% ✗
- Cap rate
- 5.69%
- Cash-on-cash
- -2.17%
- DSCR
- 0.90
- GRM
- 9.2
CMA / ARV
- ARV (median comp)
- $489,872
- List price
- $449,000
- Delta
- -8.34%
- Verdict
- FAIR
- Comps
- 20 within 1.0 mi
Show comp detail 12 sales within ~0.75 mi
| Address | Dist | Beds/Ba | Sqft | Sold | Price | $/sf | Match |
|---|---|---|---|---|---|---|---|
| 2623 Old South Dr | 0.40mi | 4/3.5 | 4,203 (+1%) | 11mo | $649,000 | $154 | 68 |
| 2107 Pecan Trail Dr | 0.50mi | 4/3.5 | 4,341 (+5%) | 1mo | $649,900 | $150 | 66 |
| 1818 Wildwood Ln | 0.46mi | 4/3.5 | 4,125 (-1%) | 12mo | $570,000 | $138 | 65 |
| 2006 Summerland Ct | 0.40mi | 3/3.5 (-1) | 3,905 (-6%) | 1mo | $665,000 | $170 | 64 |
| 2114 Summerland Dr N | 0.47mi | 4/4.0 | 4,305 (+4%) | 11mo | $700,000 | $163 | 63 |
| 2111 S Pecan Trail Dr | 0.44mi | 5/4.0 (+1) | 3,866 (-7%) | 4mo | $574,000 | $148 | 59 |
| 1707 Urban Harvest Dr | 0.70mi | 4/4.0 | 4,162 (+0%) | 11mo | $840,000 | $202 | 58 |
| 1726 Yellow Iris Trl | 0.52mi | 5/5.5 (+1) | 4,189 (+1%) | 12mo | $760,000 | $181 | 53 |
| 1630 Yellow Iris Trl | 0.57mi | 5/4.5 (+1) | 4,405 (+6%) | 5mo | $949,800 | $216 | 52 |
| 2031 Pecan Trail Dr | 0.48mi | 5/3.5 (+1) | 4,734 (+14%) | 4mo | $740,000 | $156 | 44 |
| 1202 Plantation Dr | 0.59mi | 5/3.5 (+1) | 3,539 (-15%) | 1mo | $499,900 | $141 | 40 |
| 1702 Urban Harvest Dr | 0.69mi | 4/3.5 | 3,604 (-13%) | 12mo | $799,000 | $222 | 34 |
Match score weights: distance 35% · size 25% · config 20% · recency 20%. Top-matched comps best support the ARV.
Projected returns pro-forma
-3.0% appreciation · 0.0% rent growth · sell at horizon
- IRR
- -23.6%
- Equity multiple
- 0.21×
- Total profit
- $-98,810
- Equity at exit
- $66,947
- IRR
- -31.5%
- Equity multiple
- -0.19×
- Total profit
- $-149,427
- Equity at exit
- $38,821
Cash invested: $125,720 (down + closing). Projections, not guarantees.
Landlord ↔ Tenant lean methodology
- Overall (STATE)
- 87 Strongly Landlord-Friendly
- State Texas
- 87 Strongly Landlord-Friendly · R+5
- County
- — inherits STATE
- City
- — inherits STATE
ZIP-level market 77406
- Home prices YoY
- -26.2%
- Rents YoY
- -1.6%
- Active inventory
- 1238
- Price-to-rent
- 9.2×
Monthly cashflow live
- Estimated rent
- $4,046 medium interval (Pro) →
- Mortgage (P&I)
- −$2,355
- Tax from tax record
- −$858 /mo · $10,299/yr
- Insurance
- −$187
- HOA
- −$23
- Vacancy / Maint / Mgmt
- −$850
- Net cashflow
- $-227
Break-even live
Sensitivity live
| Price | -10% $27 | -5% $-100 | +0% $-227 | +5% $-354 | +10% $-481 |
|---|---|---|---|---|---|
| Rent | -10% $-547 | -5% $-387 | +0% $-227 | +5% $-67 | +10% $93 |
| Rate | -1.0pp $-1 | -0.5pp $-113 | base $-227 | +0.5pp $-343 | +1.0pp $-462 |
UW: 25.0% down · 7.5% · 30yr · 1.5% tax · 5.0% vac · 8.0% maint · 8.0% mgmt
Financing live
Cash to close
- Down payment
- $112,250
- Closing costs
- $13,470
- Reserves months
- —
- Total cash needed
- —
Loan-product check · same deal, 3 products live
Conventional
25% down · 7.5% · 30yr
- Down + closing
- —
- Monthly P&I
- —
- Monthly cashflow
- —
- DSCR
- —
- Eligible?
- —
Personal DTI + credit; lowest rate.
DSCR
20% down · 8.5% · 30yr
- Down + closing
- —
- Monthly P&I
- —
- Monthly cashflow
- —
- DSCR
- —
- Eligible?
- —
No personal income docs; deal must DSCR.
Hard money
10% down · 12.0% · 12mo
- Down + closing
- —
- Monthly P&I
- —
- Monthly cashflow
- —
- DSCR
- —
- Eligible?
- —
Short-term bridge; refi at stabilization.
Rent comps 2 comps
| Address | Beds | Baths | Sqft | Rent | $/sqft | DOM | Units | Dist |
|---|---|---|---|---|---|---|---|---|
| 331 Old Silo St Richmond, TX | 4.0 | 3.5 | 3568 | $5,500 | $1.54 | 6d | 1 | 1.41mi |
| 331 Old Silo St Richmond, TX | 4.0 | 3.5 | 3568 | $5,500 | $1.54 | 20d | 1 | 1.41mi |
HOA detail
- Monthly dues
- $23 · $276/yr
Listing history 38 events
-
2026-06-18days on market $449,000 Pending 88 DOM
-
2026-06-17days on market $449,000 Pending 87 DOM
-
2026-06-16days on market $449,000 Pending 86 DOM
-
2026-06-15days on market $449,000 Pending 85 DOM
-
2026-06-13statusdays on market $449,000 Pending 83 DOM
-
2026-06-09days on market $449,000 Active 79 DOM
-
2026-06-07days on market $449,000 Active 77 DOM
-
2026-06-04days on market $449,000 Active 74 DOM
-
2026-06-03days on market $449,000 Active 73 DOM
-
2026-06-02days on market $449,000 Active 72 DOM
-
2026-06-01days on market $449,000 Active 71 DOM
-
2026-05-31days on market $449,000 Active 70 DOM
-
2026-05-06price $449,000 1010-char remark
Show marketing remark (1010 chars)
PRICED TO SELL! PRIME GOLF COURSE LOT WITH TWO PRIMARY SUITES! Positioned along the golf course, this beautifully refreshed two-story home delivers exceptional space, flexibility, and serene views. Fresh interior paint enhances the bright, open feel, while oversized windows fill the home with natural light and showcase the peaceful fairway backdrop. Designed for both everyday living and entertaining, the expansive layout features multiple LARGE living areas and generously sized rooms throughout. A standout feature is the TWO PRIMARY SUITES—one downstairs, one upstairs—creating the perfect multi-generational setup or ideal arrangement for long-term guests. The upstairs offers additional oversized bedrooms and a spacious gameroom. Step outside to enjoy the covered patio and PRIVATE BALCONY overlooking the golf course, perfect for morning coffee or evening relaxation. With its rare combination of size, layout, and golf course setting, this home offers a lifestyle that is hard to find.
-
2026-03-22$468,500 Active 1010-char remark
Show marketing remark (1010 chars)
PRICED TO SELL! PRIME GOLF COURSE LOT WITH TWO PRIMARY SUITES! Positioned along the golf course, this beautifully refreshed two-story home delivers exceptional space, flexibility, and serene views. Fresh interior paint enhances the bright, open feel, while oversized windows fill the home with natural light and showcase the peaceful fairway backdrop. Designed for both everyday living and entertaining, the expansive layout features multiple LARGE living areas and generously sized rooms throughout. A standout feature is the TWO PRIMARY SUITES—one downstairs, one upstairs—creating the perfect multi-generational setup or ideal arrangement for long-term guests. The upstairs offers additional oversized bedrooms and a spacious gameroom. Step outside to enjoy the covered patio and PRIVATE BALCONY overlooking the golf course, perfect for morning coffee or evening relaxation. With its rare combination of size, layout, and golf course setting, this home offers a lifestyle that is hard to find.
-
2026-03-11historical
-
2026-01-28status Active
-
2026-01-25status Pending
-
2026-01-16status Pending
-
2025-11-14$499,000 Active
-
2024-08-27historical $3,000
-
2024-08-06price $3,000
-
2024-04-24$3,300
-
2018-06-07historical
-
2018-05-23price $360,000
-
2018-05-10$375,000 Active
-
2018-05-06historical
-
2018-01-22$375,000 Active
-
2017-12-19historical
-
2017-08-01status Active
-
2017-07-31historical
-
2017-06-01price $375,000
-
2017-04-25$387,495 Active
-
2017-03-31historical
-
2017-01-25$389,000 Active
-
2017-01-23historical
-
2016-10-06$389,000 Active
-
2010-07-20historical
-
2010-06-04$299,900
ⓘ Source: listings_history table (triggers on properties + properties_extension) + one-shot
backfill from property_details.listing_events for pre-trigger history.
Tax reassessment forecast TX · Resets to sale price
- Current annual tax
- $10,299 · $858/mo
- Projected year-2 tax
- $10,299 · $858/mo
- Expected delta
- $0/yr ($0/mo · 0.0%)
ⓘ Screening estimate from a state-policy table — verify with the county assessor before closing.
Climate risk First Street
- Flood 4/10 Moderate FEMA zone X · 24% chance over 30 yrs
- Wildfire 3/10 Moderate
- Heat 9/10 Extreme 7 d/yr ≥110°F today · 23 d/yr by 30 yrs out
- Wind 9/10 Extreme 99% chance of damaging wind over 30 yrs
- Air quality 2/10 Low 1 unhealthy d/yr today · 2 by 30 yrs out
Nearby sold comps map
Loading sold comps map…
Walkable amenities ~0.75 mi
Loading nearby amenities…
Taxation est. · year 1
- Rental income
- $48,547
- − Mortgage interest
- −$25,151
- − Property taxes
- −$10,299
- − Insurance
- −$2,245
- − Repairs & maintenance
- −$3,884
- − Management
- −$3,884
- − HOA
- −$276
- − Depreciation
- −$13,062
- Taxable loss
- −$10,254
- Est. tax savings @ 24.0%
- +$2,461
- After-tax cash flow
- $-263/yr
For passive investors: Depreciation is non-cash, so a rental often shows a tax loss while cash-flowing — sheltering income. Rental losses are passive: they offset passive income freely, and up to $25,000/yr can offset ordinary (W-2) income if you actively participate and your MAGI is under $100k (phasing out to $0 by $150k); unused losses carry forward. On sale, claimed depreciation is recaptured at up to 25%, and gains may owe capital-gains tax (a 1031 exchange can defer both). Figures are a year-1 estimate at your 24.0% rate — not tax advice; consult a CPA.
Schools (NCES district)
- District
- Fort Bend ISD
- NCES district ID
- 4819650
- Math proficiency
- 44% ▼ -15.00%
- Reading proficiency
- 53% ▼ -4.00%
- Median HH income
- $82,360
- Composite
- 44.61/100
- National rank
- #2779
- State rank
- #140 of 826 in TX
Livability — Pecan Grove
- Score
- 72/100
- State rank
- #256
- US rank
- #6017
Category grades
Schools grade is shown separately in the Schools card above.
Census & demographics
- Census place
- Pecan Grove, TX
- County
- Fort Bend County · 836,777 people
- Metro
- Houston-The Woodlands-Sugar Land, TX
- Population (ZIP)
- 69,918
- Household income
- $141,869
- Rent vs Own
- Severe rent burden
- 575.0
Population outlook (Fort Bend County) Hauer SSP2
- Today (2025)
- 1,004,526 people
- By 2030
- 1,153,104 · +14.8%
- By 2040
- 1,453,718 · +44.7%
- By 2050
- 1,753,781 · +74.6%
- By 2075
- 2,455,772 · +144.5%
- By 2100
- 2,930,528 · +191.7%
Race, ethnicity, and origin ACS 2023
- Neighborhood character
- Highly diverse neighborhood (Simpson 0.72)
- Race & ethnicity
- White 43% Hispanic / Latino 26% Two or more races 15% Black 14% Asian 12%
- Hispanic origin (detail)
- Mexican 18% Puerto Rican 1%
- Common ancestry
- Lithuanian 2% Romanian 1% Iranian 1%
- Foreign-born
- 17% · Canada, Vietnam, China
- Languages at home
- 73% English-only · Spanish 14% Other Indo-European 3% Vietnamese 2%
Political lean MEDSL · Fort Bend
- 2024 margin
- Toss-up / Even · D 49.5% · R 47.9% · Other 2.6%
- 2008→2024 swing
- +4.0pp toward D · 2008: -2.4pp · 2024: 1.6pp
- All cycles
- 2024: D+1.6 2020: D+10.6 2016: D+6.6 2012: R+6.8 2008: R+2.4
Not yet ingested
- Civics
- —
Market trends
- HPI YoY
- ▼ -79.18%
- Current HPI
- 222.9525
- Rent YoY
- ▼ -1.61%
- Metro
- Houston-The Woodlands-Sugar Land, TX
- State GDP YoY
- ▲ 3.95%
- F500 in state
- 110
Industry mix (Fortune 500 HQ in TX)
| Industry | F500 HQs | Revenue |
|---|---|---|
| Energy | 16 | $1,198B |
|
||
| Technology | 5 | $198B |
|
||
| Engineering / Construction | 4 | $72B |
|
||
| Energy Services | 3 | $60B |
|
||
| Utilities | 3 | $41B |
|
||
| Healthcare | 2 | $330B |
|
||
Price history
+49.7% since first listed26 events — show timeline
- 2026-05-06 Price Changed $449,000 HARMLS
- 2026-03-22 Listed $468,500 HARMLS
- 2026-03-11 Listing Removed — HARMLS
- 2026-01-28 Relisted — HARMLS
- 2026-01-25 Pending — HARMLS
- 2026-01-16 Pending — HARMLS
- 2025-11-14 Listed $499,000 HARMLS
- 2024-08-27 Rental Removed $3,000 HARMLS
- 2024-08-06 Price Changed $3,000 HARMLS
- 2024-04-24 Listed for Rent $3,300 HARMLS
- 2018-06-07 Listing Removed — HARMLS
- 2018-05-23 Price Changed $360,000 HARMLS
- 2018-05-10 Listed $375,000 HARMLS
- 2018-05-06 Listing Removed — HARMLS
- 2018-01-22 Listed $375,000 HARMLS
- 2017-12-19 Listing Removed — HARMLS
- 2017-08-01 Relisted — HARMLS
- 2017-07-31 Listing Removed — HARMLS
- 2017-06-01 Price Changed $375,000 HARMLS
- 2017-04-25 Listed $387,495 HARMLS
- 2017-03-31 Listing Removed — HARMLS
- 2017-01-25 Listed $389,000 HARMLS
- 2017-01-23 Listing Removed — HARMLS
- 2016-10-06 Listed $389,000 HARMLS
- 2010-07-20 Listing Removed — HARMLS
- 2010-06-04 Listed $299,900 HARMLS
Property tax history
+3.0%/yrLatest (2025): $10,299 · +2.4% YoY. Source: county tax records.
Cash-flow waterfall
monthlySold comps — $/sqft
last 12 mo · ≤1 miLoading sold comps…